Redlight/Greenlight—What Are the Risk On and Risk Off Strategies You Should Be Considering Right Now?
KEY OBSERVATIONS
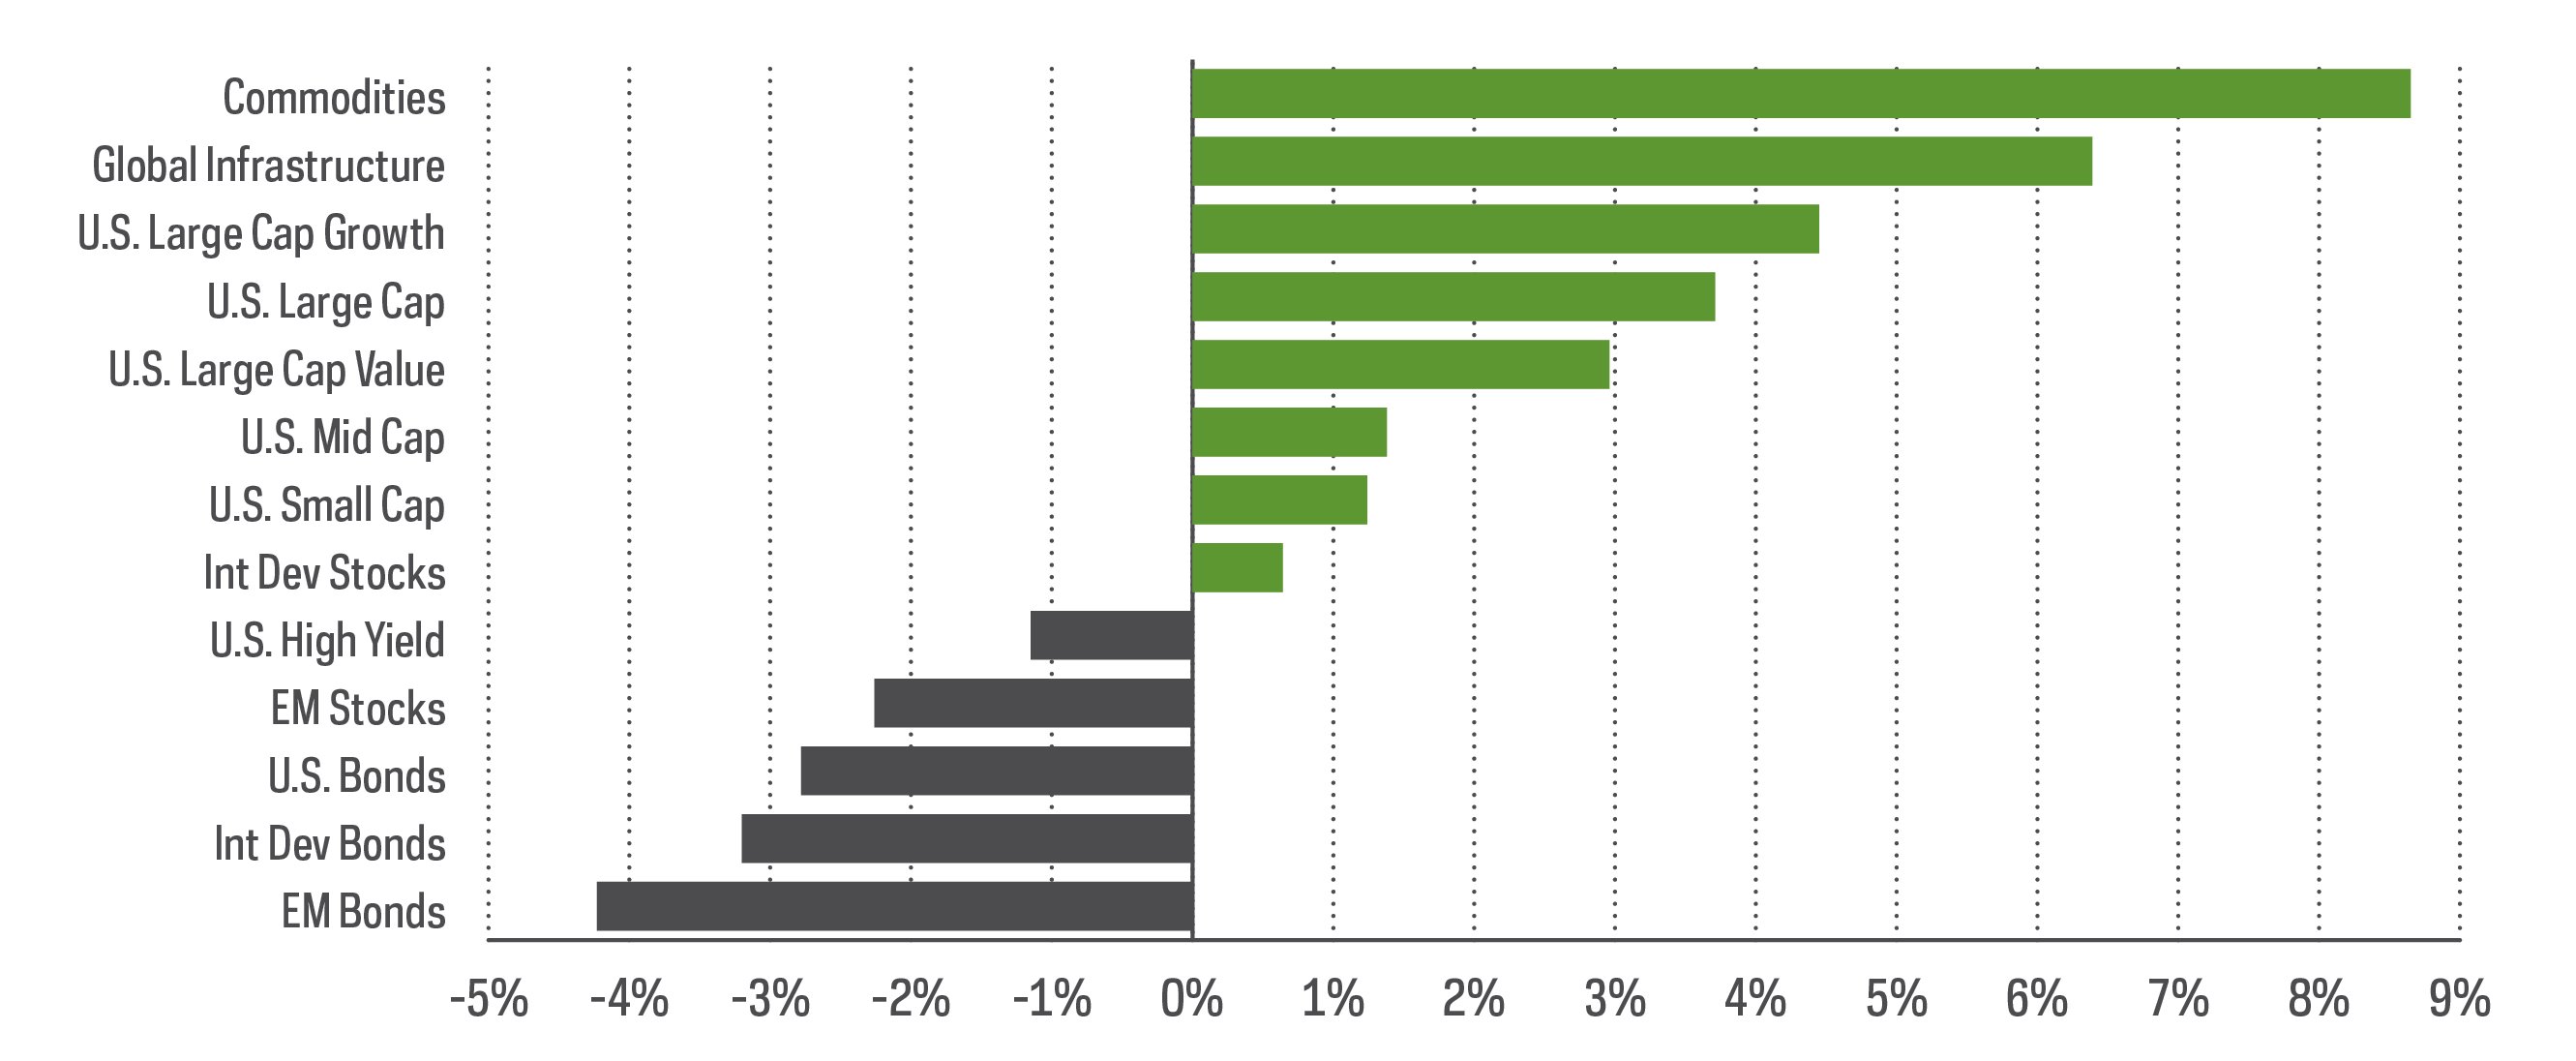
What trades are risk on, and what’s risk off in the current climate? With the war in Ukraine continuing, an extremely brief flight-to-safety Treasury rally was followed in March by a month of stocks solidly in the green and bonds in the red.
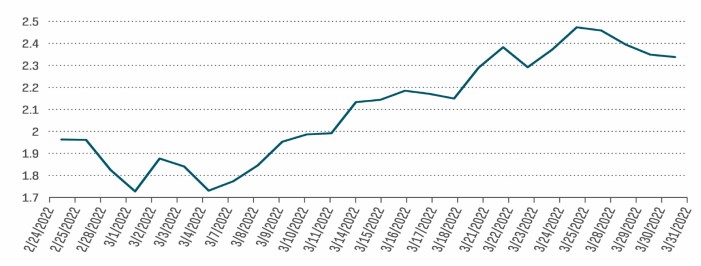
Some people seem to believe that the past month’s stock rally has been driven by just how unattractive bonds have been. Inflation, rate hikes and quantitative tightening all point to a period of rising interest rates. And the direct relationship between rising yields and falling prices for bonds may be moving investors toward stocks, where at least the outcome is more ambiguous.
Other people have seen stocks as attractive in their own right, with ample earnings, cash flow and dividend growth to overcome current inflation and rising interest rates.
The choice doesn’t have to be binary:
-
Considering bonds: A range of indicators suggest that corporate credit is comparatively strong (see our fixed income section below). Bond strategies that focus on credit while considering opportunities to mitigate Treasury rate risk may be effective ways to maintain bond exposure, even in a rising interest rate environment.
-
Considering stocks: A well-constructed core allocation that delivers consistent earnings, cash flow and, particularly, dividend growth is never a bad idea. It is especially important in a rising rate environment. However, there are opportunities to “lean into” it. You might consider sectors like financials, energy and basic materials that can have a leg up in a rising rate environment. You might also look to a real-asset-adjacent strategy like infrastructure (see our equity section below), where attractive yields and pricing power can come into play.
We’ll leave the discussion of the “death of the 60/40 portfolio” for another day, but in the meantime, being extra clever about what’s in the 60% and what’s in the 40% makes a lot of sense.
Performance Recap
EQUITY PERSPECTIVES
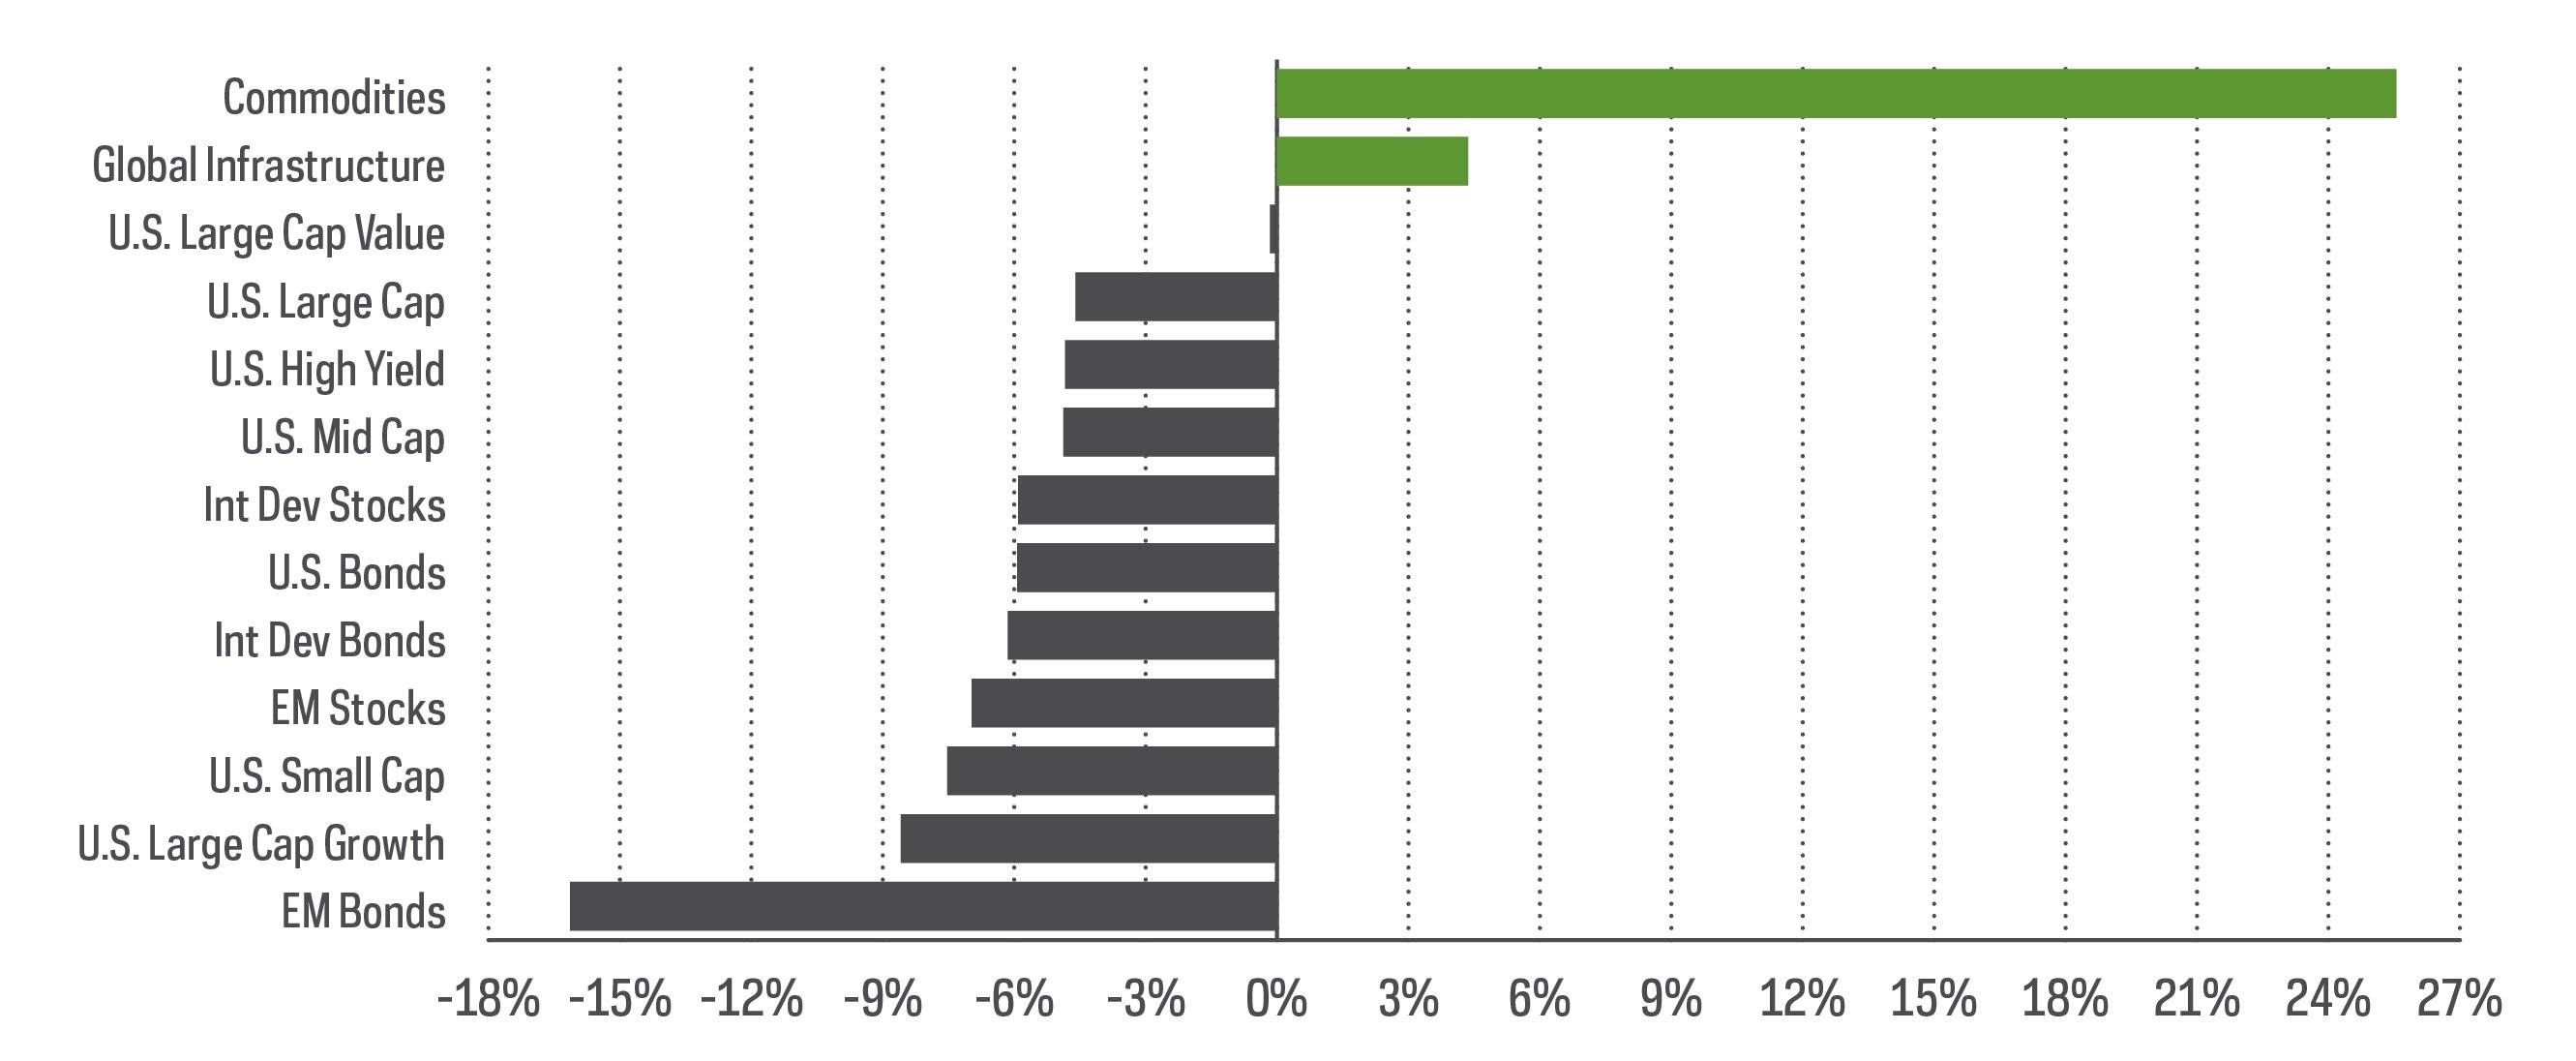
Positive equity performance returned in March after a difficult start to the year. First quarter returns for equities and bonds remain mostly in the red, however, indicating we’re not out of the woods just yet.
Indeed, the “timeless” 60% equity/40% bond allocation (based on 60% S&P 500/40% Bloomberg U.S. Aggregate Bond Index) remains down over 5% through March. Over the past few years, that classic framework has attracted scrutiny in terms of its worthiness as the gold standard for asset allocation. Given the prospect of rising rates, most of the attention recently has been focused on what to do with the 40%—the fixed income allocation. That’s fair, given the market conditions, but what to do with equities remains an equally valid question.
Taking thoughtful and measured equity risks is perhaps more relevant than ever, particularly when the market remains susceptible to large swings (given the macro risks the market is facing). Higher-risk equity strategies seem to have become fashionable again in some pockets of the market in March, based on a cursory look at flows. However, steady positive returns can be realized without taking undue risks.
We speak often about the appeal of dividend growth strategies based on the Dividend Aristocrats®—high-quality companies with the longest track records of consistent dividend growth within their given indexes—forming the core of a well-built portfolio.
-
Companies that grow dividends, regardless of the macro-economic circumstances, send a powerful signal to the market that they have confidence in their underlying businesses.
-
Dividend Aristocrats typically have qualities like stable earnings and resilient cash flows that are used to pay income streams that grow at attractive rates—a timeless strategy indeed.
A global infrastructure strategy can also be appealing, serving as a potentially powerful and diversifying equity component during periods of high inflation.
-
Owners and operators of transportation, energy, communication, and water assets (like toll roads, pipelines and cell towers) provide the essential things that we use in our lives every day.
-
These companies have unique investment characteristics typically producing stable and predictable cash flows that can translate to attractive levels of yield. Often, infrastructure companies can raise their revenues at rates commensurate with inflation, making them an especially timely strategy.
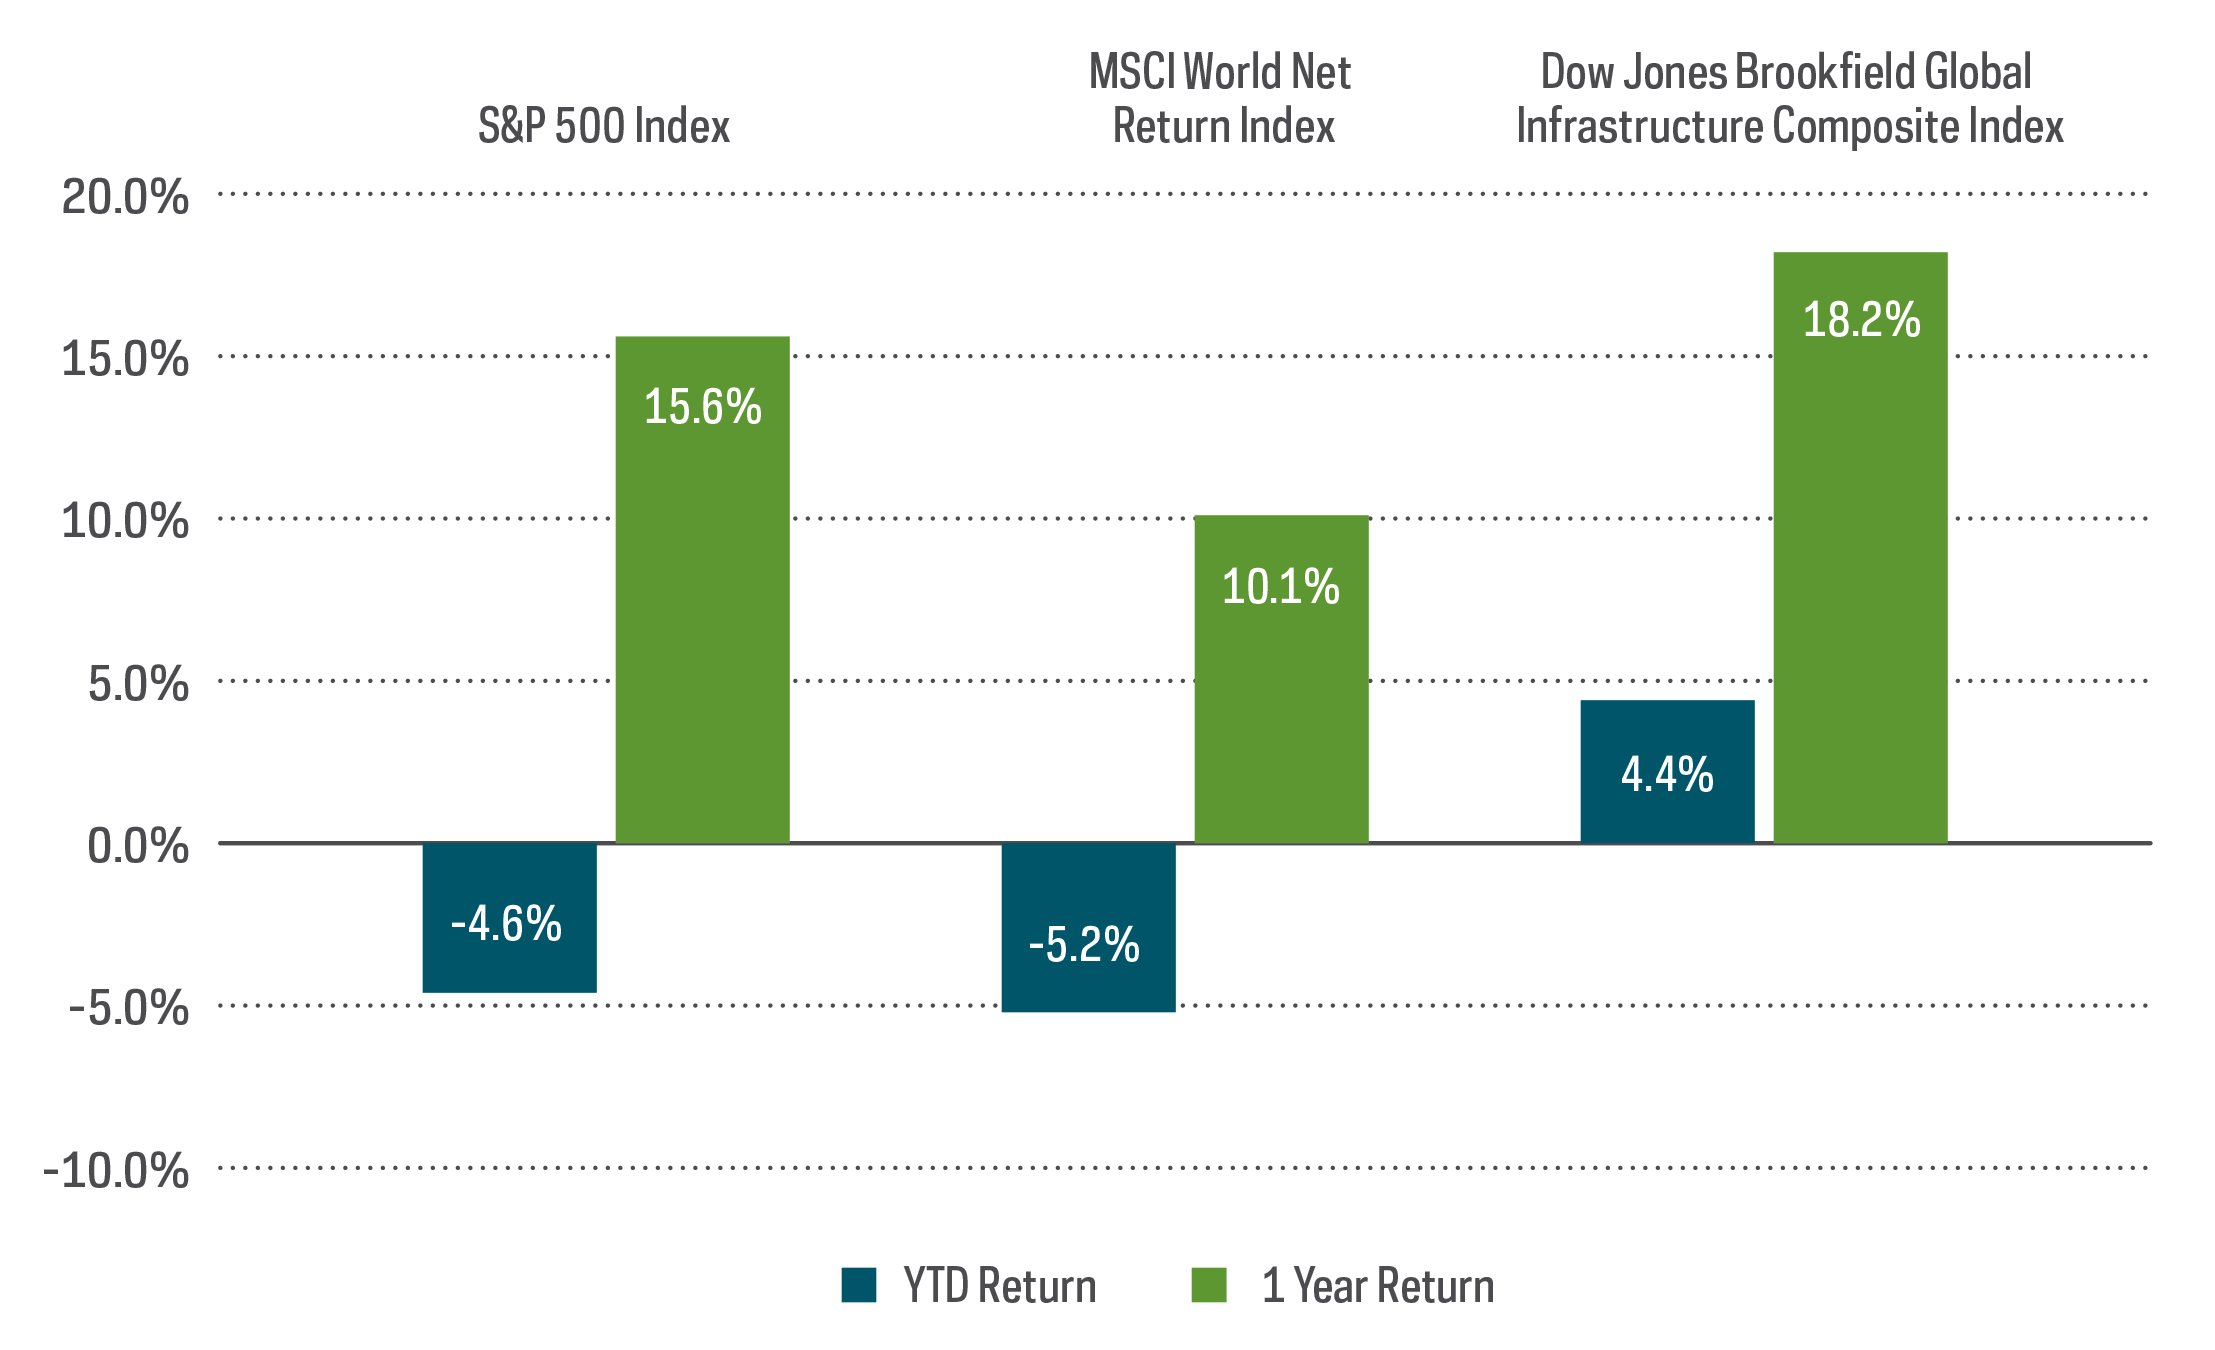
The Dow Jones Brookfield Global Infrastructure Composite Index tracks companies that generate the majority of their cash flows from the ownership and operation of infrastructure assets. The index has delivered attractive rates of return over time and outperformed domestic stocks and global stocks over both year-to-date and one-year periods, as measured by the S&P 500 and the MSCI World Index, respectively.
FIXED INCOME PERSPECTIVES
It was another tough month for bonds. In fact it was the bond market’s worst monthly performance so far this year when looking at the Bloomberg U.S. Aggregate Bond Index, which dropped 2.8% in March. Rising Treasury yields continued to hurt the prices of bonds with extended durations, while tightening credit spreads helped offset the impact for bonds entailing credit risk. Strategies that pinpoint credit risk as a source of potential return came out on top.
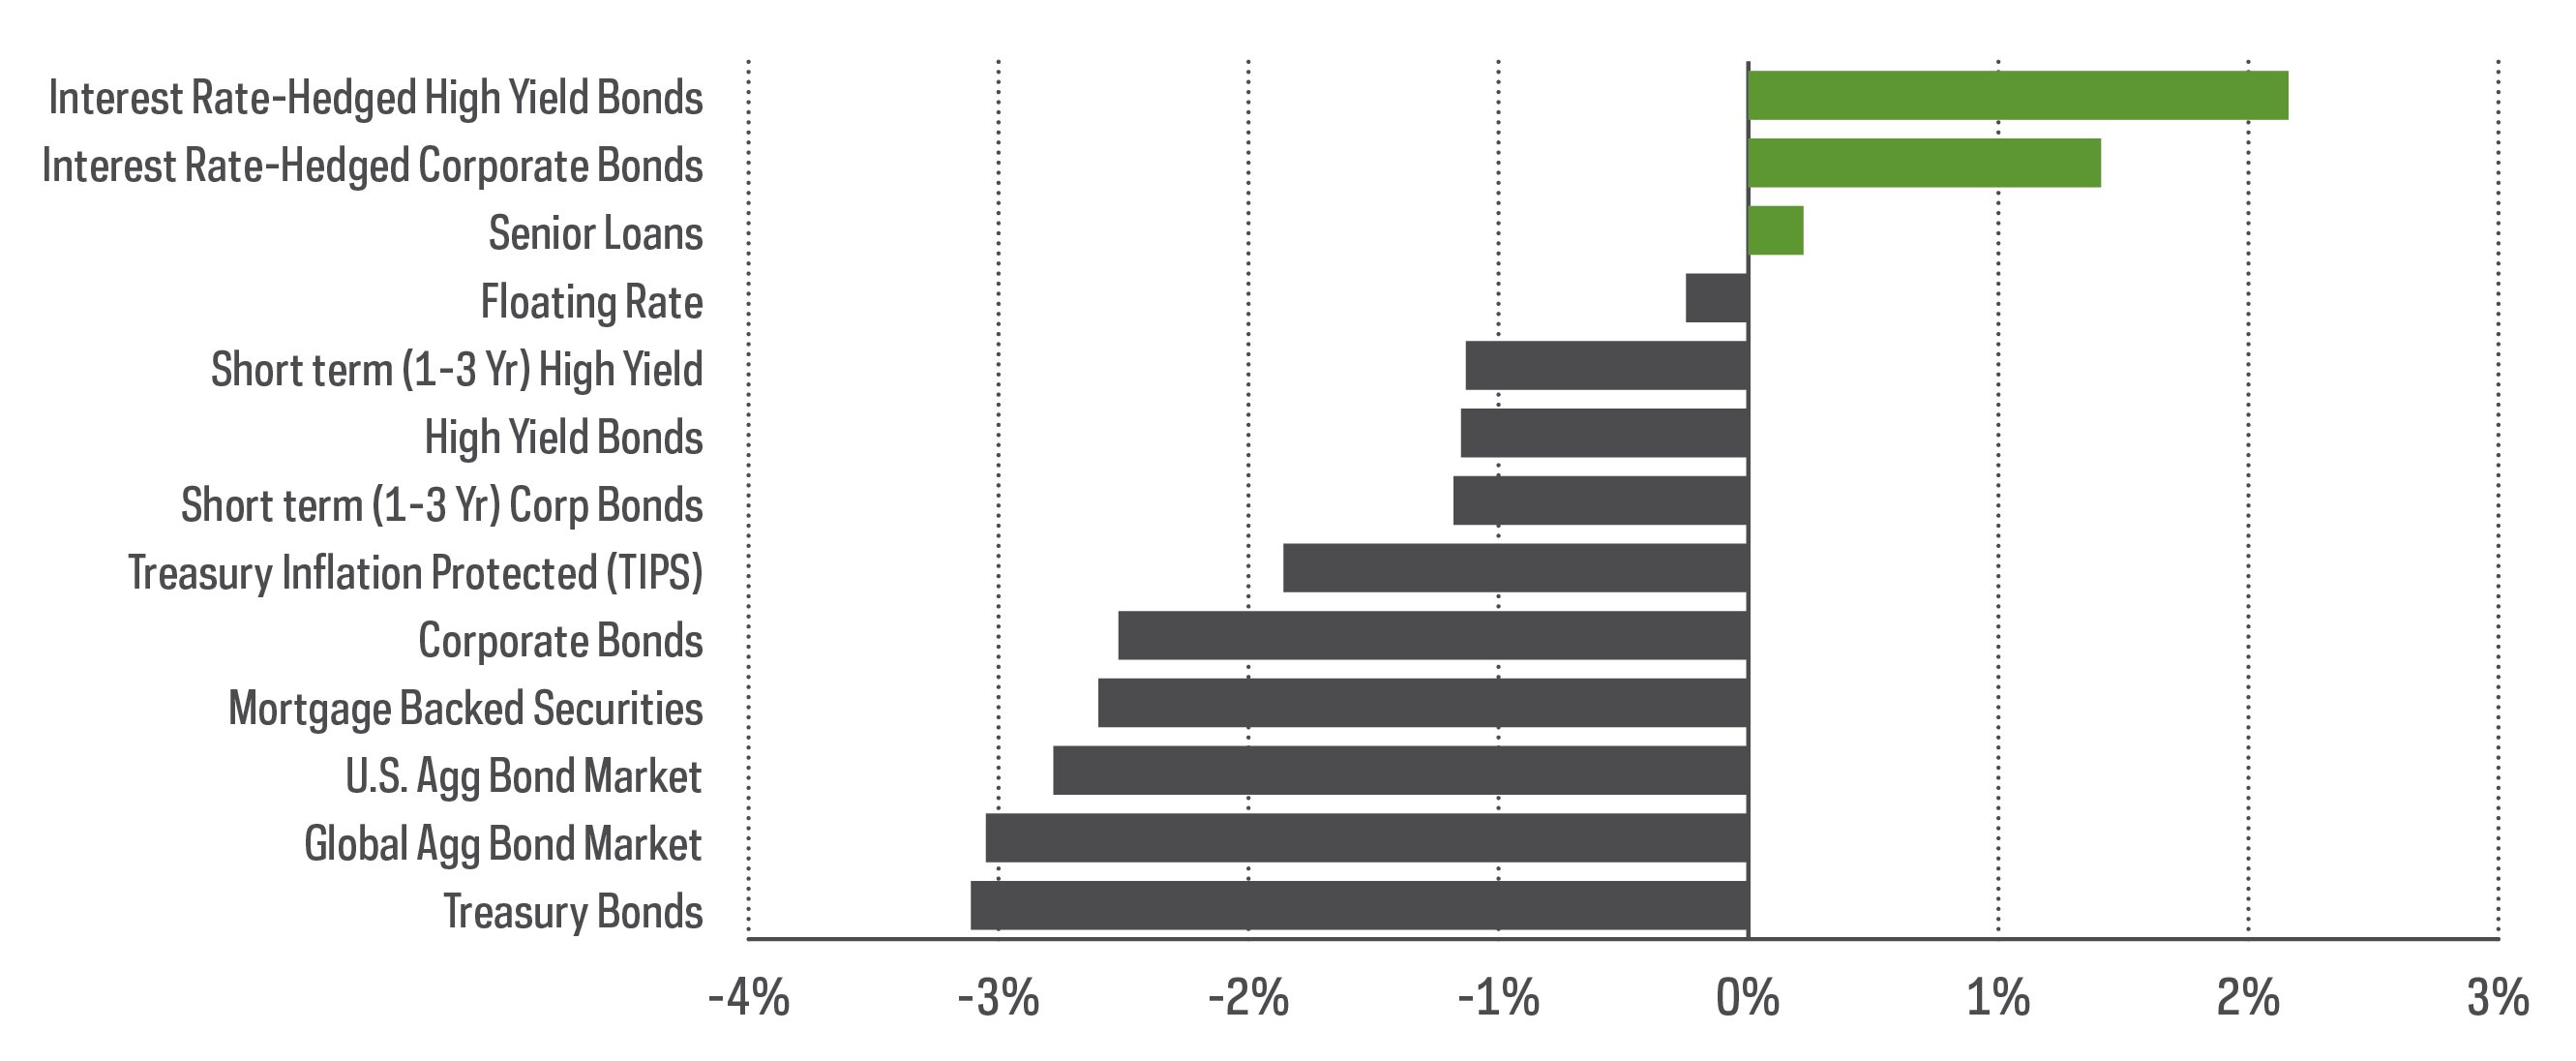
Treasury yields rose across the curve during the month, following the first rate hike from the Federal Reserve (the “Fed”). Interest rate senstive bonds have been beaten down since August of 2020, and their outlook continues to look bleak. The Fed’s latest dot plot indicates six more rate hikes this year, with officials expecting the Fed Funds Rate to end the year around 1.9%. Is it time for investors to cut their losses and reduce fixed income exposure?
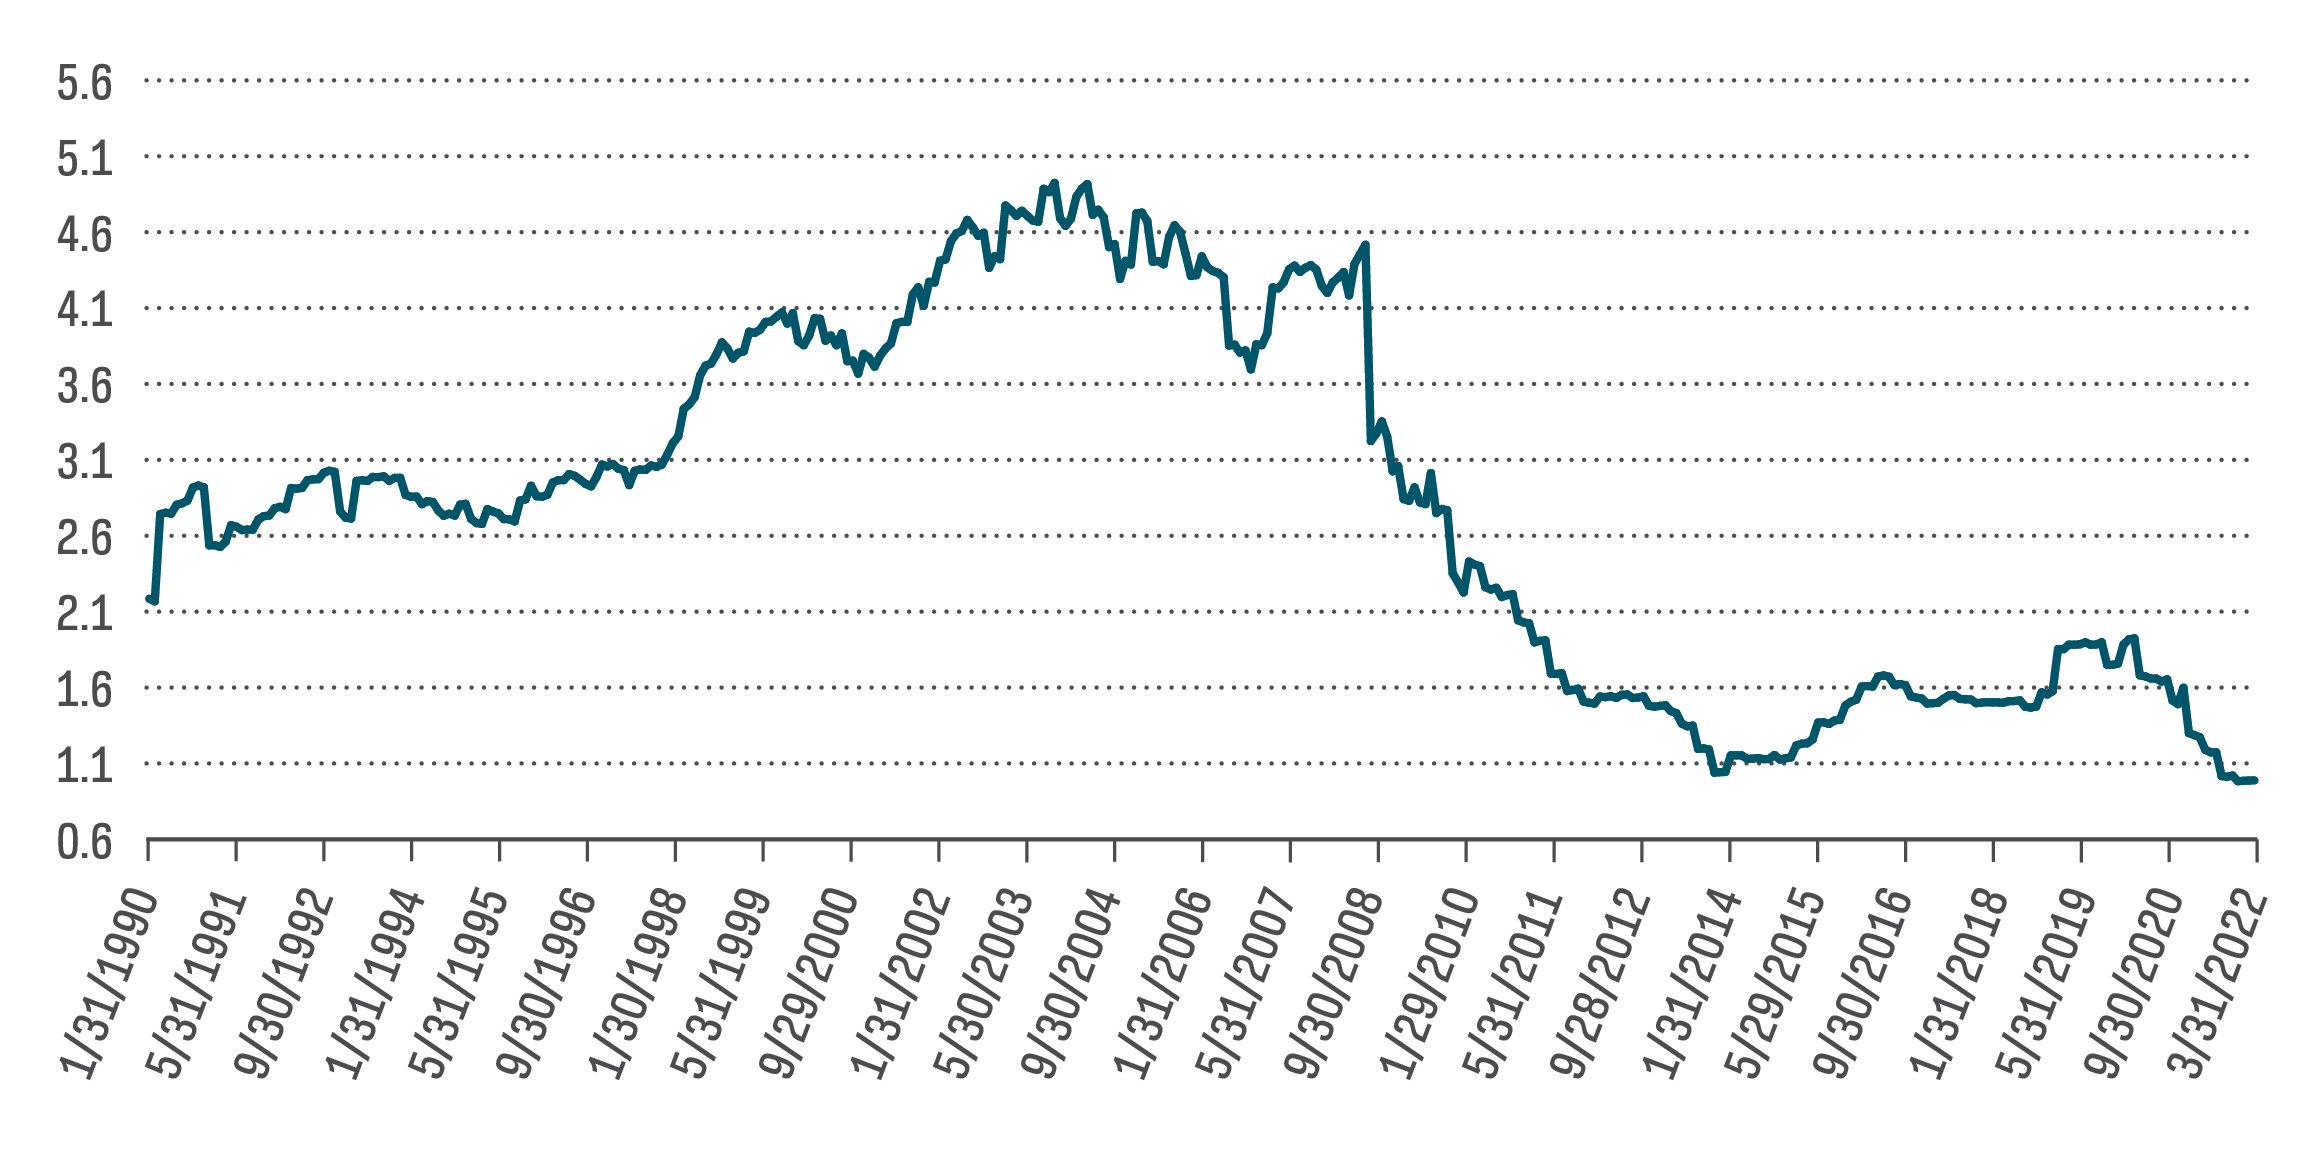
While interest rate risk is likely to detract from fixed income returns, the outlook for credit risk is a bit better. Corporate leverage is at historic lows when looking at Net Debt/EBITDA ratios, indicating that in the aggregate, companies in the United States may be in a strong financial position to pay off debt.
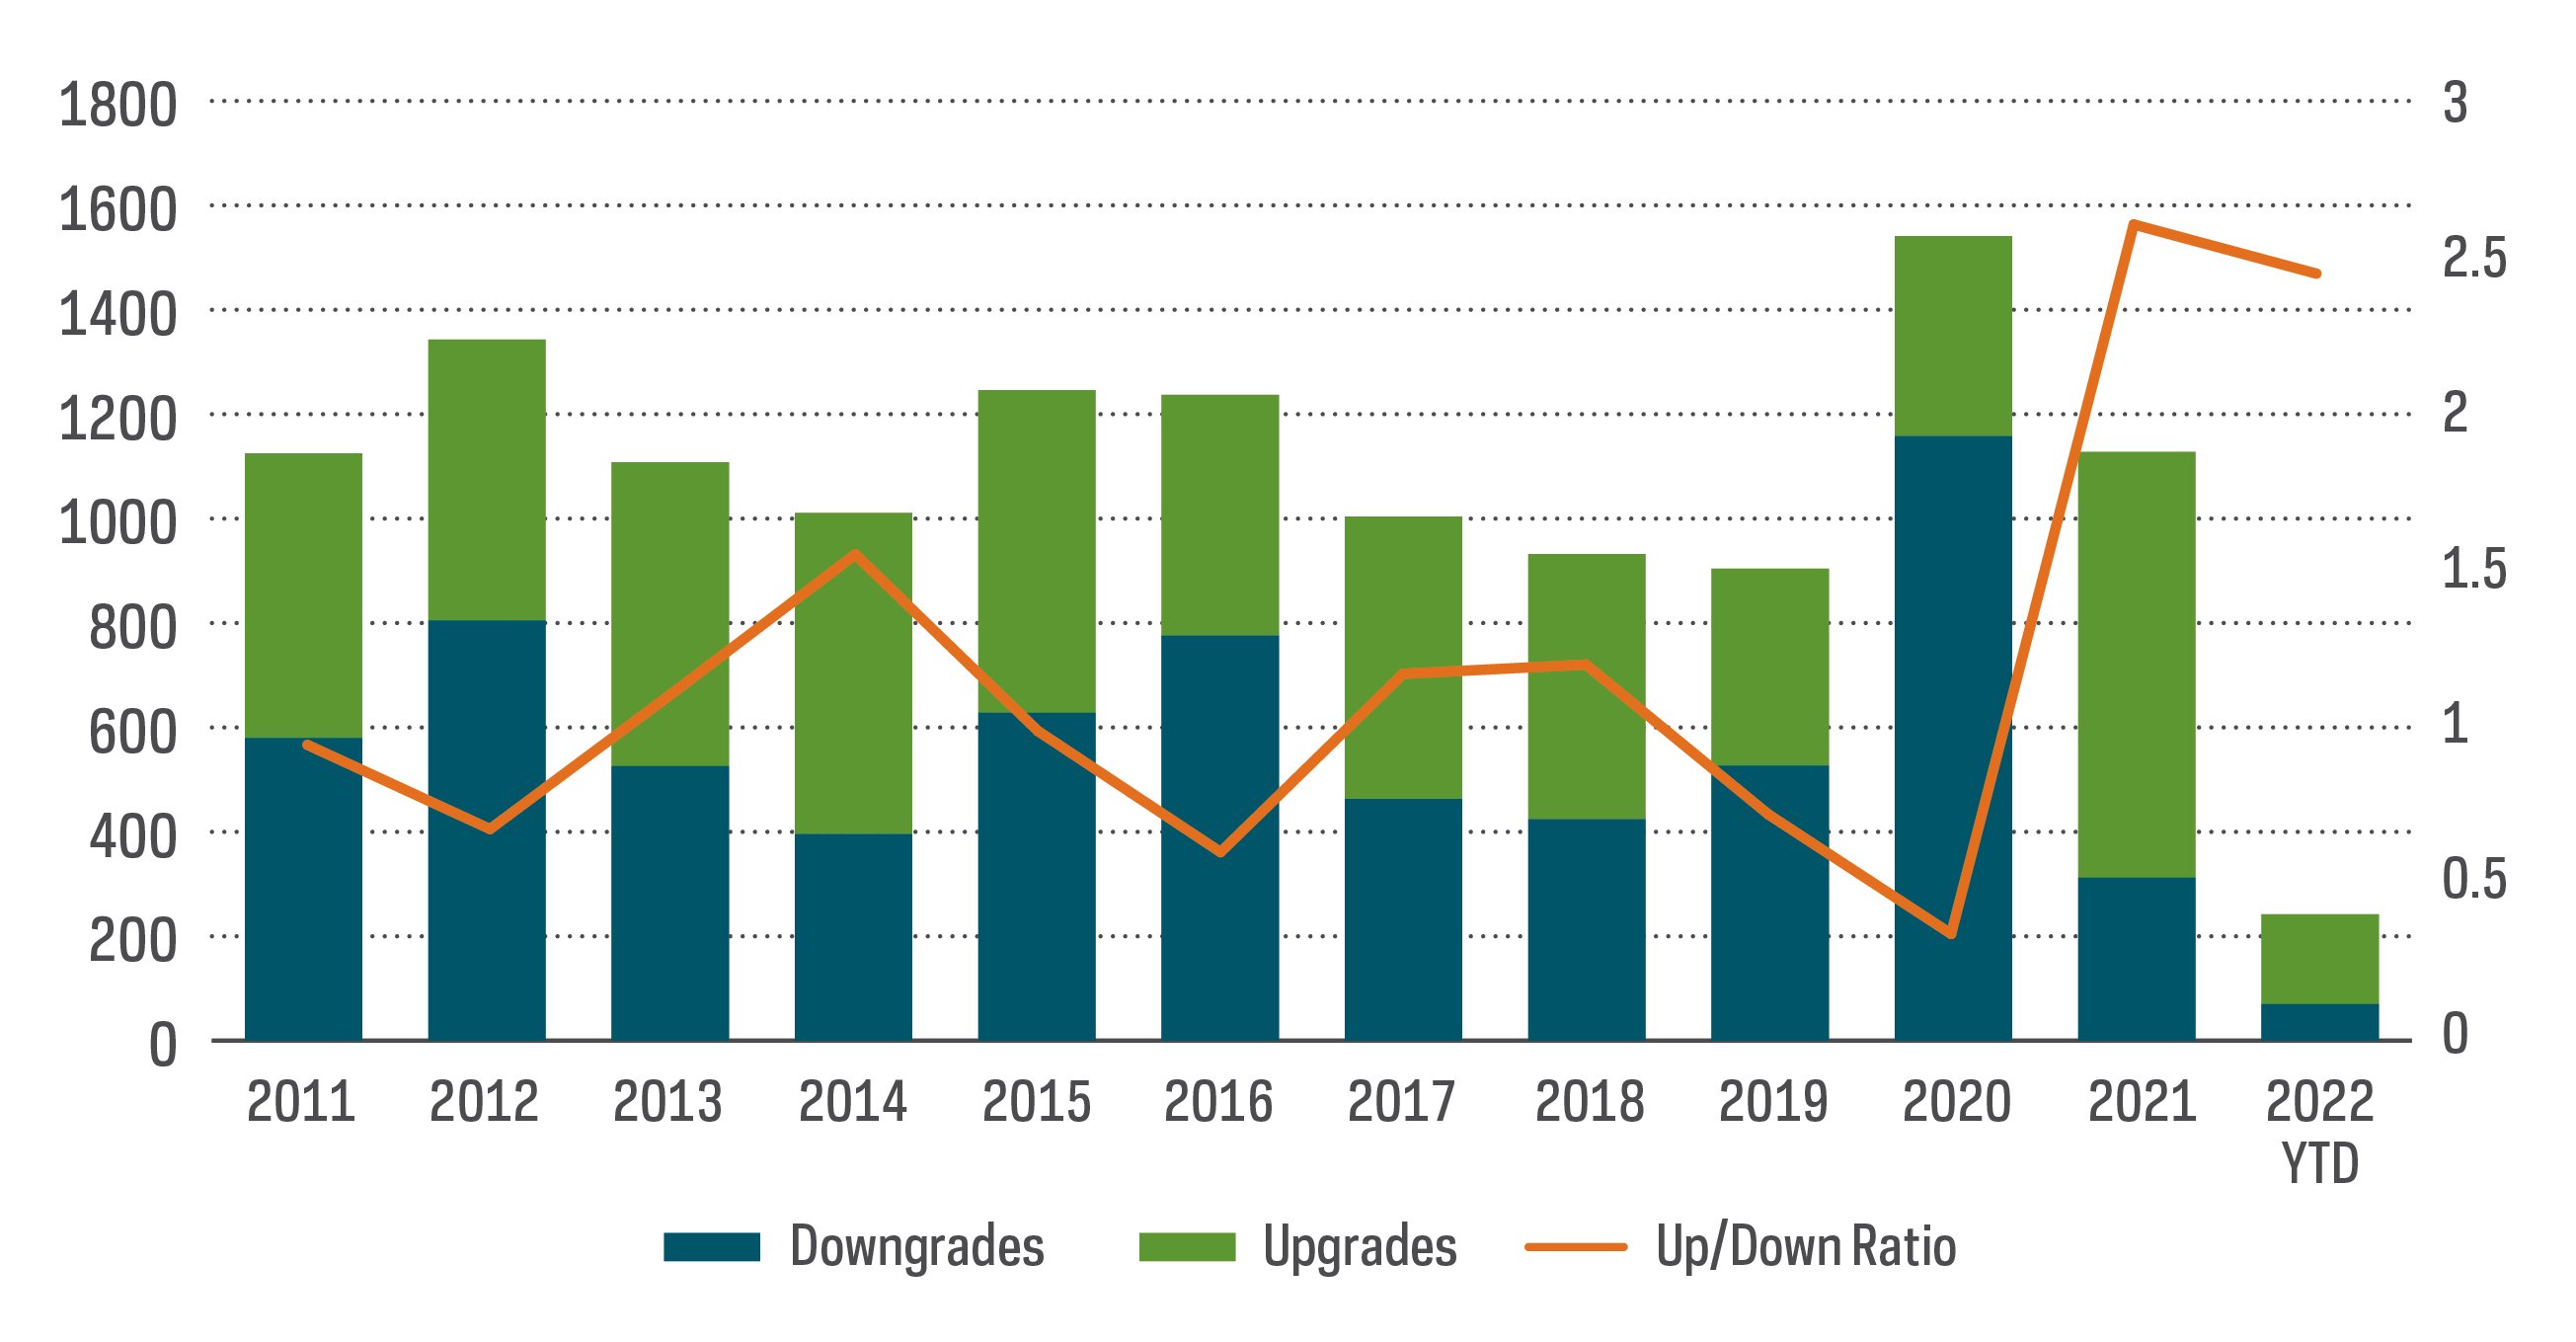
Additionally, credit rating changes over the past year have been favorable from a historical perspective, with upgrades strongly outpacing downgrades. While credit spreads tightened a bit during investors’ risk-on approach in March, they remain higher than any point in 2021, despite the economy and job market showing fairly robust gains. While uncertainty still lies ahead, credit may be the way to go for bond investors, given the outlook for interest rates.
Sources for data and statistics: Bloomberg, Morningstar, and ProShares.
The different market segments represented in the performance recap charts use the following indexes: U.S. Large Cap: S&P 500 TR; U.S. Large Cap Growth: S&P 500 Growth TR; U.S. Large Cap Value: S&P 500 Value TR; U.S. Mid Cap: S&P Mid Cap TR; U.S. Small Cap: Russell 2000 TR; International Developed Stocks: MSCI Daily TR NET EAFE; Emerging Markets Stocks: MSCI Daily TR Net Emerging Markets; Global Infrastructure: Dow Jones Brookfield Global Infrastructure Composite; Commodities: Bloomberg Commodity TR; U.S. Bonds: Bloomberg U.S. Aggregate; U.S. High Yield: Bloomberg Corporate High Yield; International Developed Bonds: Bloomberg Global Agg ex-USD; Emerging Market Bonds: DBIQ Emerging Markets USD Liquid Balanced.
THESE ENTITIES AND THEIR AFFILIATES MAKE NO WARRANTIES AND BEAR NO LIABILITY WITH RESPECT TO PROSHARES.
This is not intended to be investment advice. Indexes are unmanaged, and one cannot invest directly in an index. Past performance does not guarantee future results.
Any forward-looking statements herein are based on expectations of ProShare Advisors LLC at this time. Whether or not actual results and developments will conform to ProShare Advisors LLC’s expectations and predictions, however, is subject to a number of risks and uncertainties, including general economic, market and business conditions; changes in laws or regulations or other actions made by governmental authorities or regulatory bodies; and other world economic and political developments. ProShare Advisors LLC undertakes no duty to update or revise any forward-looking statements, whether as a result of new information, future events or otherwise.
Investing is currently subject to additional risks and uncertainties related to COVID-19, including general economic, market and business conditions; changes in laws or regulations or other actions made by governmental authorities or regulatory bodies; and world economic and political developments.
Investing involves risk, including the possible loss of principal. This information is not meant to be investment advice.
Bonds will decrease in value as interest rates rise. International investments may also involve risks from geographic concentration, differences in valuation and valuation times, unfavorable fluctuations in currency, differences in generally accepted accounting principles, and economic or political instability. In emerging markets, many risks are heightened, and lower trading volumes may occur. Small- and mid-cap companies may lack the financial and personnel resources to handle economic or industry-wide setbacks, and, as a result, such setbacks could have a greater effect on small- and mid-cap security prices.
The “S&P 500® Dividend Aristocrats® Index” and "Dow Jones Brookfield Global Infrastructure Composite Index” are products of S&P Dow Jones Indices LLC and its affiliates and have been licensed for use by ProShares. “S&P®” is a registered trademark of Standard & Poor’s Financial Services LLC (“S&P”), and “Dow Jones®” is a registered trademark of Dow Jones Trademark Holdings LLC (“Dow Jones”) and they have been licensed for use by S&P Dow Jones Indices LLC and its affiliates. ProShares based on S&P indexes are not sponsored, endorsed, sold or promoted by S&P or their affiliates, and make no representation regarding the advisability of investing in ProShares. THIS ENTITY AND ITS AFFILIATES MAKE NO WARRANTIES AND BEAR NO LIABILITY WITH RESPECT TO PROSHARES.

