Rising Rates and Inflation Left Investors with Few Places to Hide Last Month. What Are Ways Forward?
Key Observations

What a Difference a Month Makes
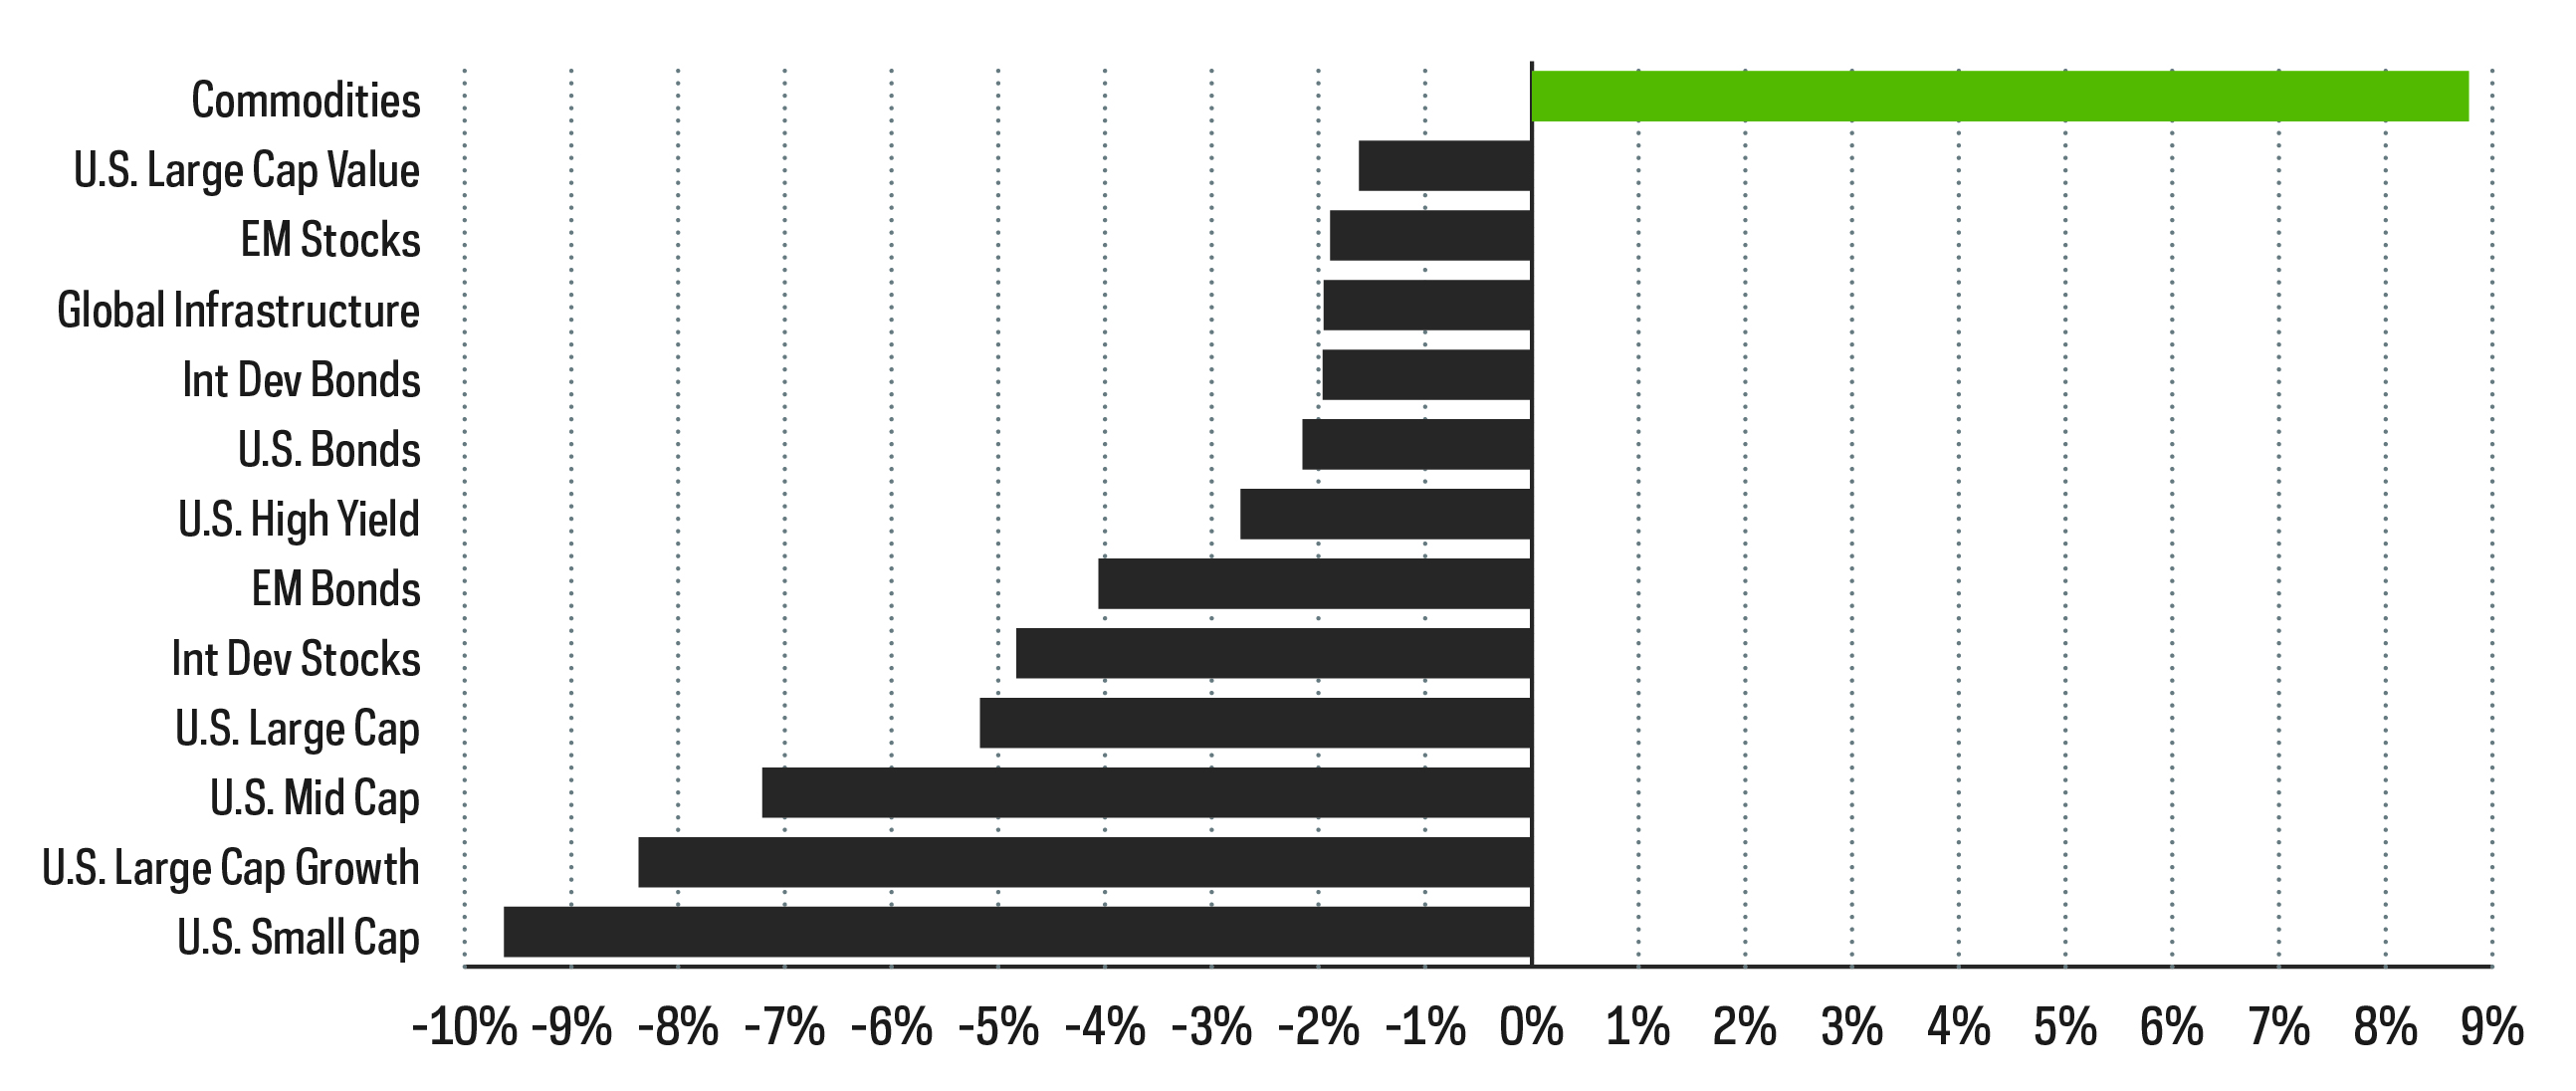
After a year in which just about every market segment made money, January saw losses nearly across the board. Many pointed the finger at interest rates, which rose substantially in January with the yield on the U.S. 10-year Treasury rising nearly 30 basis points (bps). When interest rates rise, losses in the bond market are a function of simple math. Just multiply the rise in rates by a bond's duration and you've got a close approximation for that bond's loss in market value. However, recently, many have been extending that notion of duration to the equity market—and that may be a bit of an overreach.
Duration is the measure of a bond’s price sensitivity to a change in interest rates.
Can Duration Apply to Equities?
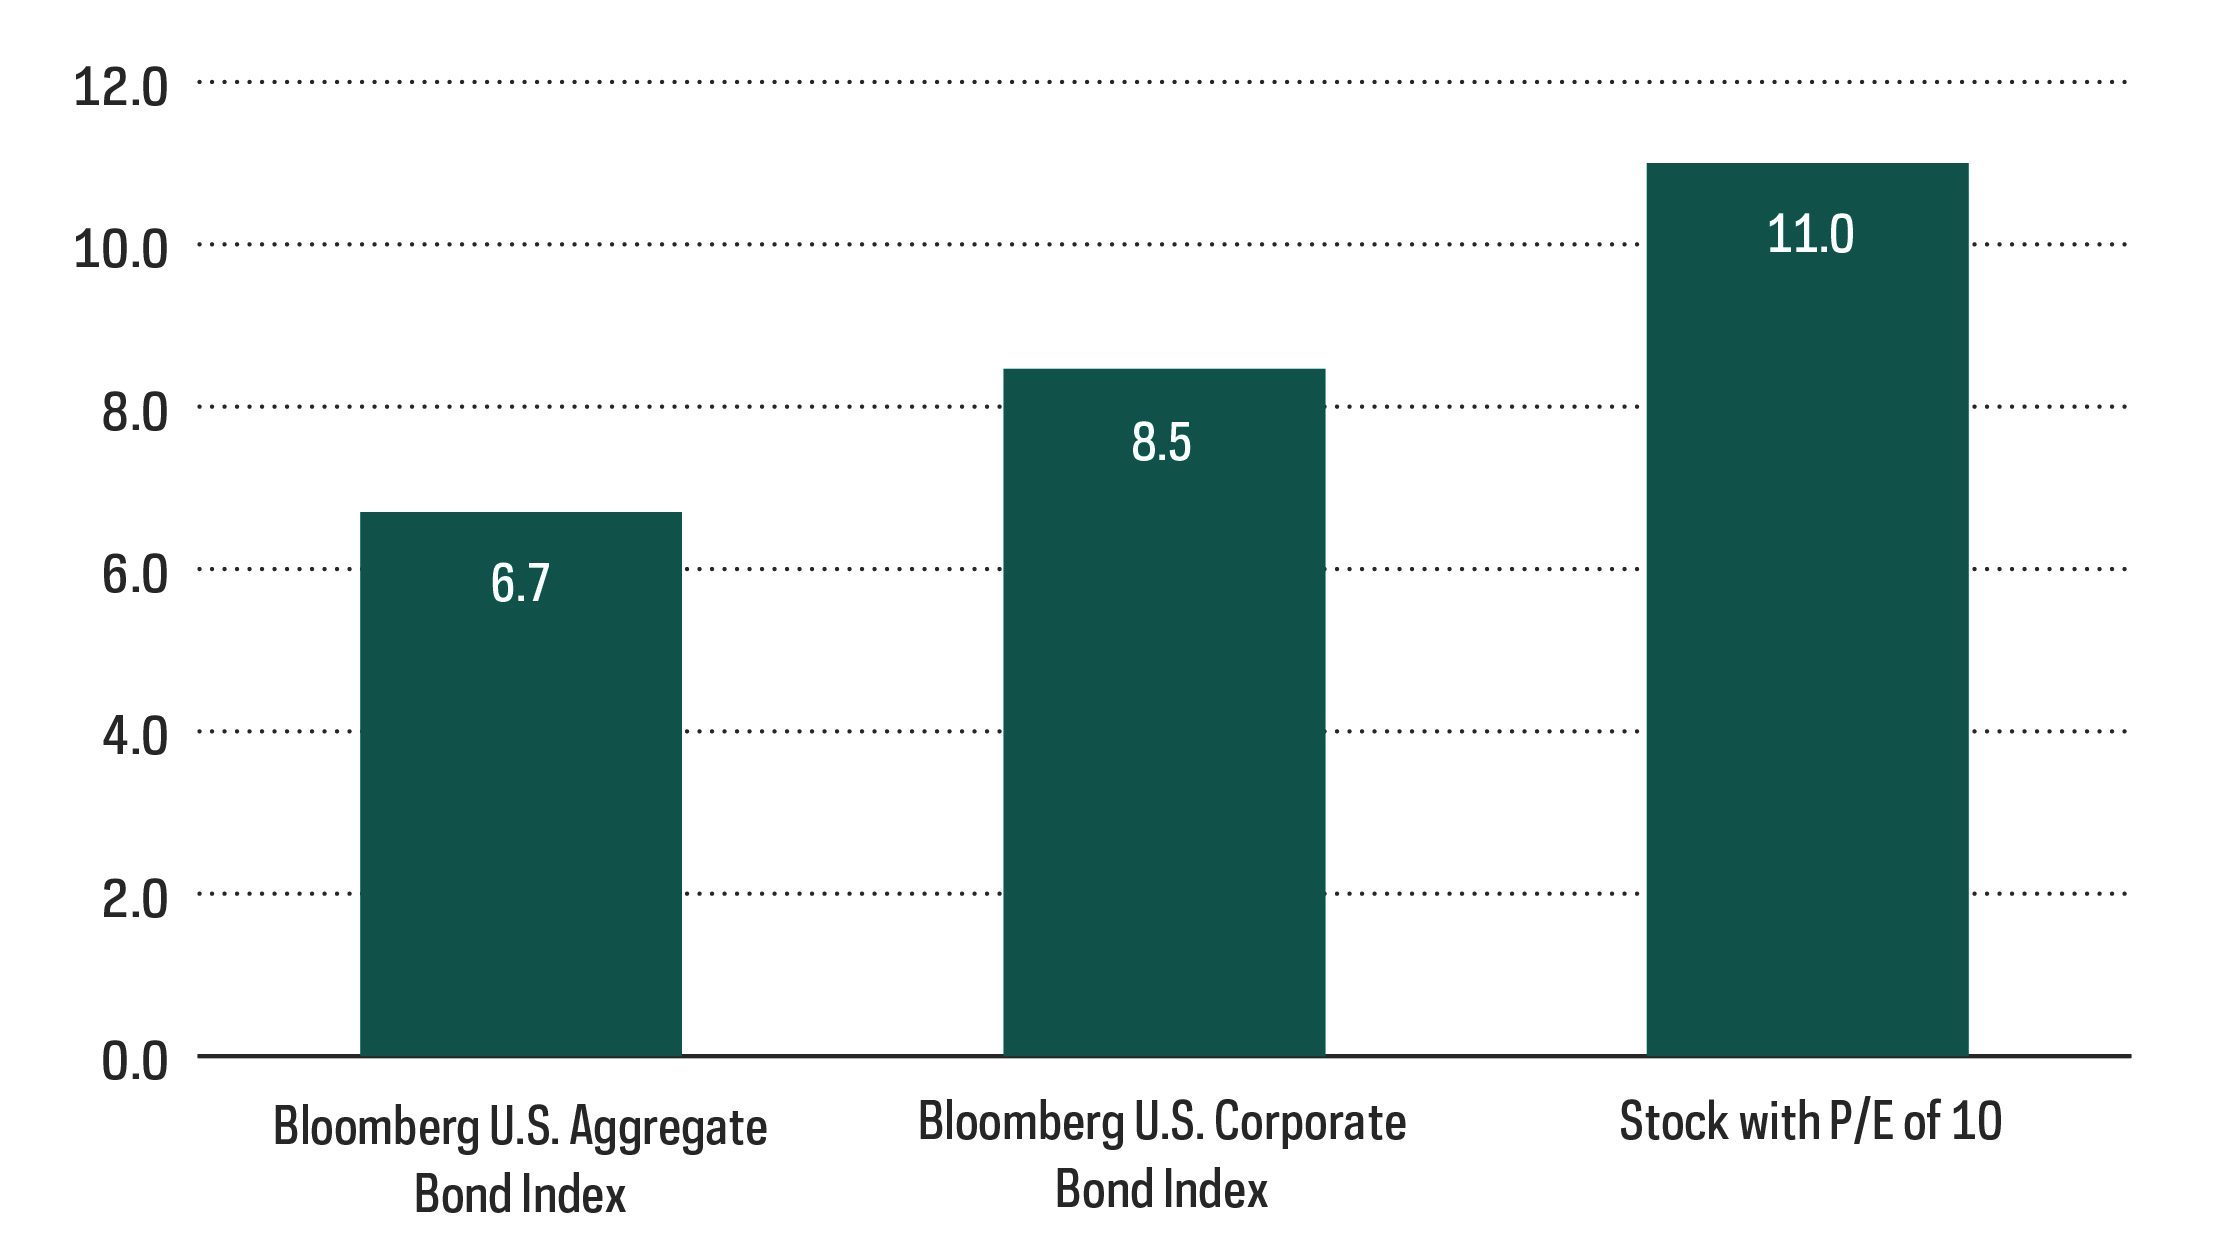
The logic seems compelling. If interest rates are rising, a standard bond market defense is to move to shorter-duration bonds—bonds that have shorter maturities and return their cash to holders sooner. Why not do the same with equities? Simply move one’s equity exposure from companies with high growth expectations—where the returns are further out in time—to companies with lower growth prospects that are delivering more of their earnings sooner. Here’s the problem: Even the cheapest equities with the lowest growth expectations still have quite long durations. A stock with a P/E of 10—half the price of the S&P 500—still has a duration of nearly double the Barclays Aggregate bond index.
P/E is price of a stock divided by it’s earnings.
Duration Comparison
The salvation for equities—in any environment, but particularly in a rising rate environment—is the ability to grow earnings and dividends, as opposed to the fixed coupons of bonds. “But wait,” you say. “I was just looking at the S&P Pure Value Index (the most value of the value stocks) and it’s trading at under 11X 2022 earnings, and it did quite well in January going up 2 percent.” A look at its composition tells an important story: Financial sector stocks account for nearly one-third of the index. Rising rates are often a positive for financials as they can drive fatter net interest margins. That sounds more like a growth story than a low-duration equity story.
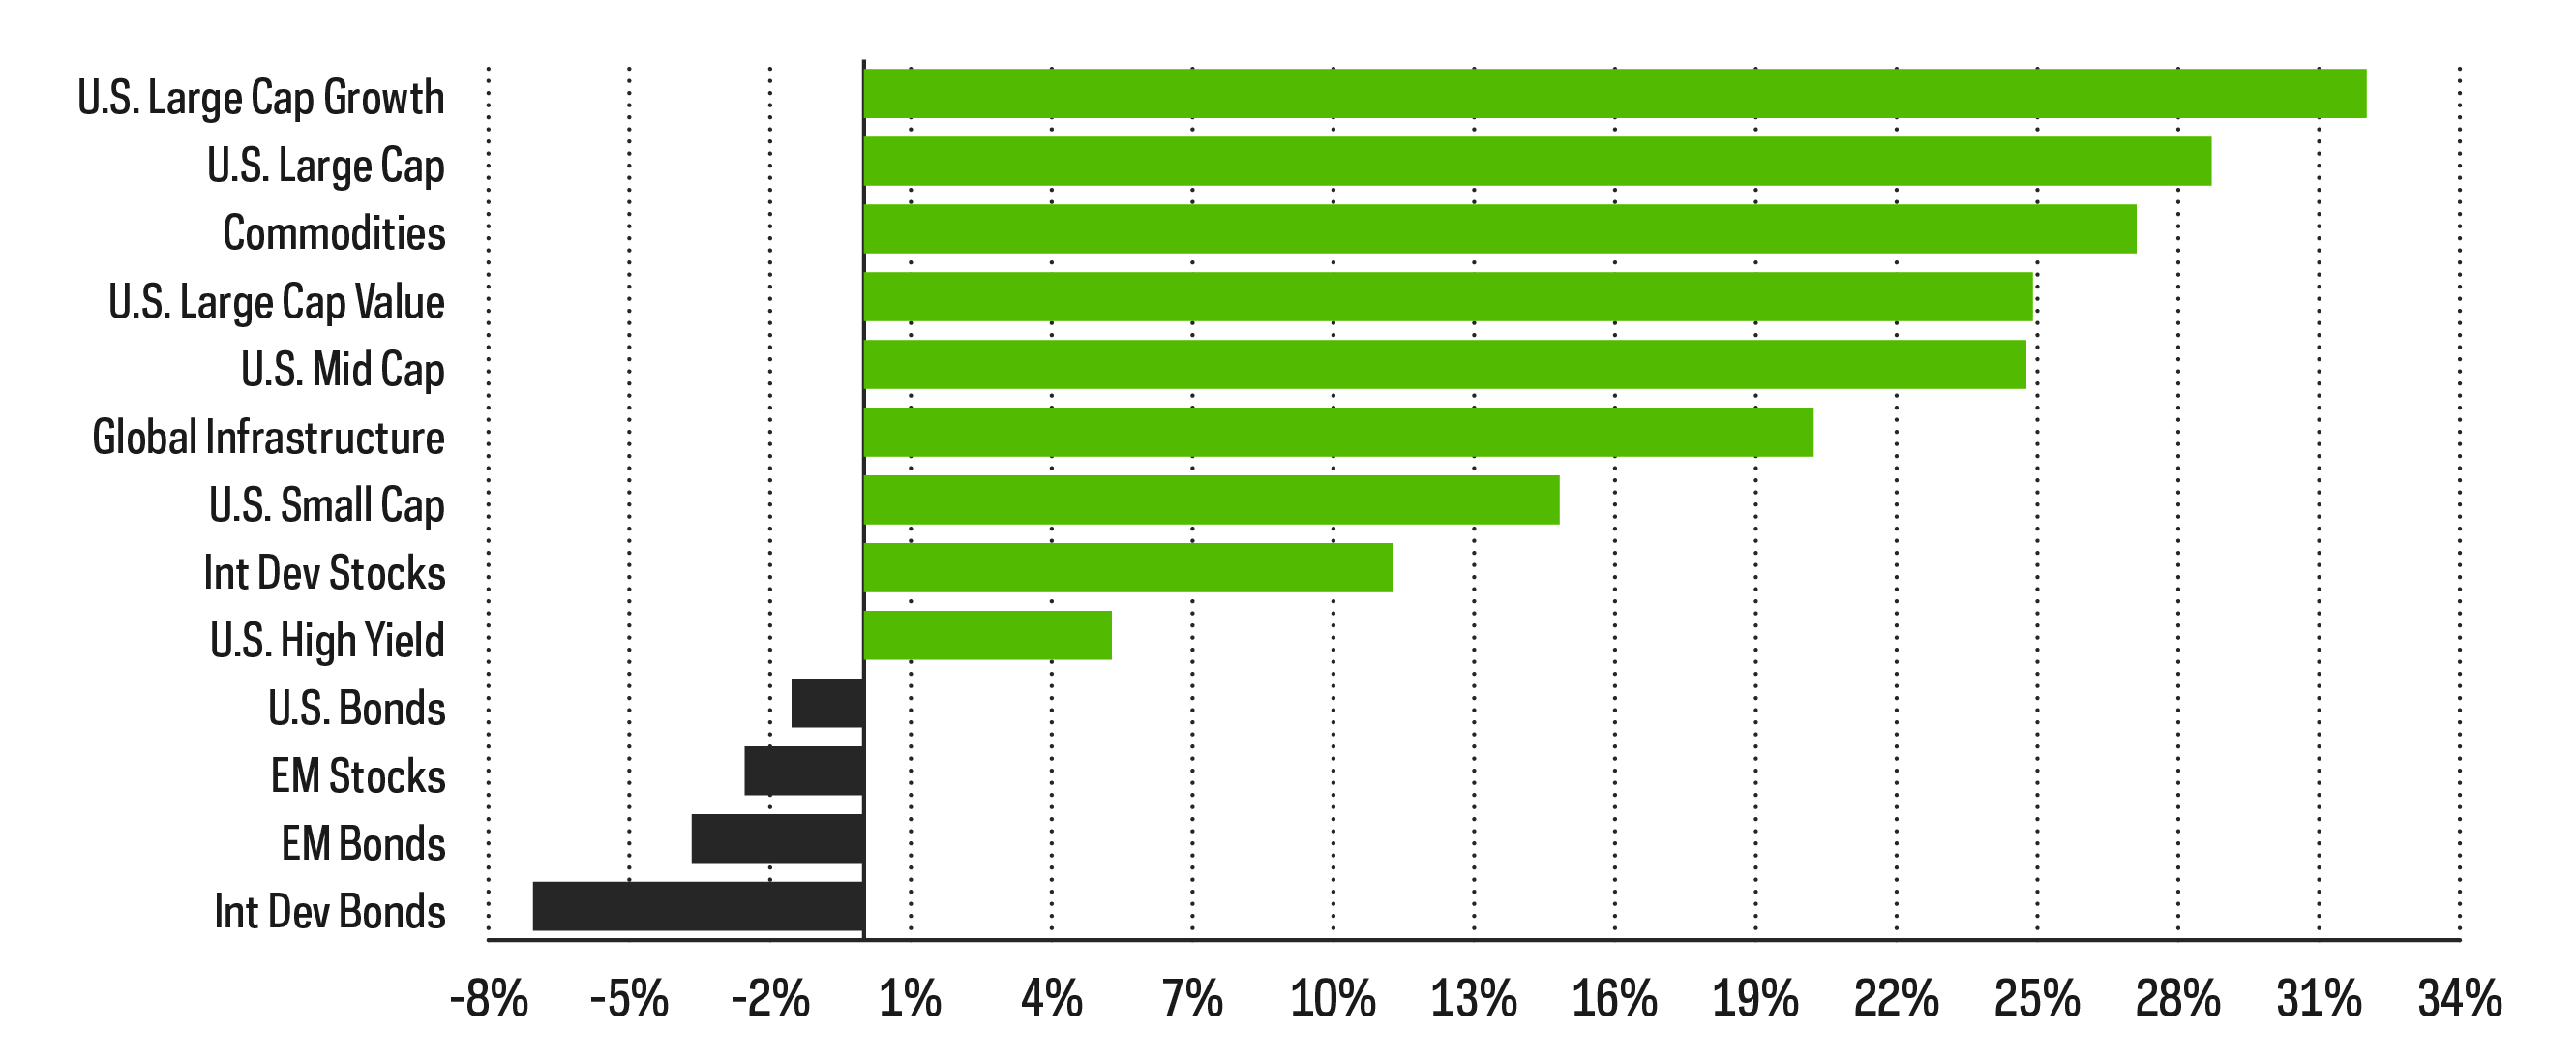
Performance Recap
EQUITY PERSPECTIVES

Dividend Growth for a Rising Rate Environment
The generally poor equity performance thus far in 2022 has many pointing the blame on rising interest rates. Indeed, widespread expectations are for the Fed to begin a series of increases to the Fed Funds rate as early as March. The 10-year Treasury has backed up nearly 30 basis points in January to end the month at near 1.8%. For equity income investors, that must mean time to play a bit of defense and focus on high dividend paying stocks, right? High-yield strategies tend to lean to the value side of the style box, and value stocks have generally held up better than growth stocks during the current bout of volatility. Their higher income levels are also attractive relative to other options.
As usual, history often can provide much-needed context. We offer two points to consider. First, perhaps the most obvious is that rising rates alone don’t have to signal weak returns for equities. Despite negative returns in January, equities can and have performed well in prior periods of rising rates. Over the past two decades, the S&P 500 has performed strongly during several sustained periods when rates increased.
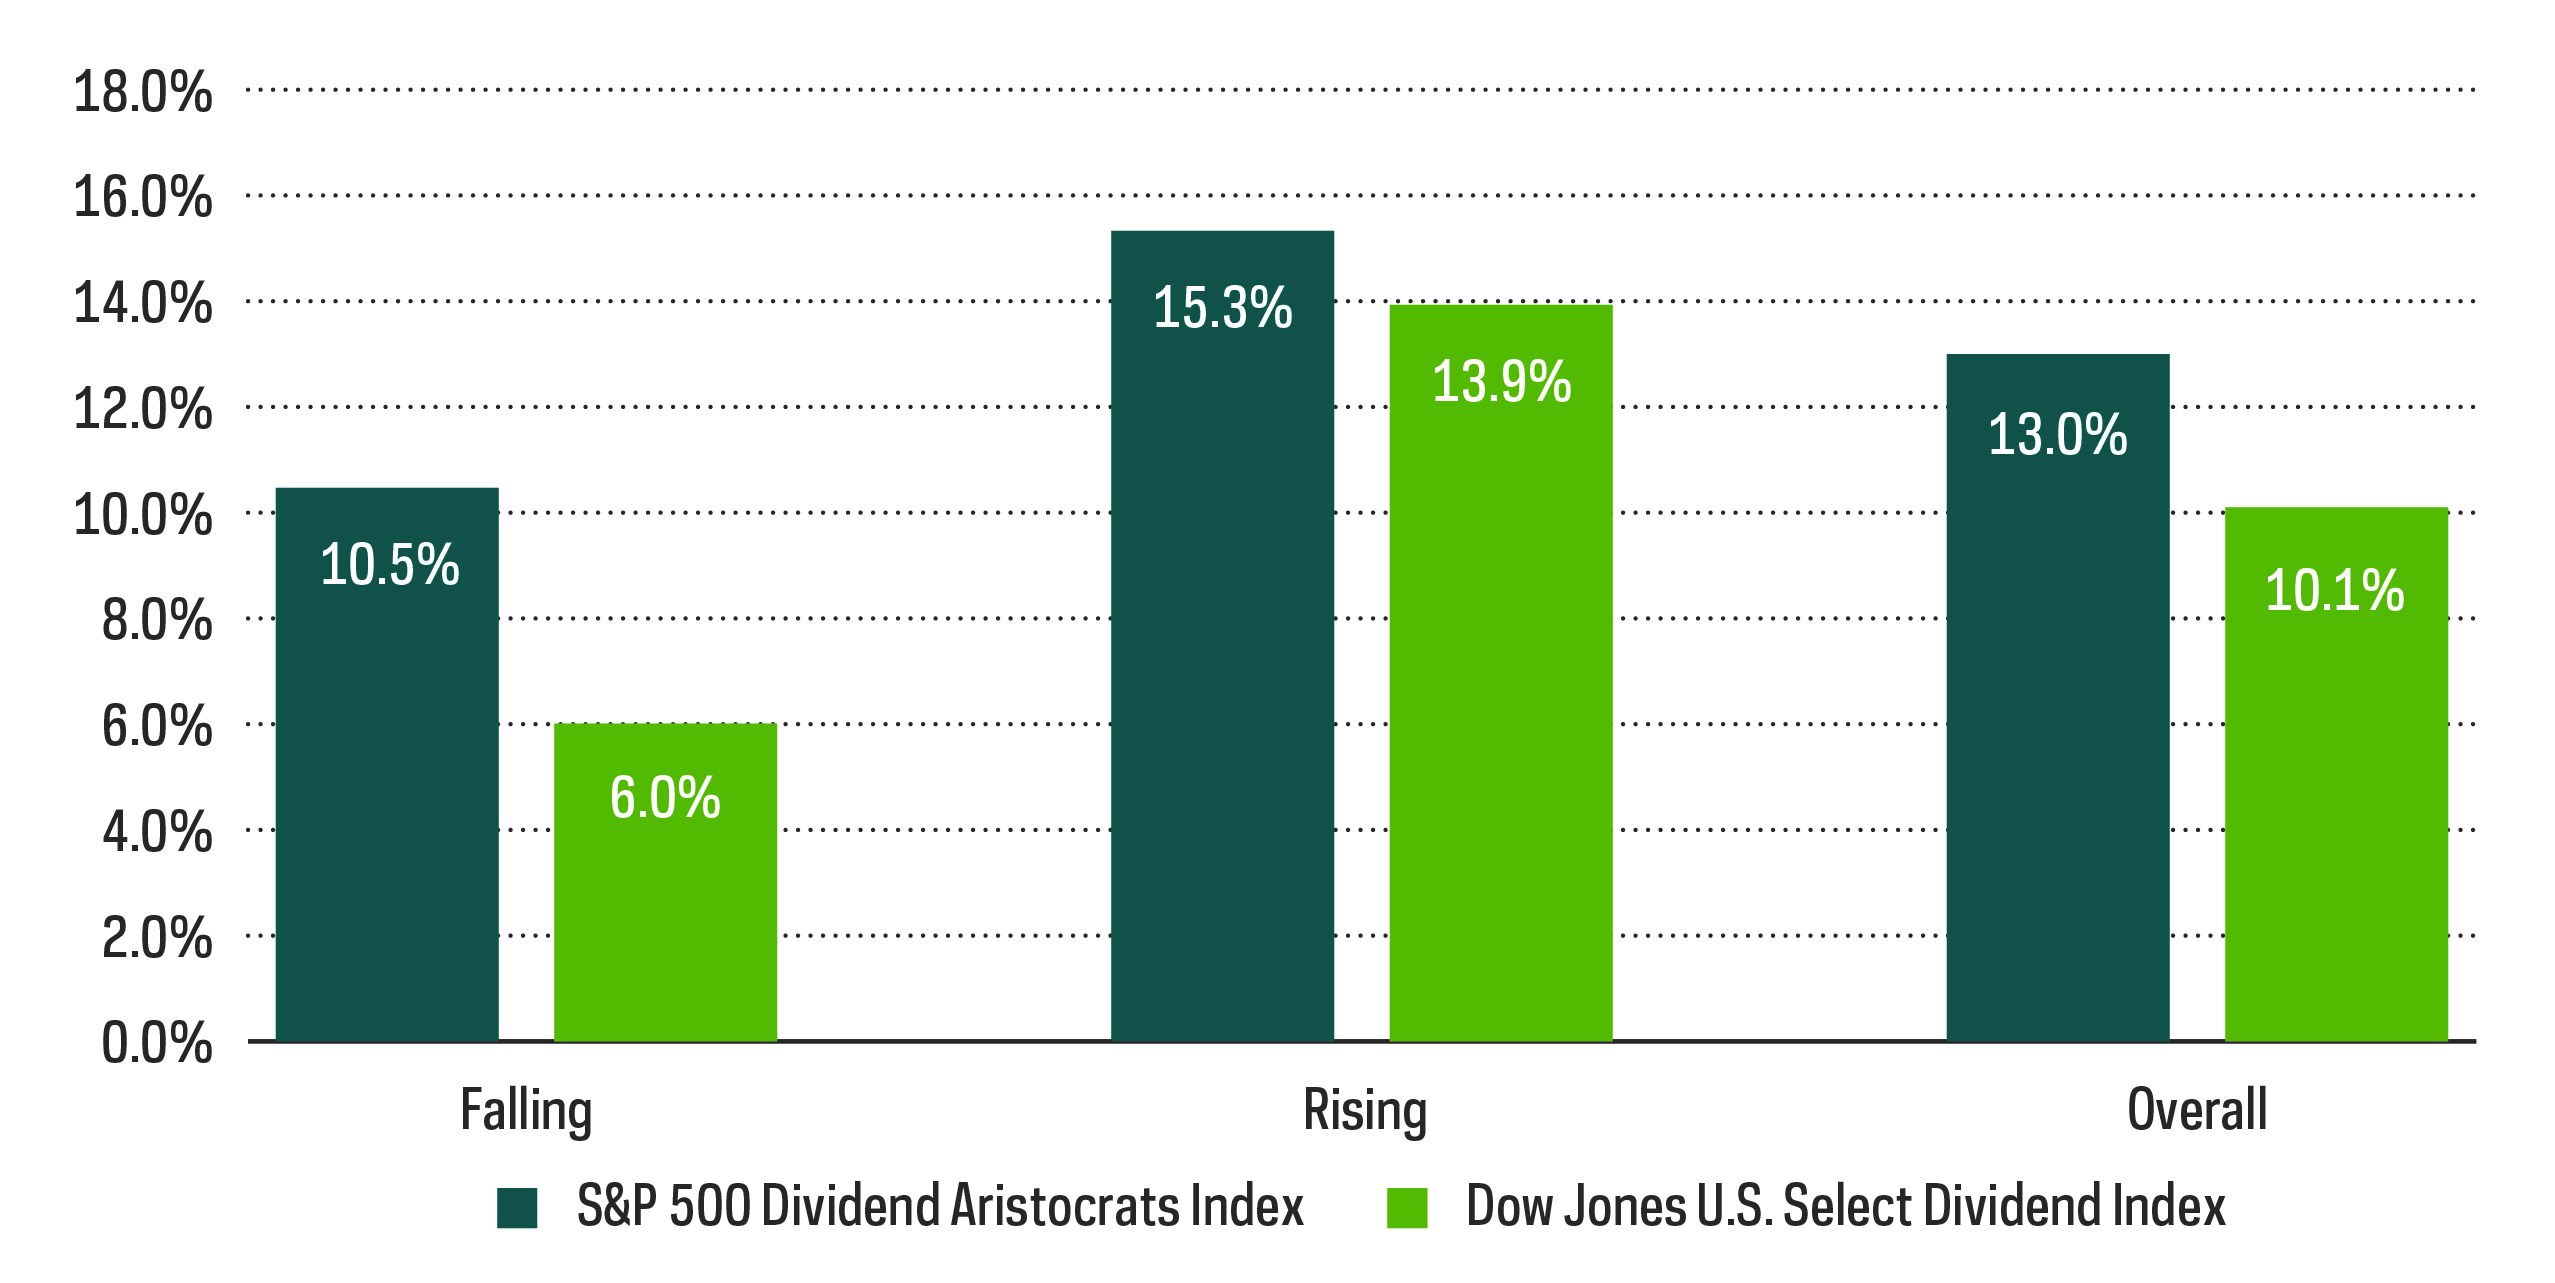
Secondly, differentiate your dividend strategy. Dividend growth as a strategy, as represented by the S&P 500® Dividend Aristocrats® Index, has outperformed high dividend yielders during both falling and rising interest rate periods as defined by the DJ US Select Dividend Index. The Aristocrats have also provided attractive dividend growth rates for years—an especially attractive feature as inflation continues to run at the highest rates we’ve seen in decades.
Average Performance During Rising / Falling Interest Rate Periods
An Equity Strategy Designed Specifically for Rising Rates
In volatile markets like we’ve seen in January, when many equity strategies are showing losses amid the backup in rates, it can be easy to think only of playing defense. Identifying strategies that will protect better on the downside is certainly a critical portfolio management element, but perhaps not complete. However, strategies that are designed to outperform during rising rates periods can be an effective and complementary way to play offense.
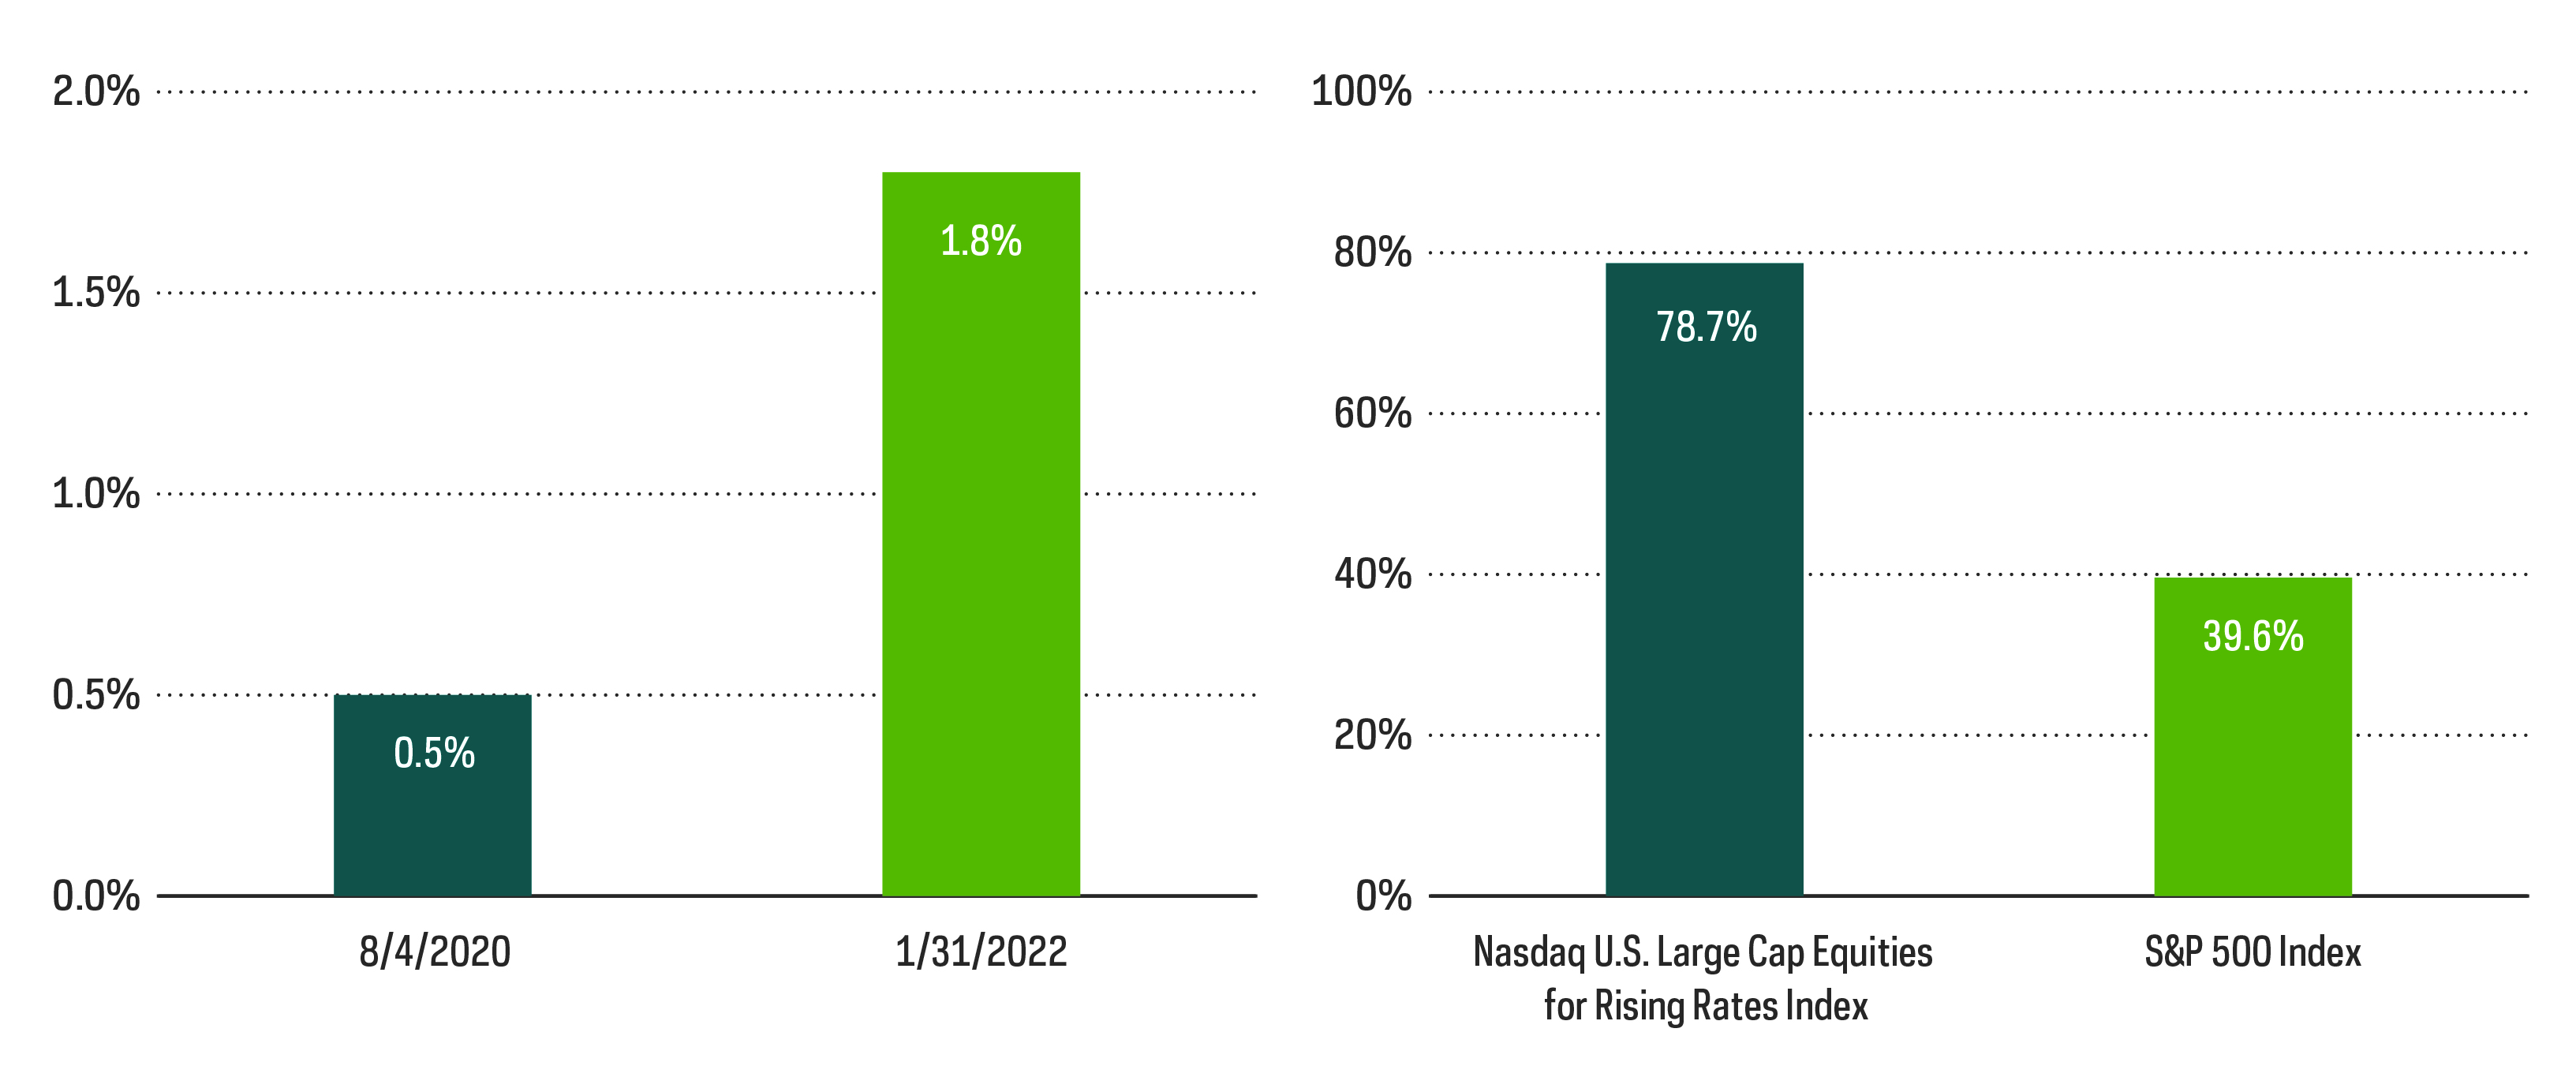
One such strategy is the Nasdaq U.S. Large Cap Equities for Rising Rates index. Certain sectors like financials and cyclical industrials and energy—and by extension certain stocks—tend to perform well when rates rise. But that dynamic is not static. Each rising rate cycle can have different macro drivers that can impact the markets in nuanced ways. Capitalizing on this, the rules-based index selects only five sectors and 50 stocks within those sectors to display the strongest recent correlation to 10-year Treasury yields. Those sectors with stronger correlation receive higher weights.
So far, the strategy has performed as expected. Not only were the index returns positive during January, but the strategy has delivered approximately double the returns of the S&P 500 since rates bottomed in early August of 2020.
FIXED INCOME PERSPECTIVES

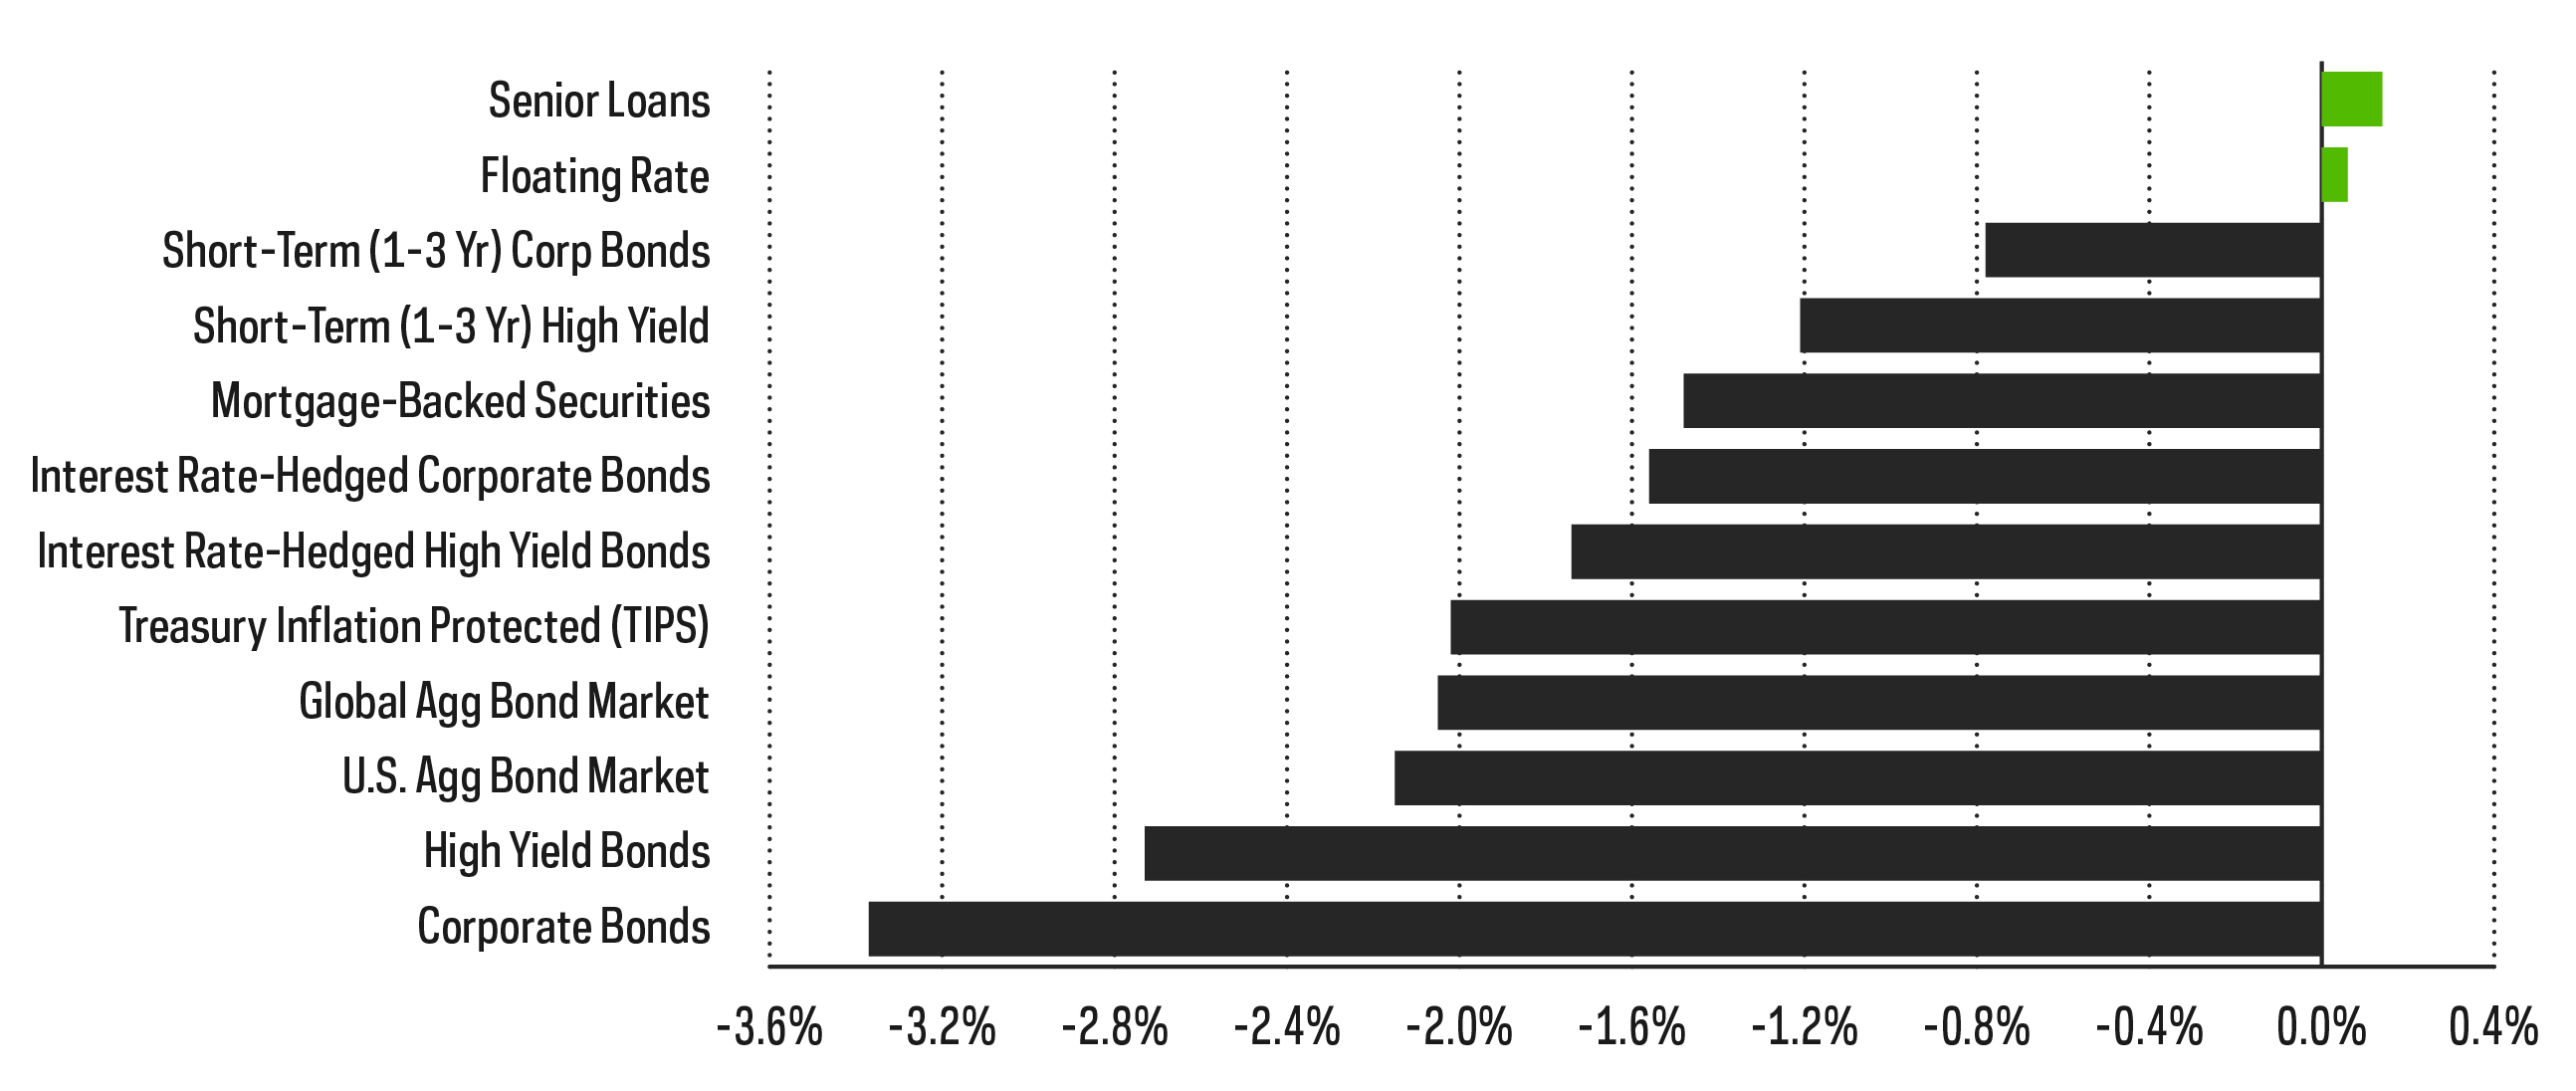
Few Safe Havens Here
Bond investors braced for impact in January, anticipating that the Federal Reserve would soon pump the brakes on pandemic-era easy monetary policy. While many called for a rise in interest rates this year, the speed at which rates rose in January may have come as a surprise. Investors began to question just how soon and how quickly the Fed may raise the Fed Funds rate and unwind its balance sheet.
The U.S. aggregate bond market fell more than 2%, now down more than it was for the full 2021 calendar year (in which it returned -1.5%). There weren’t many places for bond or equity investors to hide last month, with only Senior Loan and Floating Rate bond indices ending in the green.
YTD Fixed Income Segment Returns
Interest Rates May Rise Even If Inflation Proves to Be Transitory
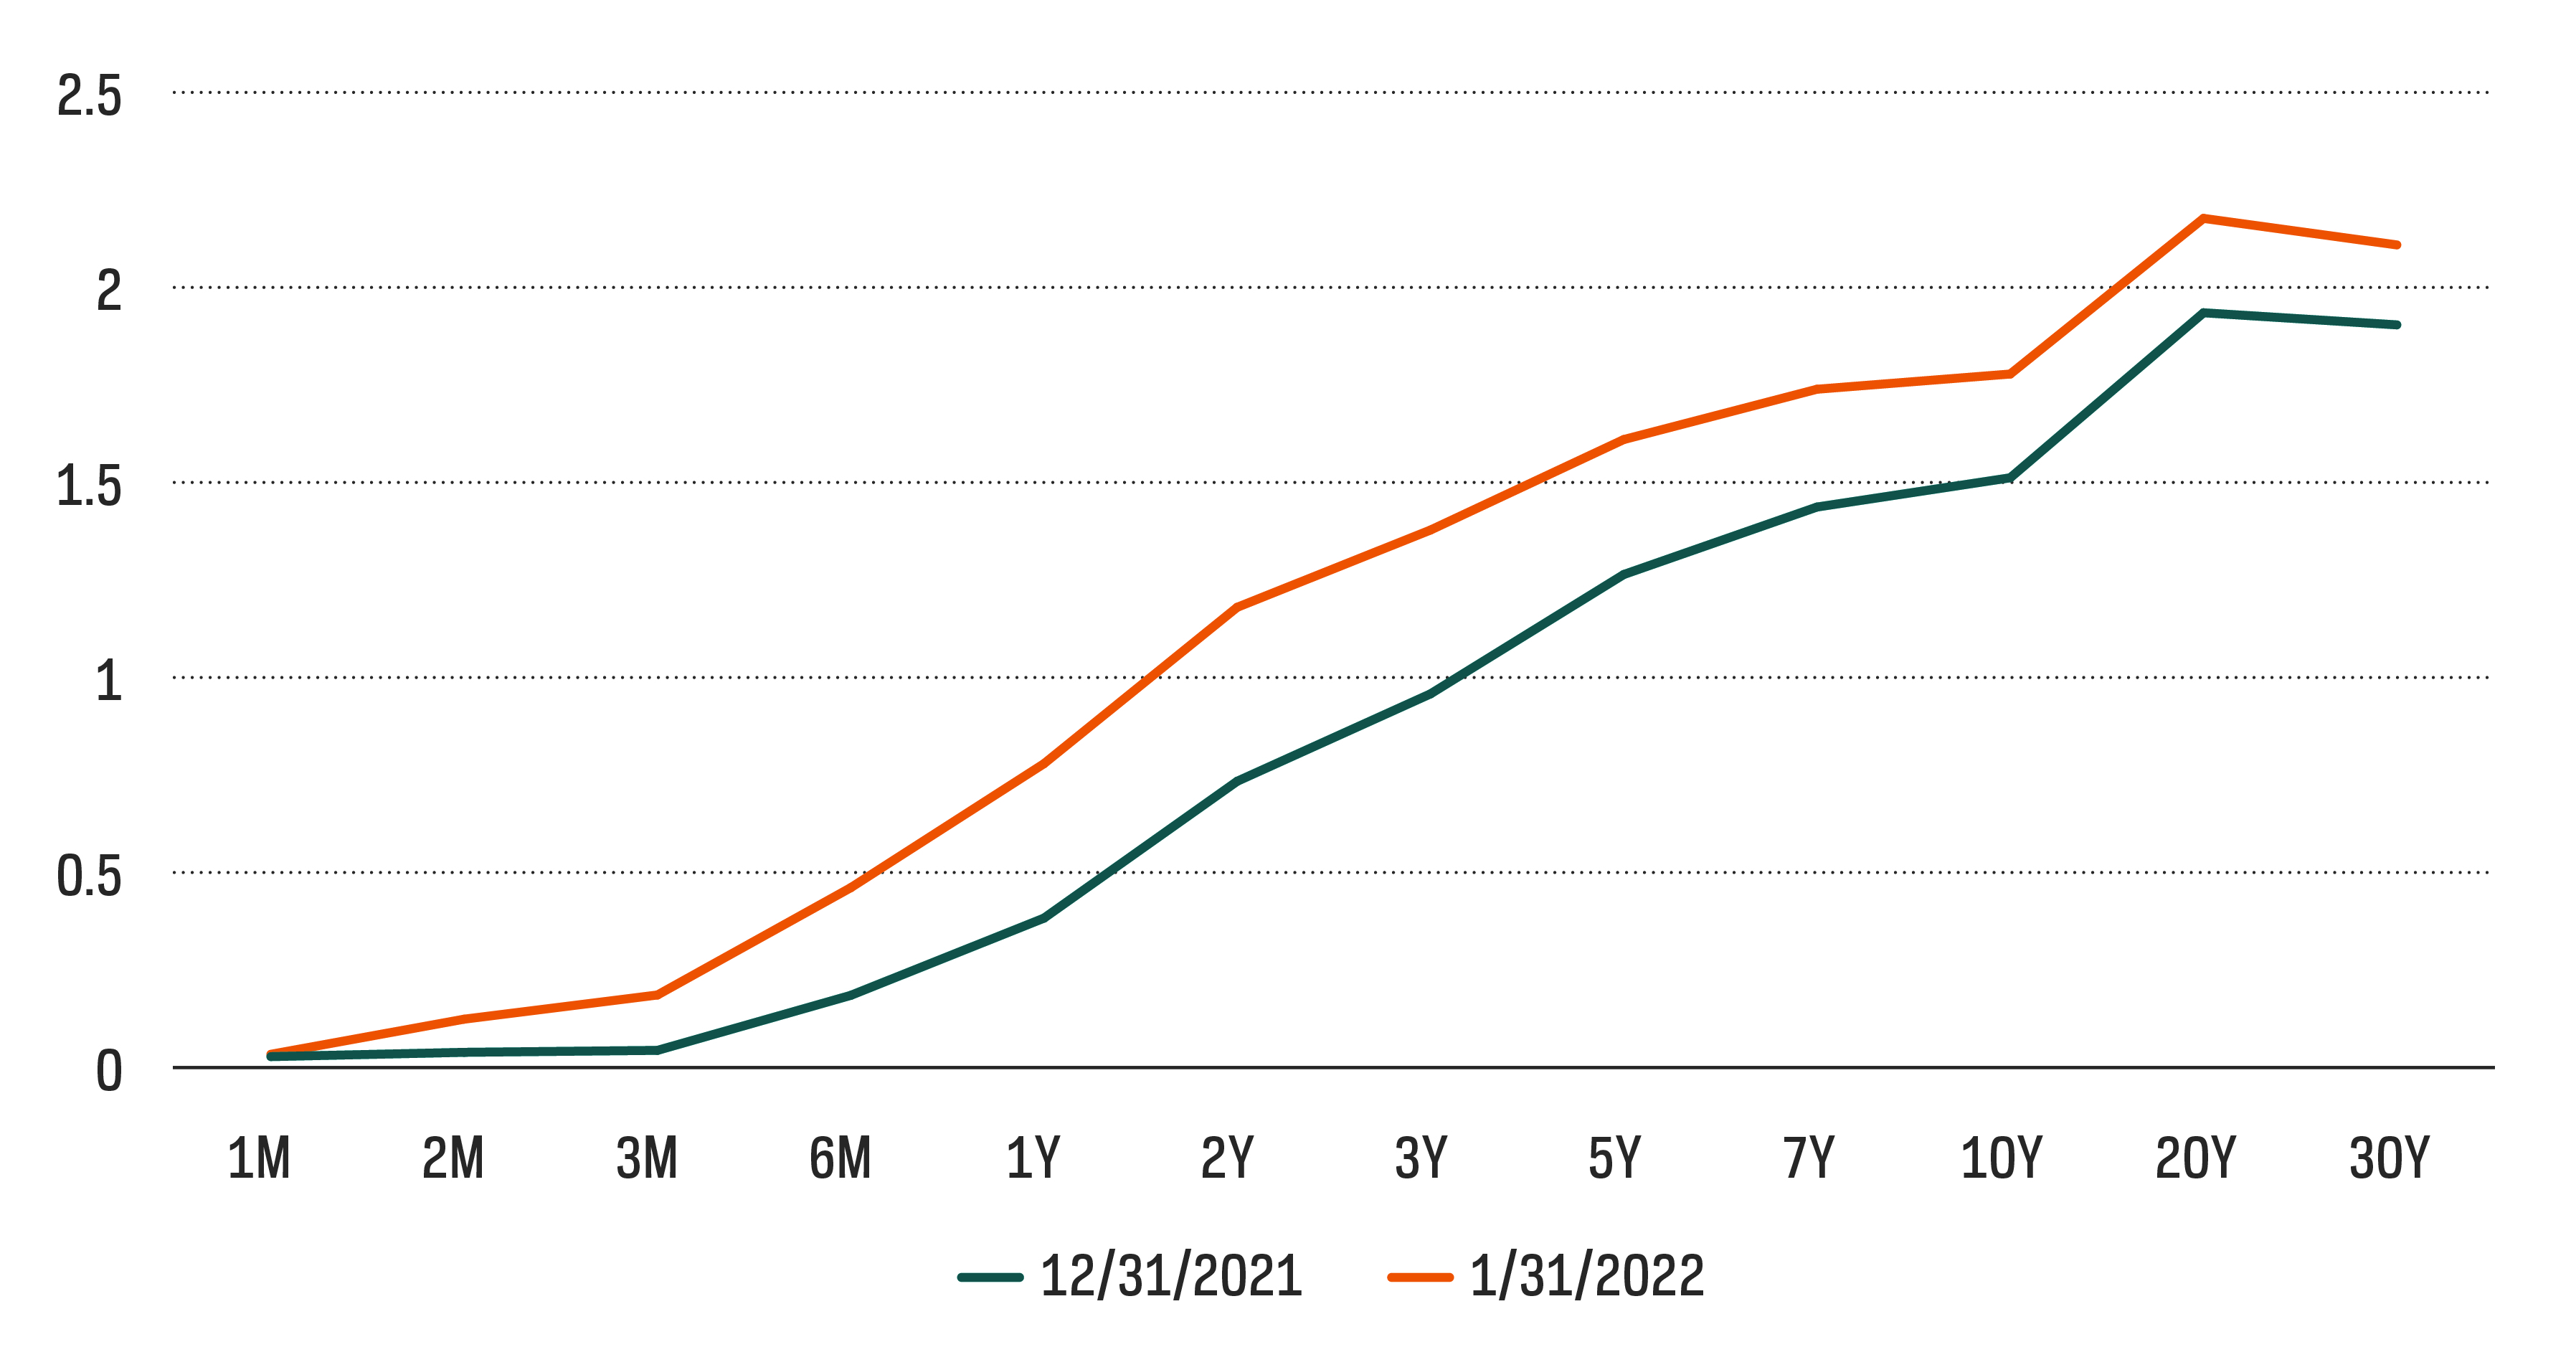
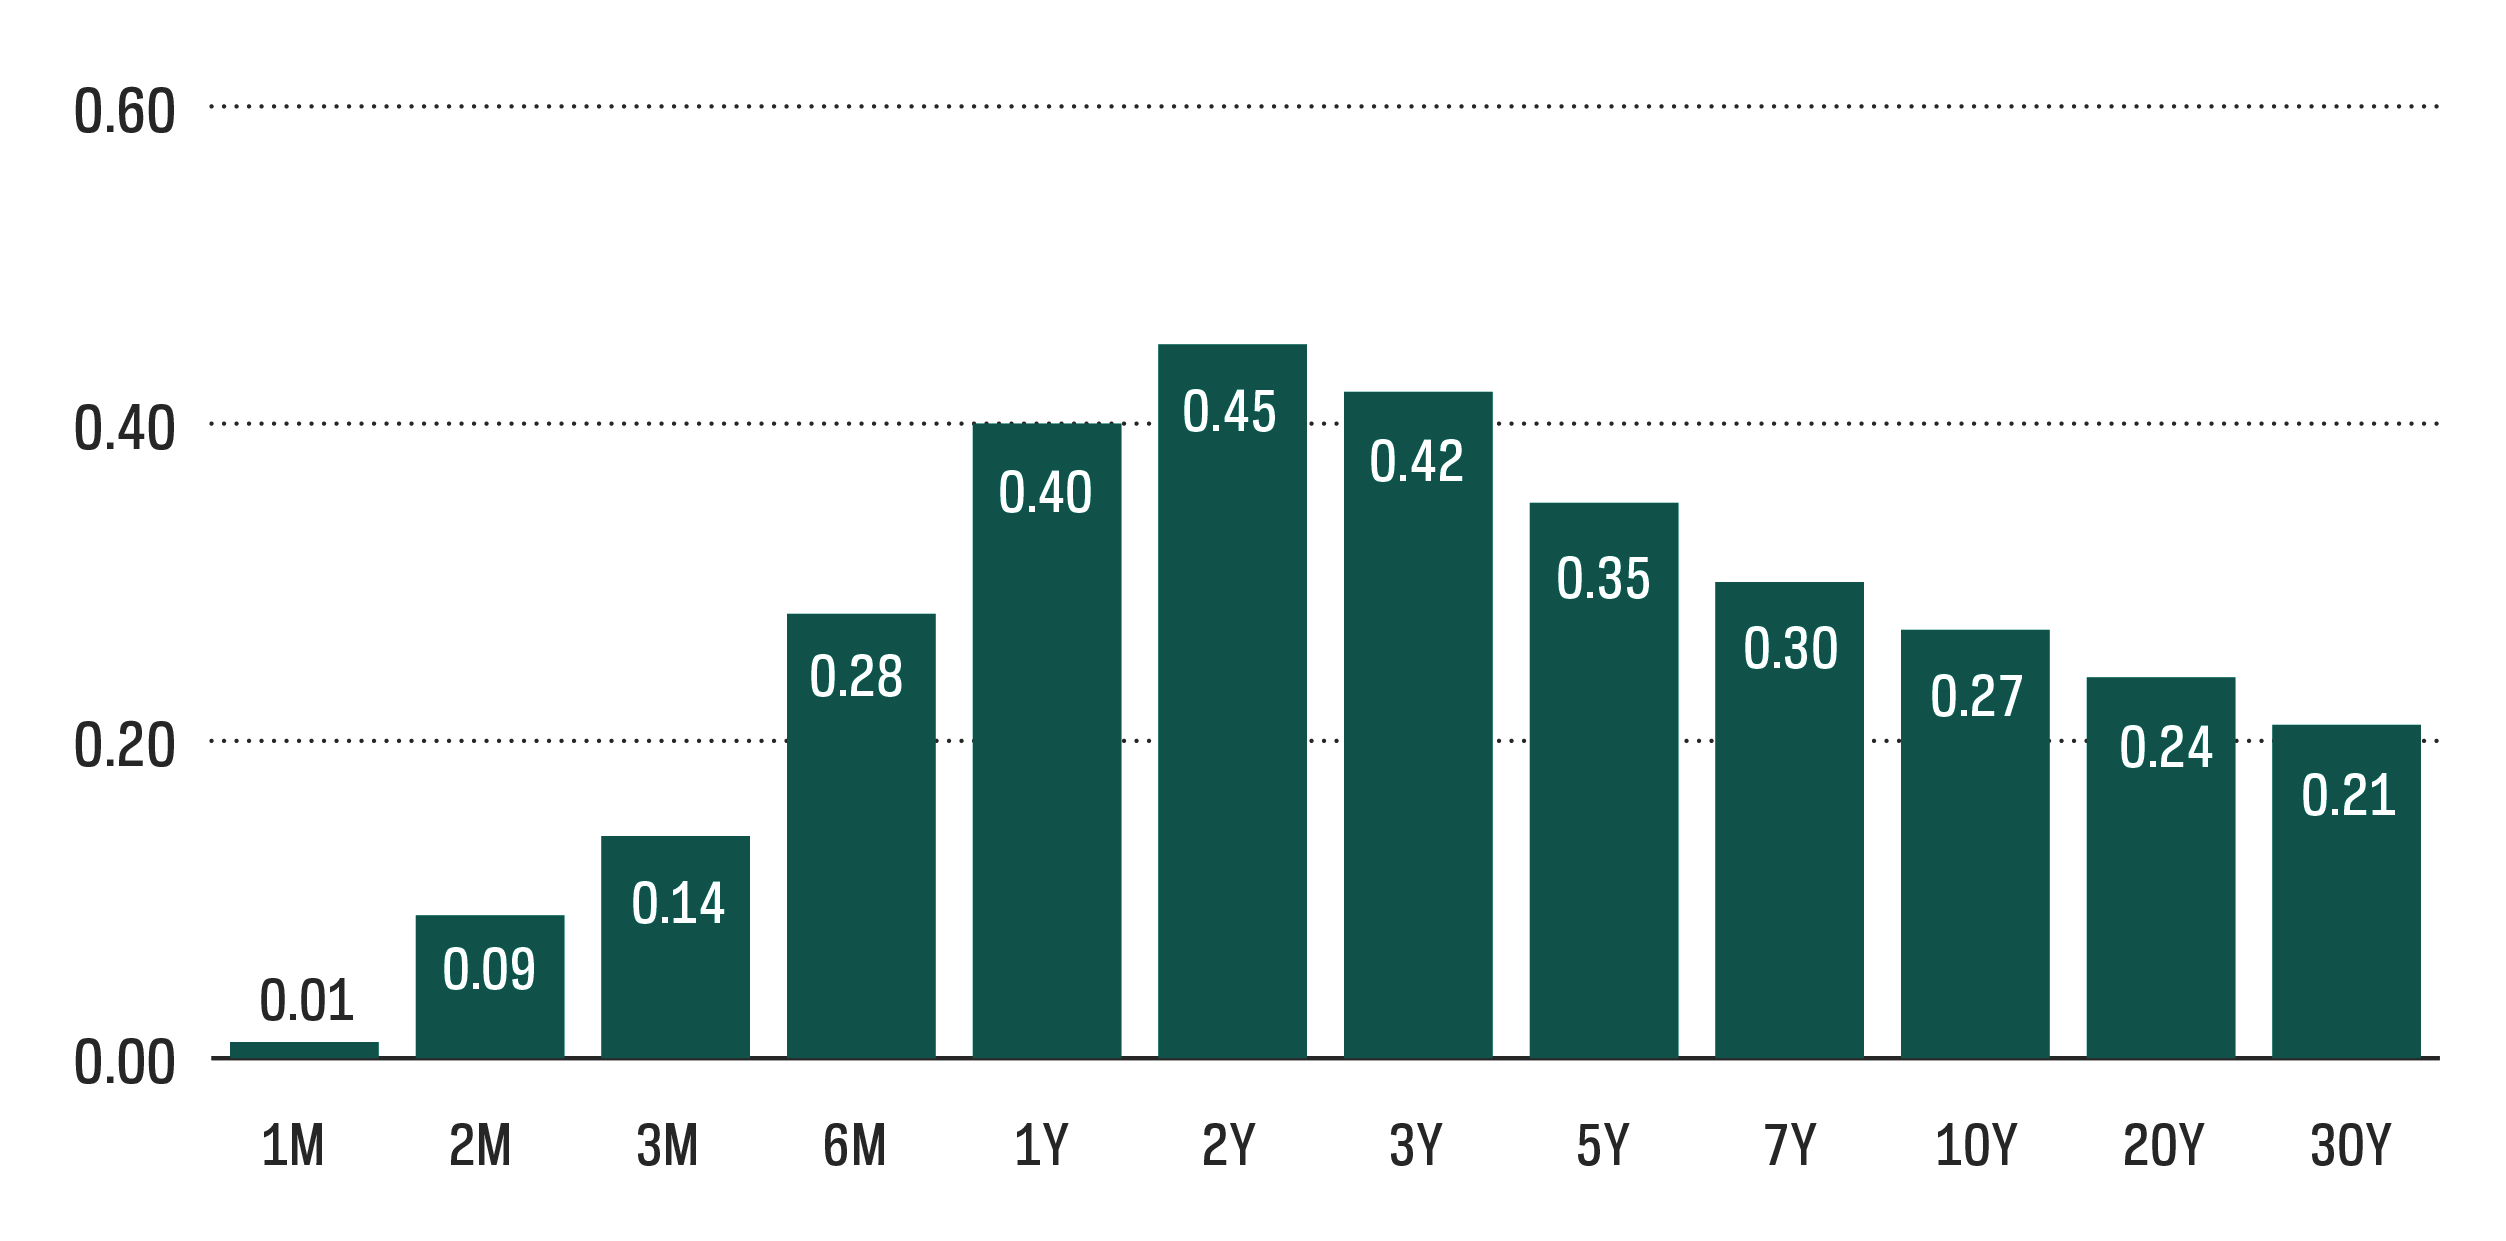
The Fed is clearly concerned with the rise in inflation we’ve seen over the past year and is preparing ways to temper it, with Fed Chair Powell indicating that policymakers will have to take a “humble” but “nimble” approach. Investors appeared to have faith in the Fed’s abilities as inflation expectations fell during the month. Real interest rates thus rose further than nominal rates, with the real 10-year yield rising nearly 40 bps in January.
Real Rates on the Rise Early on in 2022 (YTD Change)
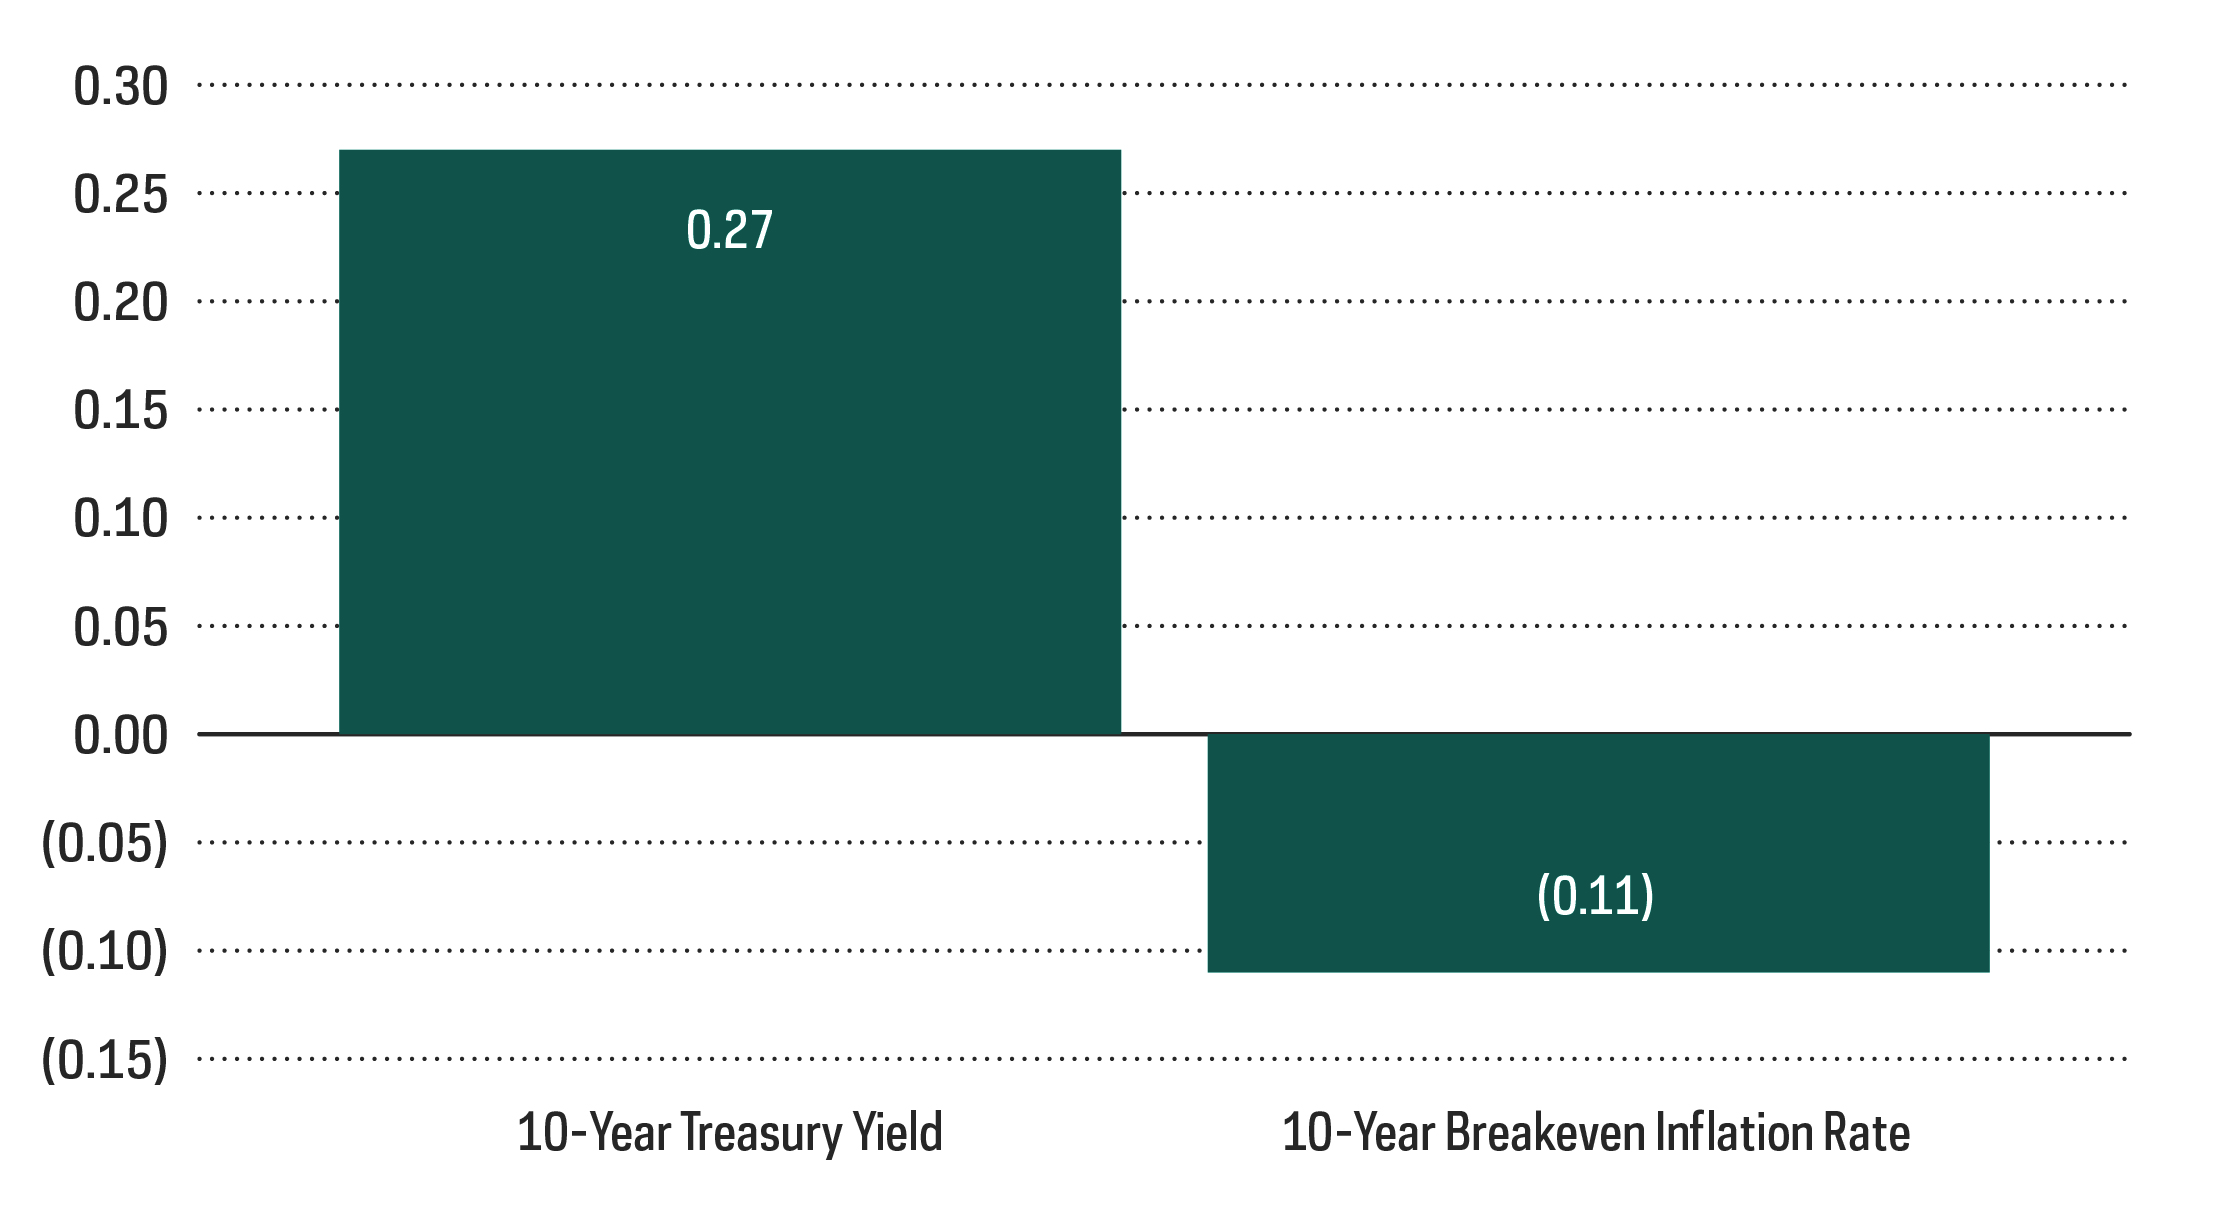
Despite the recent uptick in real yields, they remain negative across the curve with the real 10-year Treasury yield standing at -0.65% as of January 31. This important metric has remained in negative territory since February of 2020 at the onset of the pandemic but has historically been positive, with an average yield of 0.85% over the past 20 years.
Credit spreads also widened during the month which were an additional detractor to the performance of corporate bonds as investors took a risk-off approach. Moving forward, however, the path of interest rates appears more unfavorable than the path of credit spreads. Fixed-income investors are tilting towards shorter duration, but credit sensitive strategies may outperform throughout the rest of 2022.
Sources for data and statistics: Bloomberg, Morningstar, and ProShares.
The different market segments represented in the performance recap charts use the following indexes: U.S. Large Cap: S&P 500 TR; U.S. Large Cap Growth: S&P 500 Growth TR; U.S. Large Cap Value: S&P 500 Value TR; U.S. Mid Cap: S&P Mid Cap TR; U.S. Small Cap: Russell 2000 TR; International Developed Stocks: MSCI Daily TR NET EAFE; Emerging Markets Stocks: MSCI Daily TR Net Emerging Markets; Global Infrastructure: Dow Jones Brookfield Global Infrastructure Composite; Commodities: Bloomberg Commodity TR; U.S. Bonds: Bloomberg U.S. Aggregate; U.S. High Yield: Bloomberg Corporate High Yield; International Developed Bonds: Bloomberg Global Agg ex-USD; Emerging Market Bonds: DBIQ Emerging Markets USD Liquid Balanced.
THESE ENTITIES AND THEIR AFFILIATES MAKE NO WARRANTIES AND BEAR NO LIABILITY WITH RESPECT TO PROSHARES.
This is not intended to be investment advice. Indexes are unmanaged, and one cannot invest directly in an index. Past performance does not guarantee future results.
Any forward-looking statements herein are based on expectations of ProShare Advisors LLC at this time. Whether or not actual results and developments will conform to ProShare Advisors LLC’s expectations and predictions, however, is subject to a number of risks and uncertainties, including general economic, market and business conditions; changes in laws or regulations or other actions made by governmental authorities or regulatory bodies; and other world economic and political developments. ProShare Advisors LLC undertakes no duty to update or revise any forward-looking statements, whether as a result of new information, future events or otherwise.
Investing is currently subject to additional risks and uncertainties related to COVID-19, including general economic, market and business conditions; changes in laws or regulations or other actions made by governmental authorities or regulatory bodies; and world economic and political developments.
Investing involves risk, including the possible loss of principal. This information is not meant to be investment advice.
Bonds will decrease in value as interest rates rise. International investments may also involve risks from geographic concentration, differences in valuation and valuation times, unfavorable fluctuations in currency, differences in generally accepted accounting principles, and economic or political instability. In emerging markets, many risks are heightened, and lower trading volumes may occur. Small- and mid-cap companies may lack the financial and personnel resources to handle economic or industry-wide setbacks, and, as a result, such setbacks could have a greater effect on small- and mid-cap security prices.
The “S&P 500® Dividend Aristocrats® Index” is a product of S&P Dow Jones Indices LLC and its affiliates and has been licensed for use by ProShares. “S&P®” is a registered trademark of Standard & Poor’s Financial Services LLC (“S&P”), and “Dow Jones®” is a registered trademark of Dow Jones Trademark Holdings LLC (“Dow Jones”) and they have been licensed for use by S&P Dow Jones Indices LLC and its affiliates. ProShares based on S&P indexes are not sponsored, endorsed, sold or promoted by S&P or their affiliates, and make no representation regarding the advisability of investing in ProShares. THIS ENTITY AND ITS AFFILIATES MAKE NO WARRANTIES AND BEAR NO LIABILITY WITH RESPECT TO PROSHARES.