There’s Hope in Stocks, but Be Cautious in Bonds
Key Observations

A late-month rally pushed most equity indexes into the green for May. Corporate and government bonds enjoyed a positive May as well. Spreads tightened coincident with the equity rally and Treasury yields fell following tentative signs that inflation may have peaked.
Changes are afoot though. Quantitative Tightening (“QT”) has begun, and it will ultimately be bigger this time around. Through September, the Federal Reserve (the “Fed”) is capping its balance sheet reduction at just under $50B a month, which is in line with the peak of $50B per month during the previous QT period that began in October 2017. After September, however, plans are for that cap to likely double.
Let’s start with the most obvious implication of tightening. Longer-term bond yields will likely rise further. The 10-year U.S. Treasury yield rose 119 bps from just before QT began in 2017 through early October in 2018. The implications for stocks are not as clear. The S&P 500 had risen nearly 20% during the trailing 12 months prior to QT in 2017, and it continued to rise for roughly 12 additional months. This time around, the S&P 500 retreated prior to the inception of QT—leaving some extra valuation breathing room. Despite recent volatility, fundamentals have been hanging in there, and S&P 500 earnings grew nearly 10% in the first quarter. I have said before that “you have to hate stocks less than bonds,” and I believe that remains a sensible conclusion.
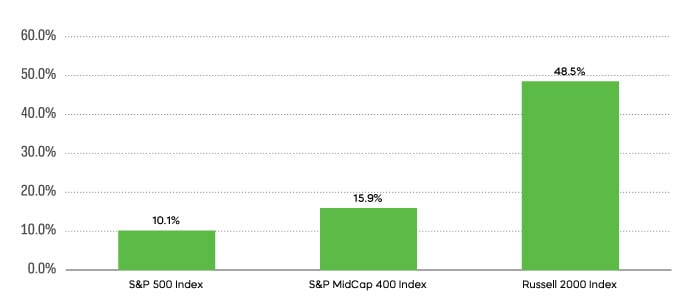
In times of heightened volatility, those sensibilities probably point most investors toward large-cap stocks. This time around, small-cap stocks could also deserve a place in investor portfolios. It comes down to valuation. The Russell 2000 Index is trading at close to half the price-to-book of the S&P 500—down from near parity a decade ago.
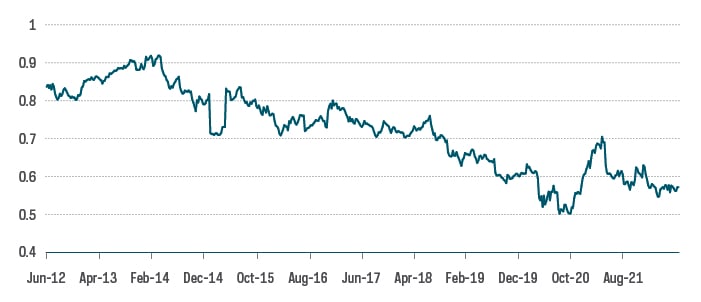
Chart of the Month
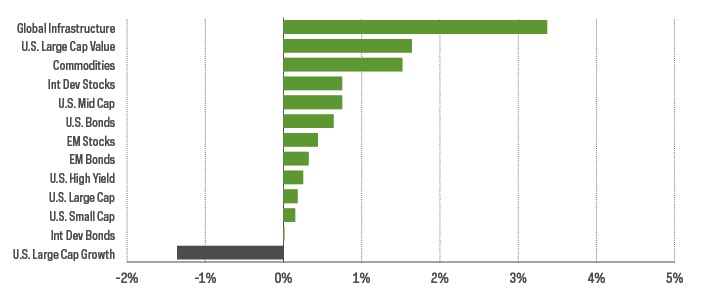
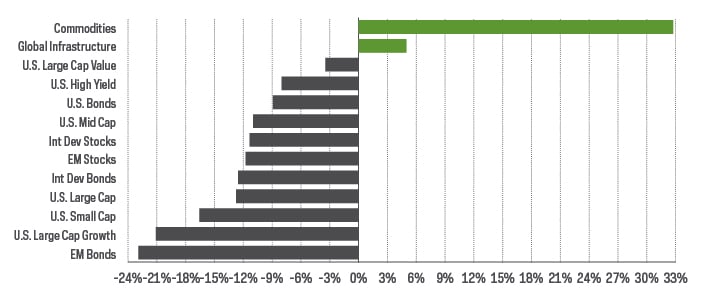
Performance Recap
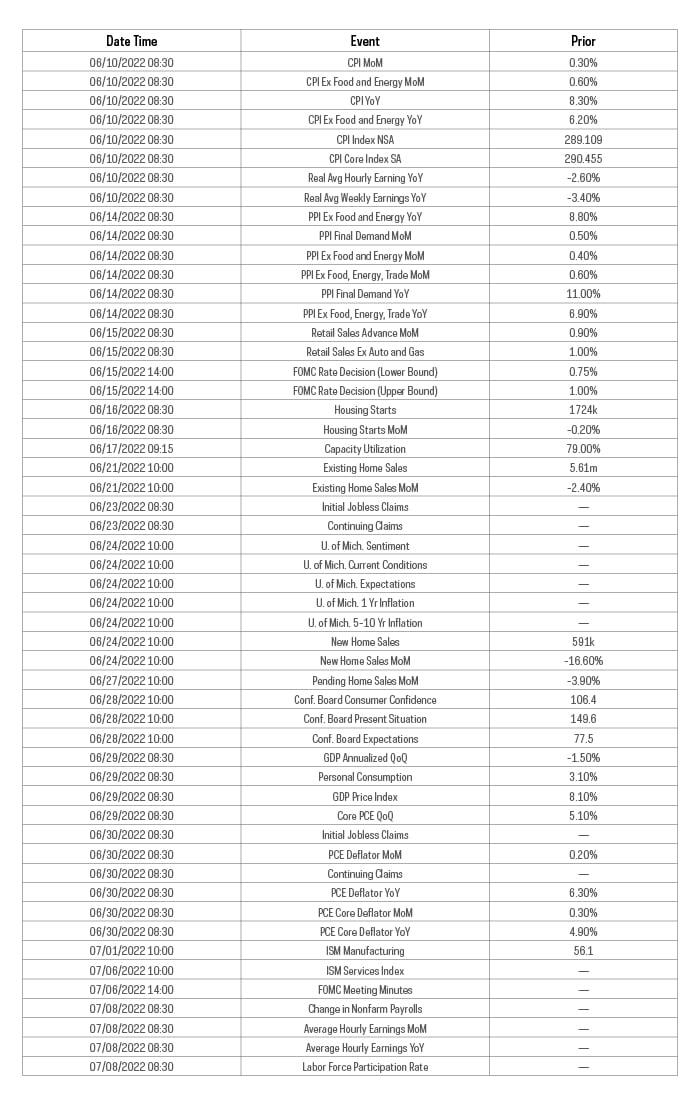
Economic Calendar
Here’s a list of upcoming key economic releases, which can serve as a guide to potential market indicators.
Equity Perspectives

As we approach the midpoint of 2022 and start the summer, most investors probably aren’t in a mood to celebrate. U.S. equities across the market-capitalization spectrum are in correction and have flirted with bear-market territory. There is, however, a potential glimmer of hope. After seven consecutive weeks of declines, stock prices moved modestly higher during the last week of May.
It's entirely too soon to tell if markets have stabilized and the worst of the current drawdown is behind us, however, and the same goes for the nascent market “rally” that began around mid-May. One dynamic that caught our attention has been the relative outperformance of mid-cap and small-cap stocks. Since May 11, both the S&P MidCap 400 and the Russell 2000 Index have outperformed the S&P 500. After an extended period of large-cap outperformance, is now the time for the “forgotten” smaller-cap segments to rally?
Despite market headwinds, it is relatively easy to formulate a case for the potential outperformance of small- and mid-cap stocks. It starts with the fundamentals.
As we mentioned earlier, the valuation of both small- and mid-cap stocks, relative to large caps, is about as favorable as it has been over the past decade. While valuation alone has little relationship to near-term stock performance, it has significant explanatory power over longer time frames. And the valuation advantage might grow wider even if relative outperformance continues. Why? Better earnings growth.
In a market that seems increasingly concerned about the potential for slowing growth, why not look at the market segments that have delivered the goods? S&P 500 companies reported positive sales and earnings growth for the first quarter, muting some fears of stagflation. But the under-appreciated story has been the strength of mid- and small-cap stocks during the first quarter’s earnings season.
Both segments delivered earnings and sales growth greater than large caps, and they are expected to deliver better full-year numbers. Small-cap earnings estimates tend to be more volatile given the thinner analyst coverage though, so don’t be surprised if there is variance on either side. The point is that growth is still expected to be robust.
Fundamental advantages aside, investors should be selective with their mid- and small-cap allocations in what remains a difficult equity environment. It seems prudent to manage your equity risk appropriately rather than avoiding an allocation outside of large caps or hiding out in cash. Volatility will likely remain with us until we get more clarity on inflation and Fed monetary policy, but much of the bad news is probably already baked into expectations.
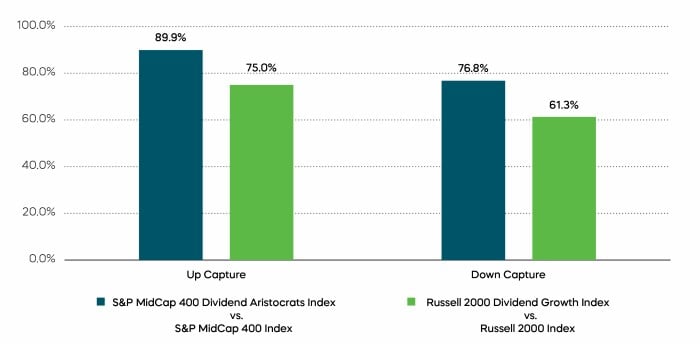
A potential solution worth consideration is to focus on dividend growth stocks that can weather market turbulence. Like their large-cap peers, the S&P MidCap 400 Dividend Aristocrats Index and the Russell 2000 Dividend Growth Index consist of quality stocks that have consistently grown their distributions for an extended number of years. They have also delivered an attractive combination of upside and downside capture that seems right for the times.
Fixed Income Perspectives

Quantitative Tightening has begun. The central bank not only increased the Fed Funds rate during its May meeting, but also indicated that it would begin shrinking the size of its balance sheet that had ballooned from $4.2 trillion in 2019 to $8.9 trillion as of May 25, 2022. While the Fed unwinds its balance sheet as Treasury, agency and mortgage-backed securities mature, it is continuing on in its efforts to tame inflation, which remains near 40-year highs. Per the latest Federal Open Market Committee (FOMC) statement, “with appropriate firming in the stance of monetary policy, the Committee expects inflation to return to its 2 percent objective and the labor market to remain strong.”
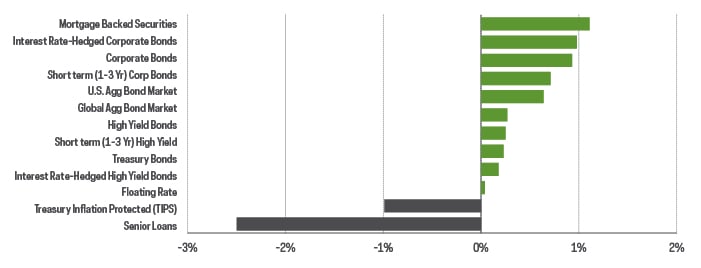
What are the implications for interest rates and the fixed-income market? The Treasury yield curve barely budged during the month of May, twisting ever so slightly as two- and 10-year Treasury yields fell 16 and 9 basis points (bps), respectively, while the 30-year Treasury yield rose 5 bps. Fixed-income returns during the month were fairly muted, with the Bloomberg U.S. Aggregate Bond Index returning 64 bps.
Fixed Income Returns—May 2022
The announced reduction of the Fed’s balance sheet didn’t come as a surprise to many investors. Though the details were unknown, it was actually a much-anticipated event. If we take a step back and look toward the last time the Fed began reducing the size of its balance sheet, in 2017, we may gain useful insight into the longer-term implication for yields this time around.
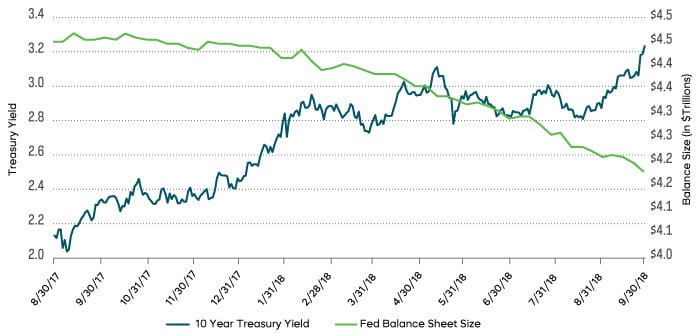
The Fed began reducing its balance sheet during the last cycle in October 2017. By October 2018, the 10-year Treasury yield had risen 119 basis points off the lows seen before the tightening cycle. Notice, in the chart above, how a significant portion of the rise came several months after quantitative tightening had begun. We may find ourselves in a similar situation this time around, though it is difficult to time these types of events.
Regardless, we anticipate that the Fed’s current plans will have similar longer-term implications. It is important to note that even with a plan in effect, the Fed maintains the ability to adjust policy in light of economic and financial developments. Regardless, the pain suffered by interest rate sensitive fixed-income strategies seen over the past year could be far from over.
Sources for data and statistics: Bloomberg, FactSet, Morningstar, and ProShares.
The different market segments represented in the performance recap charts use the following indexes: U.S. Large Cap: S&P 500 TR; U.S. Large Cap Growth: S&P 500 Growth TR; U.S. Large Cap Value: S&P 500 Value TR; U.S. Mid Cap: S&P Mid Cap TR; U.S. Small Cap: Russell 2000 TR; International Developed Stocks: MSCI Daily TR NET EAFE; Emerging Markets Stocks: MSCI Daily TR Net Emerging Markets; Global Infrastructure: Dow Jones Brookfield Global Infrastructure Composite; Commodities: Bloomberg Commodity TR; U.S. Bonds: Bloomberg U.S. Aggregate; U.S. High Yield: Bloomberg Corporate High Yield; International Developed Bonds: Bloomberg Global Agg ex-USD; Emerging Market Bonds: DBIQ Emerging Markets USD Liquid Balanced.
The Russell 2000 Index is a stock market index that measures the performance of the 2,000 smaller companies included in the Russell 3000 Index. The S&P MidCap 400 is a benchmark index published by Standard & Poor's (S&P) representing 400 companies with midrange market capitalizations. The S&P MidCap Dividend Aristocrats targets companies that are currently members of the S&P MidCap 400 that have increased dividend payments each year for at least 15 consecutive years. The Russell 2000 Dividend Growth Index targets companies that are currently members of the Russell 2000 Index and have increased dividend payments each year for at least 10 consecutive years.
THESE ENTITIES AND THEIR AFFILIATES MAKE NO WARRANTIES AND BEAR NO LIABILITY WITH RESPECT TO PROSHARES.
This is not intended to be investment advice. Indexes are unmanaged, and one cannot invest directly in an index. Past performance does not guarantee future results.
Any forward-looking statements herein are based on expectations of ProShare Advisors LLC at this time. Whether or not actual results and developments will conform to ProShare Advisors LLC’s expectations and predictions, however, is subject to a number of risks and uncertainties, including general economic, market and business conditions; changes in laws or regulations or other actions made by governmental authorities or regulatory bodies; and other world economic and political developments. ProShare Advisors LLC undertakes no duty to update or revise any forward-looking statements, whether as a result of new information, future events or otherwise.
Investing is currently subject to additional risks and uncertainties related to COVID-19, including general economic, market and business conditions; changes in laws or regulations or other actions made by governmental authorities or regulatory bodies; and world economic and political developments.
Investing involves risk, including the possible loss of principal. This information is not meant to be investment advice.
Investments in smaller companies typically exhibit higher volatility. Small- and mid-cap companies may have limited product lines or resources, may be dependent upon a particular market niche and may have greater fluctuations in price than the stocks of larger companies. Small- and mid-cap companies may lack the financial and personnel resources to handle economic or industry-wide setbacks and, as a result, such setbacks could have a greater effect on small- and mid-cap security prices. Bonds will decrease in value as interest rates rise.
The “S&P 500®", "S&P MidCap 400®", and “S&P MidCap 400® Dividend Aristocrats Index” are products of S&P Dow Jones Indices LLC and its affiliates. "S&P®" is a registered trademark of Standard & Poor’s Financial Services LLC (“S&P”), and “Dow Jones®" is a registered trademark of Dow Jones Trademark Holdings LLC (“Dow Jones”) and they have been licensed for use by S&P Dow Jones Indices LLC and its affiliates. The "Russell 2000® Dividend Growth Index" and "Russell®" are trademarks of Russell Investment Group. All have been licensed for use by ProShares. ProShares based on these indexes are not sponsored, endorsed, sold or promoted by these entities or their affiliates, and they make no representation regarding the advisability of investing in ProShares. THESE ENTITIES AND THEIR AFFILIATES MAKE NO WARRANTIES AND BEAR NO LIABILITY WITH RESPECT TO PROSHARES.