By Kieran Kirwan, CAIA and Brennan Rouse
Key Observations
- Investors looking for equity income have turned to traditional monthly covered call strategies, but they require making a costly trade-off between the potential to earn that income versus the ability to generate long-term total returns.
- Investors may believe—mistakenly—that these strategies offer downside protection during periods of equity market stress.
- In reality, such strategies have sacrificed significant growth over time, provided little downside protection, and generally only recaptured a fraction of the upside during market recoveries.
- Bonds have historically provided, and may continue to provide, better downside protection and diversification to equities.
- ETFs using ProShares’ pioneering daily call option strategy are designed to improve the income and return trade-off versus traditional strategies—and their performance has been compelling.
Traditional Covered Call Strategies Sacrifice Upside and Don’t Eliminate Downside Risk
Covered call strategies have become very popular among investors, particularly those looking for higher levels of yield. While covered call strategies can generate attractive levels of income under the right circumstances, traditional monthly strategies typically require investors to make a costly trade-off between high income potential and total return.
Over the past 10 years, the Cboe S&P 500 BuyWrite Index has captured 88% of the S&P 500's downside, but returned just 63% of its upside.[1]
Some investors recognize and accept this trade-off in total return, believing that traditional monthly covered call strategies offer enhanced downside protection—but this expectation may be misplaced. Over the past 10 years, the Cboe S&P 500 BuyWrite Index has captured 88% of the downside of the S&P 500, while only returning 63% of the upside.[1] Any protection offered has been more than offset by missed long-term gains.
The trade-off of missed gains results from the payout structure of monthly covered call strategies, illustrated in the diagram below. An investor accepts a ceiling, or cap, on the appreciation of an investment—for example, a stock market index—in return for income from the sale of a call option. If the market price of the stock index rises above the strike price of the call option, the option is “in the money,” meaning the seller of the call option owes a payment to the buyer. This payout is equal to the difference between the price of the index and the option's strike price. The option payout is “covered” by the gains on the stock index. The covered call strategy does not lose money if the price of the index rises above the option’s strike price, but neither can its return increase any further—the strategy simply caps the upside performance at that price.
In addition to illustrating the potentially significant upside trade-off, we can see from this diagram that traditional monthly covered call strategies do nothing structurally to eliminate much of the downside risk.
-
The greater the positive returns in the underlying stocks, the greater the potential upside sacrifice.
-
The greater the loss, on the other hand, the greater the potential downside.
Covered Call Payoff at Expiration
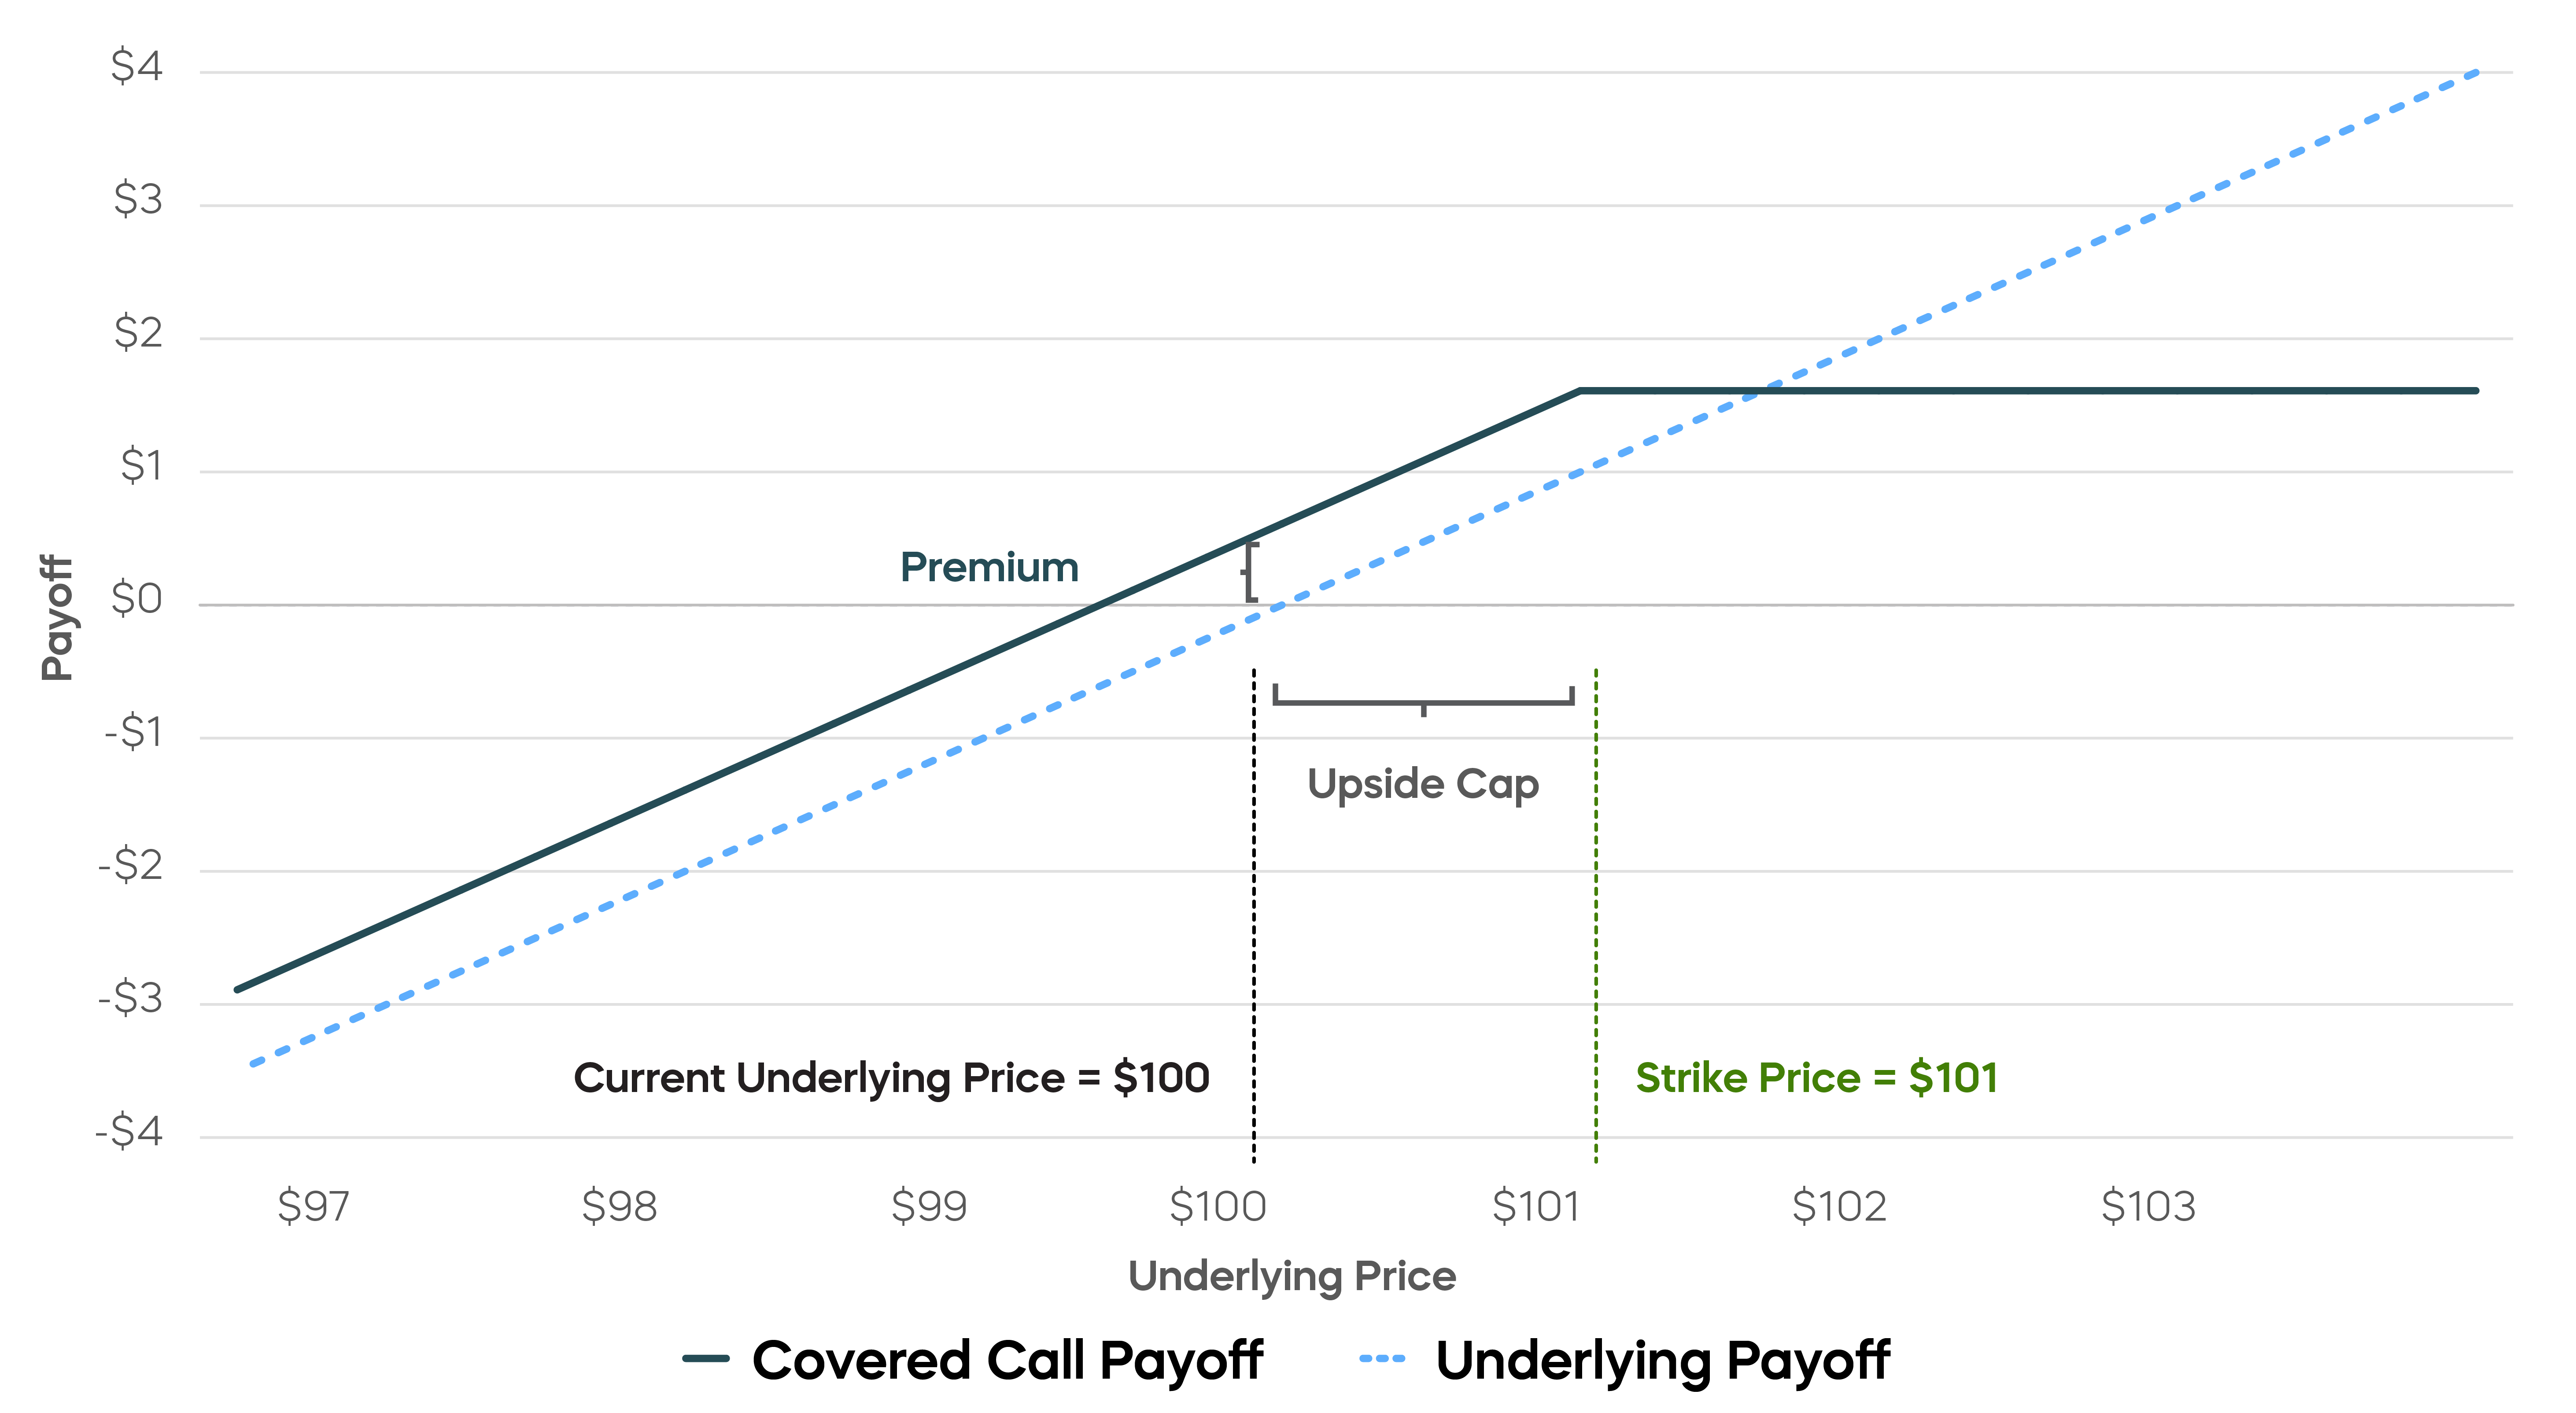
Chart is for illustrative purposes only.
Traditional Covered Call Strategies During the COVID-19 Crash
The stock market crash early in the COVID-19 pandemic provides an example of the lack of downside protection from monthly covered call strategies. The S&P 500 dropped roughly 32% from highs in February 2020 to a low point in March 2020. Investors in traditional covered call strategies expecting downside protection during that period would have been disappointed. The Cboe S&P 500 BuyWrite Index—a proxy for traditional monthly covered call strategies—declined by 29%, almost as much as the S&P 500.[2]
Covered Call Strategies Saw Steep Losses During the 2020 Market Crash
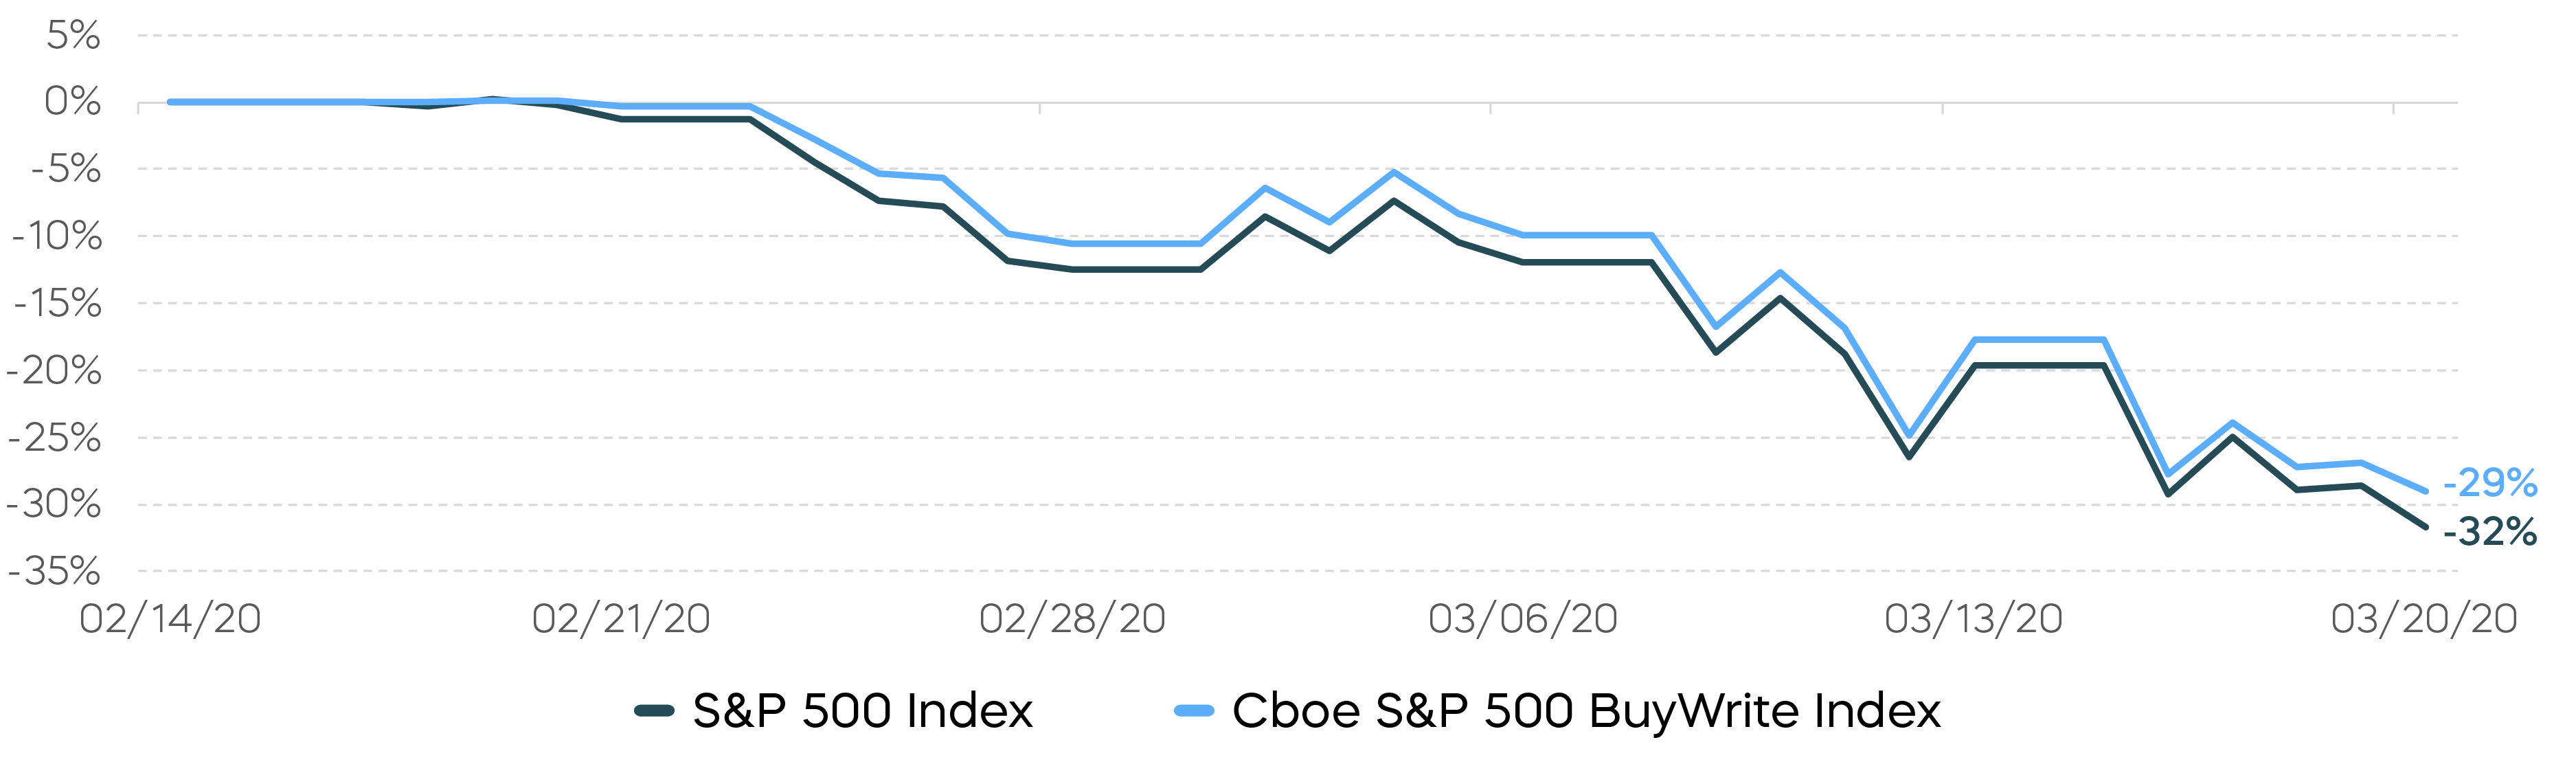
Source: Bloomberg. Weekly data 2/14/20 – 3/20/20. Index returns are for illustrative purposes only and do not reflect any management fees, transaction costs or expenses. Indexes are unmanaged, and one cannot invest directly in an index. Past performance does not guarantee future results.
To make matters worse, when the S&P 500 recovered, investors only captured about half of the market’s rebound later in the year.[3]
Covered Call Strategies Lagged During the 2020 Market Recovery
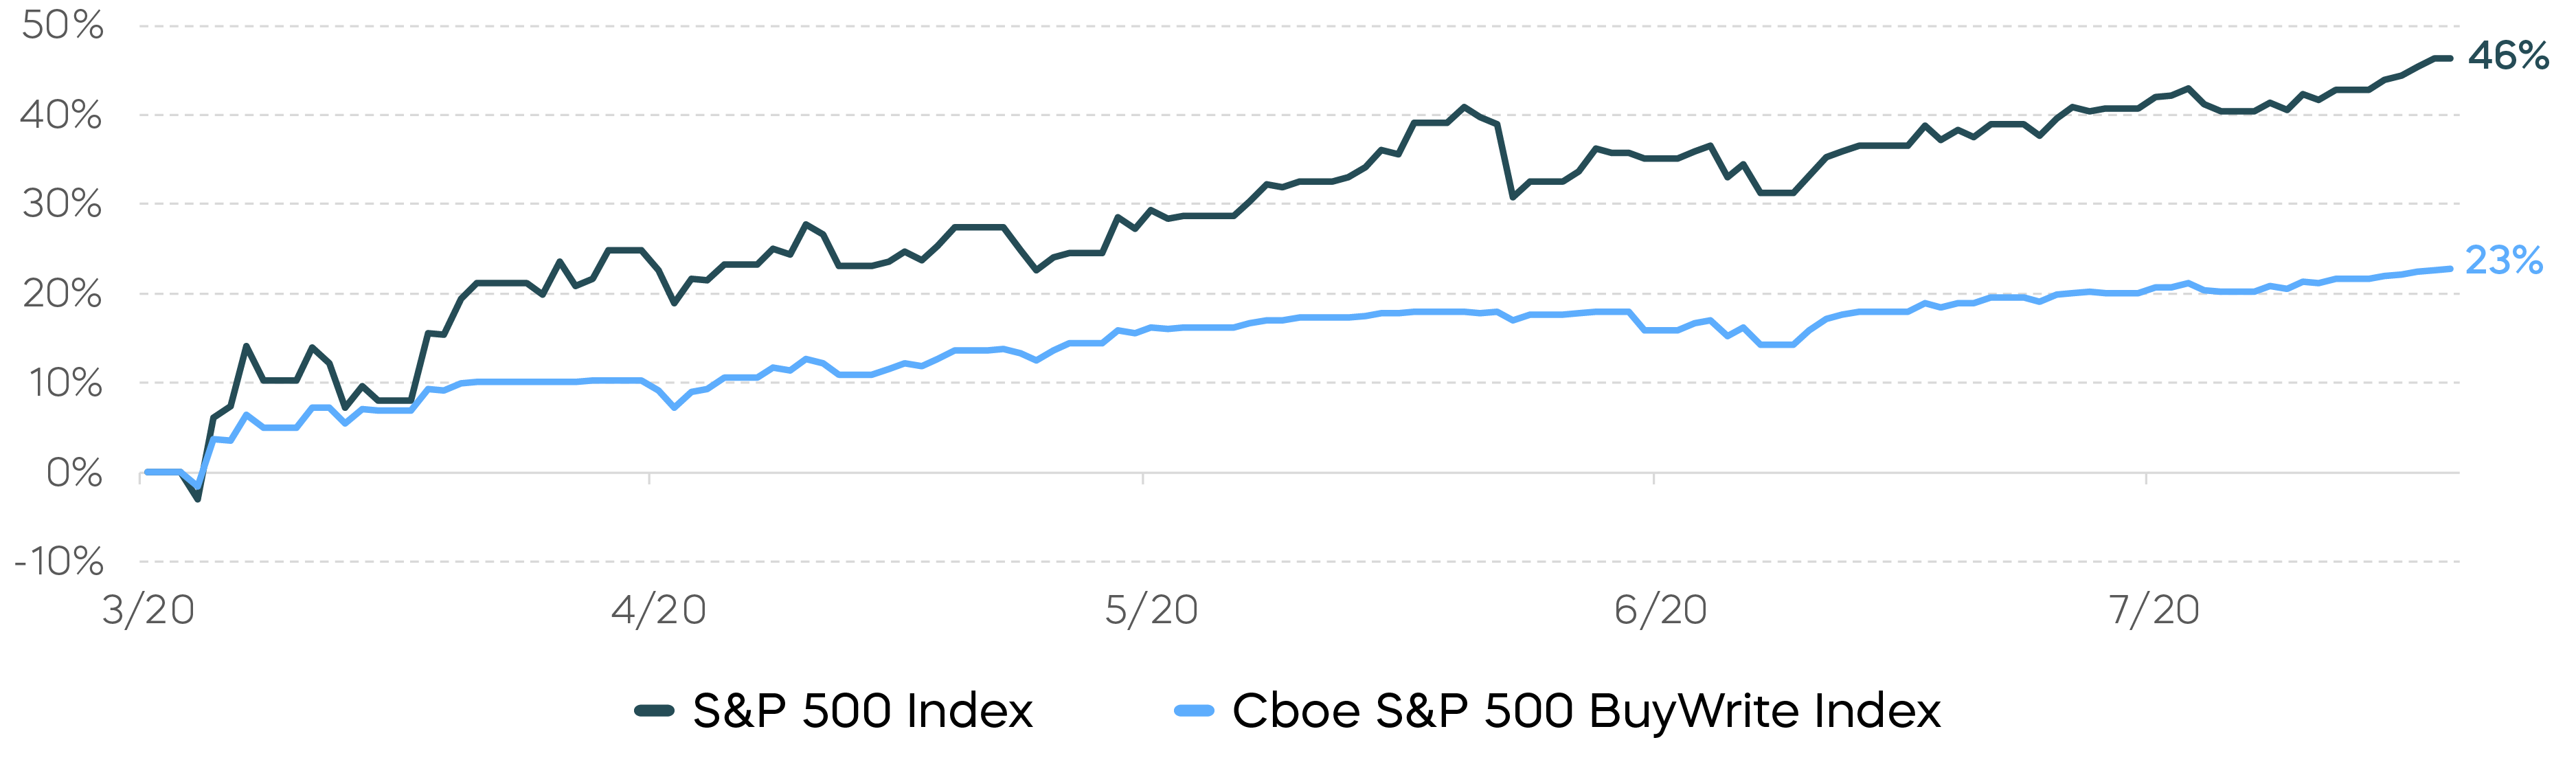
Source: Bloomberg. Weekly data 3/20/20 – 8/7/20. Index returns are for illustrative purposes only and do not reflect any management fees, transaction costs or expenses. Indexes are unmanaged, and one cannot invest directly in an index. Past performance does not guarantee future results.
Over the entire period of the S&P 500's drawdown and recovery, which brought the S&P 500 back to even, an investor in a monthly covered call strategy like the Cboe S&P 500 BuyWrite Index would have seen losses of approximately 13%.[4]
Downturns of the Cboe S&P 500 BuyWrite Index Since Inception
Since inception of the Cboe S&P 500 BuyWrite Index, there have been seven drawdowns of 10% or more.[5]
The COVID example is not an anomaly. Since the inception of the Cboe S&P 500 BuyWrite Index in April 2002, there have been seven drawdowns of 10% or more from prior highs. During these periods, the Cboe S&P 500 BuyWrite Index captured nearly three quarters of the downside losses of the S&P 500 but returned just a bit more than half of the upside recovery on average.[5]
Losses During S&P 500 Drawdown Periods
Underperformance During S&P 500 Recovery Periods
Source: Bloomberg. Weekly data 4/12/02 – 3/31/26. Index returns are for illustrative purposes only and do not reflect any management fees, transaction costs or expenses. Indexes are unmanaged, and one cannot invest directly in an index. Past performance does not guarantee future results.
Bonds Have Been Better Equity Diversifiers
Clearly, traditional covered call solutions have neither provided enough downside protection during periods of equity market stress nor made up for it with their disappointing recoveries. This combination has led to traditional strategies significantly underperforming their benchmarks over time. Investors seeking downside protection can potentially do better with bonds. During the six equity drawdown periods noted earlier, bonds—as proxied by the ICE BofA 7-10 Year U.S. Treasury Bond Index—returned an average of 5%.
We provide a detailed analysis on how traditional covered call strategies have failed to provide meaningful diversification benefits, in our previous article, Balancing Yield & Total Return.
Our Covered Call Innovation Using Daily Options Offers a Solution
For investors looking for both income and long-term equity market returns in the same investment, there is a potentially better solution. ProShares has pioneered a strategy designed to improve the high income vs. total return trade-off of monthly covered call strategies. Our approach sells daily call options, resetting the upside cap every day and allowing for greater potential market participation.
While this strategy is relatively new—the S&P 500 Daily Covered Call Index was launched in October 2023—comparisons to traditional monthly strategies are compelling.[6] In addition to its long-term total return, the income potential of a covered call strategy is key. The S&P 500 Daily Covered Call Index’s annualized yield as of March 31, 2026 was 10.6%. A covered call strategy’s daily option premium income will, of course, vary over time based on expectations of stock market volatility and other factors.[7]
The Daily Covered Call Index Strategy Shows Promise
Total Return 10/5/23 to 3/31/26 (Annualized)
Source: Bloomberg. Index data from 10/5/23–3/31/26. ISPY seeks investment results that track the performance of the S&P 500 Daily Covered Call Index. ISPY fund total returns: One-Year: 12.62% (NAV) | 12.88% (Market Price); Since Inception (12/18/23): 13.19% (NAV) | 13.28% (Market Price). Index returns are for illustrative purposes only and do not reflect any management fees, transaction costs or expenses. Indexes are unmanaged, and one cannot invest directly in an index. Past performance does not guarantee future results.
ISPY has very limited performance history, which should not be taken as an indication of future performance. The performance quoted represents past performance and does not guarantee future results. Investment return and principal value of an investment will fluctuate so that an investor's shares, when sold or redeemed, may be worth more or less than the original cost. Shares are bought and sold at market price (not NAV) and are not individually redeemed from the fund. Market price returns are based upon the midpoint of the bid/ask spread at 4:00 p.m. ET (when NAV is normally determined for most funds). Your brokerage commissions will reduce returns. Current performance may be lower or higher than the performance quoted. For standardized returns and performance data current to the most recent month end, see the Performance page.
The Takeaway
Investors have turned to traditional monthly covered call strategies for income generation, equity market participation, and downside protection. While they may generate income, traditional strategies have sacrificed significant total returns and failed to diversify equity portfolios during periods of market drawdowns.
Our new approach based on daily options, ProShares High Income ETFs, is designed to target high income, provide an opportunity for greater upside equity market performance, and to potentially capture long-term returns that traditional covered call strategies sacrifice.
[1] Source: Morningstar. Quarterly data from 3/31/16 – 3/31/26.
[2] Source: Bloomberg. Weekly data 2/14/20 – 3/20/20
[3] Source: Bloomberg. Weekly data 3/20/20 – 8/7/20
[4] Source: Bloomberg. Weekly data 2/14/20 – 8/7/20
[5] Source: Bloomberg. Weekly Data 4/12/02 – 3/31/26
[6] Source: Bloomberg. Data from 10/5/23 through 3/31/26.
[7] Source: ProShares. The annualized index yield reflects the dividend and call premium income earned by the index as of 3/31/26, on an annualized basis, as measured by the S&P 500 Daily Covered Call Index - Income Only, a sub-index that measures the cash received by the index from dividends and call option premiums. The annualized index yield assumes that the income received as of 3/31/26 would remain the same, but future income may differ significantly and is not guaranteed. The annualized index yield reflects dividend and call premium income from a short period of time only and does not reflect total returns. The index has a very limited performance history, which should not be taken as an indication of future performance. Indexes are unmanaged and do not include the effect of fees. One cannot invest directly in an index. Past performance does not guarantee future results. The annualized index yield is for illustrative purposes only and does not represent actual performance received by any investor.
Learn More
ISPY
S&P 500 High Income ETF
ProShares S&P 500 High Income ETF seeks investment results, before fees and expenses, that track the performance of the S&P 500 Daily Covered Call Index.
IQQQ
Nasdaq-100 High Income ETF
ProShares Nasdaq-100 High Income ETF seeks investment results, before fees and expenses, that track the performance of the Nasdaq-100 Daily Covered Call Index.
ITWO
Russell 2000 High Income ETF
ProShares Russell 2000 High Income ETF seeks investment results, before fees and expenses, that track the performance of the Cboe Russell 2000 Daily Covered Call Index.