Key Observations
At the end of the second quarter, it feels like the market went nowhere but up. A 25% rally in the quarter from April lows saw the S&P 500 finish up over 10% in June.[1] How does that eye-popping rally work? The answer is April’s terrible start: Beginning April 2, the S&P 500 was down over 12% in the several days immediately following the “Liberation Day” tariff announcements.[1] Investors who capitulated in the wake of the tariff announcements and sold out of their equity positions missed out.
Why It’s Important to Stay Invested
It is easy to invest when markets are rallying, but it can be tough for investors to stay in their seats when markets inevitably decline again. Behavioral economics teaches us that the human brain typically feels the emotional impact of a loss more than the joy of an equivalent gain. And even during rallies, there always seems to be something to worry about. While tariff concerns have diminished, they haven’t disappeared, and valuation concerns remain. We may not be able to rewire our brains to ignore fear, but a quick look at S&P 500 stock fundamentals demonstrates that while the market isn’t perfect, it’s not stupid either, and current anxieties may be overblown.
S&P 500 Fundamentals Have Been Strong
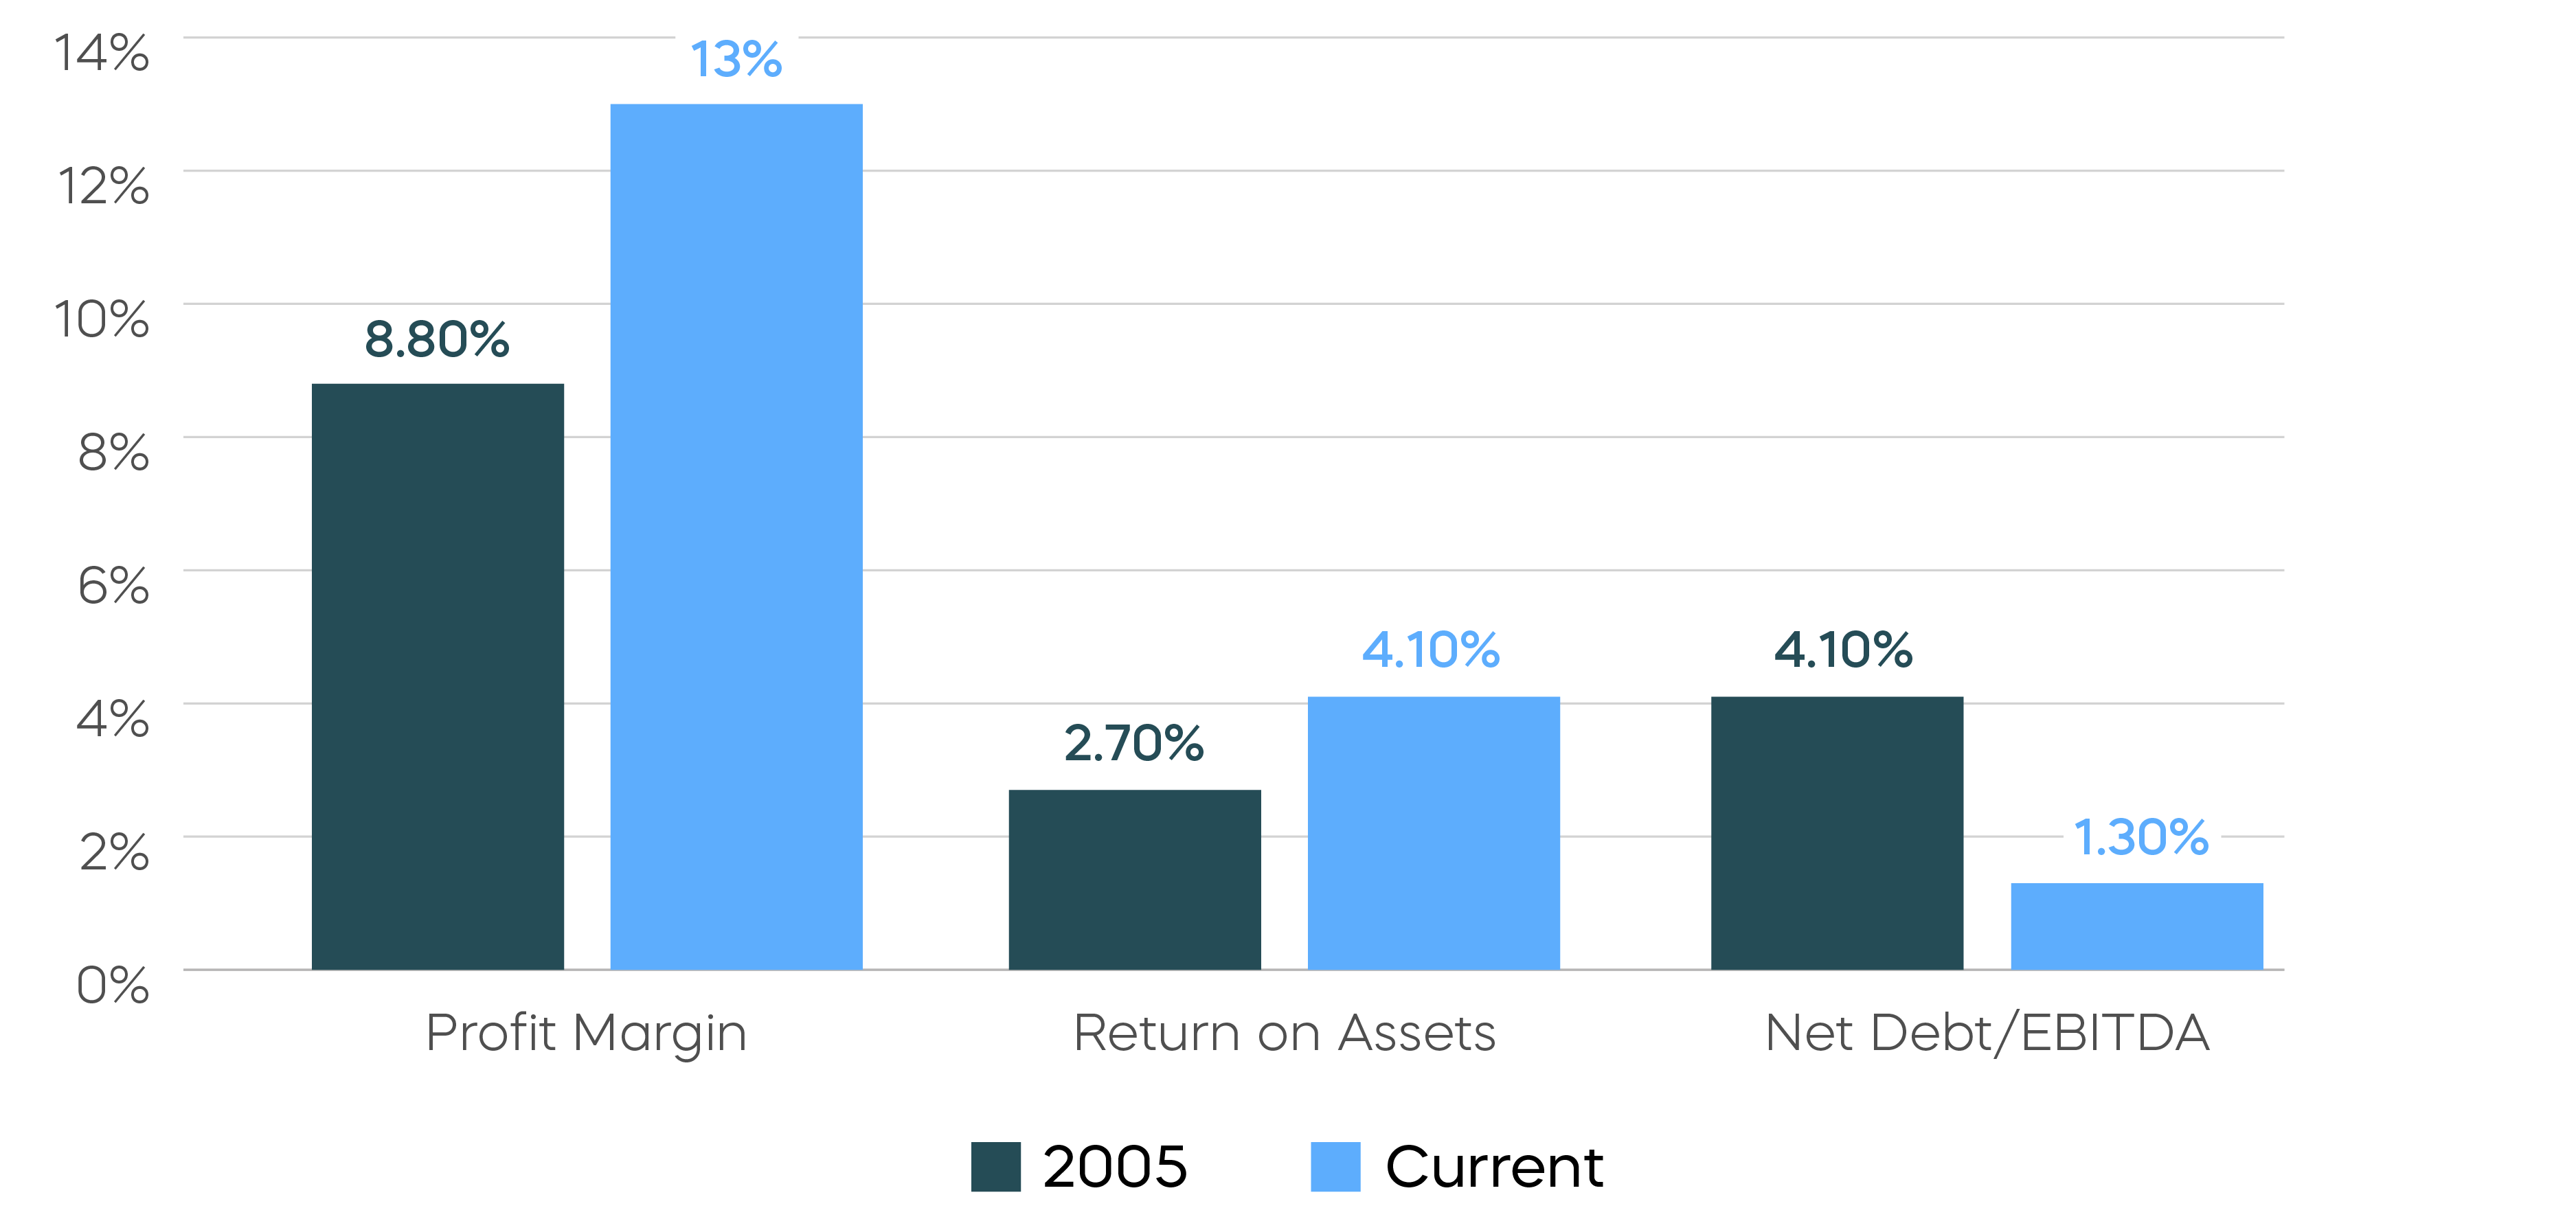
Source: Bloomberg. Data as of 7/2/25.
Corporate profits, returns and debt levels all offer support for today’s higher valuations and larger multiples. Healthier profit margins than in the past mean a greater proportion of top-line growth makes it to the bottom line. Higher return on assets means that less capital is being used to generate those profits. And significantly less debt means less financial risk.
If you are worried about geopolitics, consider this from our recently published commentary on the Middle-East conflict. Markets proved resilient and ultimately did well during the first and second Gulf Wars, rewarding those who stayed invested despite the potential for market disruption.
After the start of the first Gulf War, the S&P 500 recovered its initial losses in just a few months, and by the end of 1991 had increased by over 29% from the launch of Operation Desert Shield in August of 1990.
Stocks Rose During the First Gulf War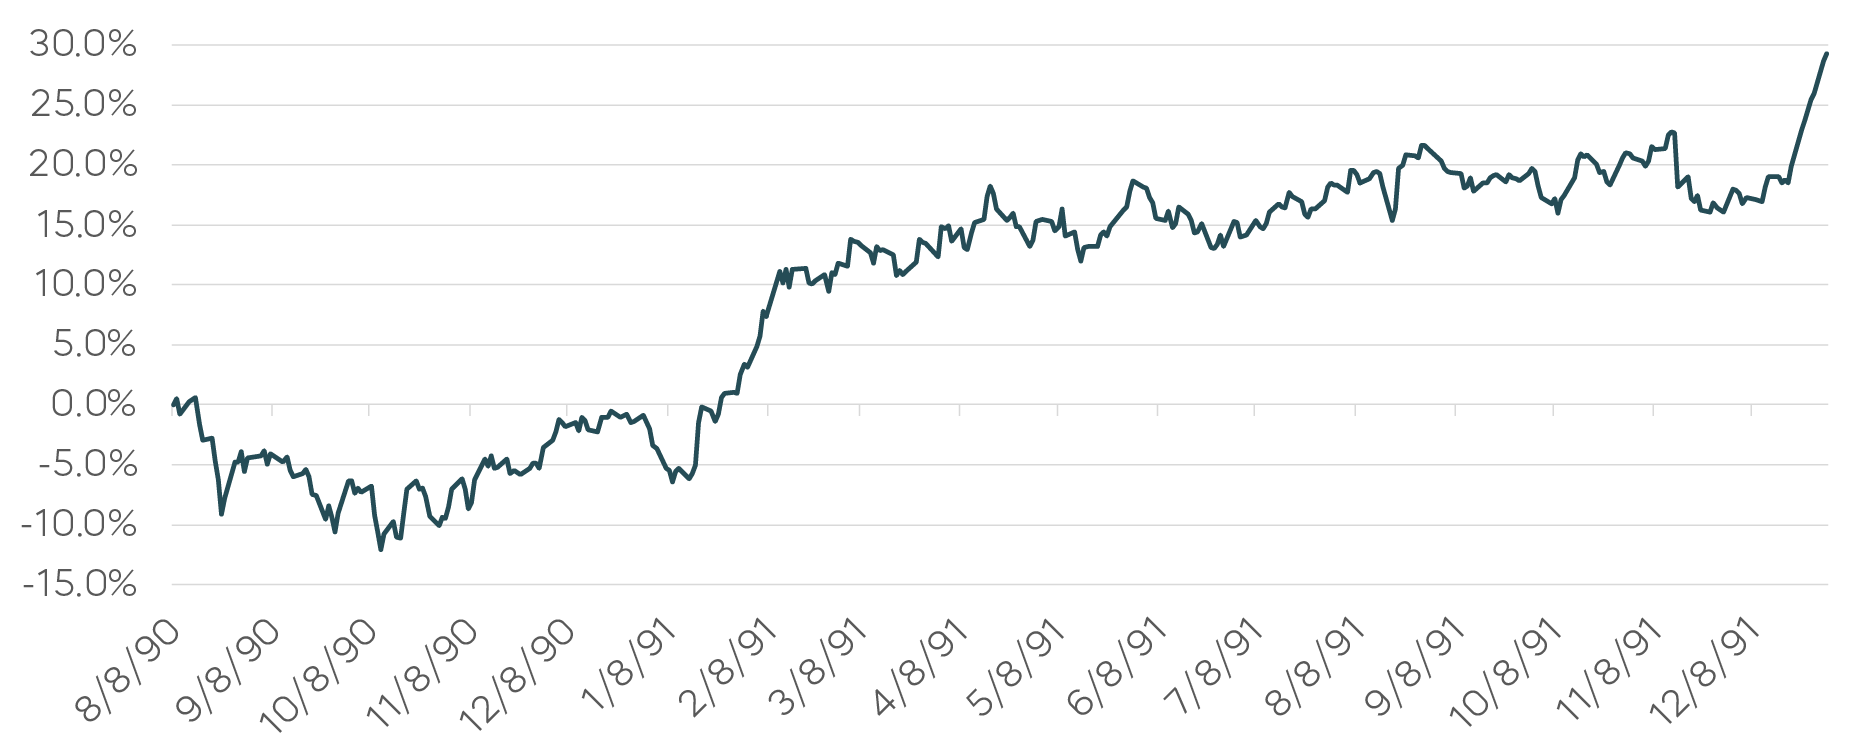 Source: Bloomberg. S&P 500 total returns 8/8/90–12/31/91. Index returns are for illustrative purposes only and do not reflect any management fees, transaction costs or expenses. Indexes are unmanaged, and one cannot invest directly in an index. Past performance does not guarantee future results.
The S&P 500 had fallen modestly prior to the beginning of the second Gulf War in 2003, but its recovery began even before the U.S. invasion on March 20, 2003 and ended the year up roughly 29%. Again, it paid to stay away from the headlines and in the market—especially over the long term.
Stocks Also Rose During the Second Gulf War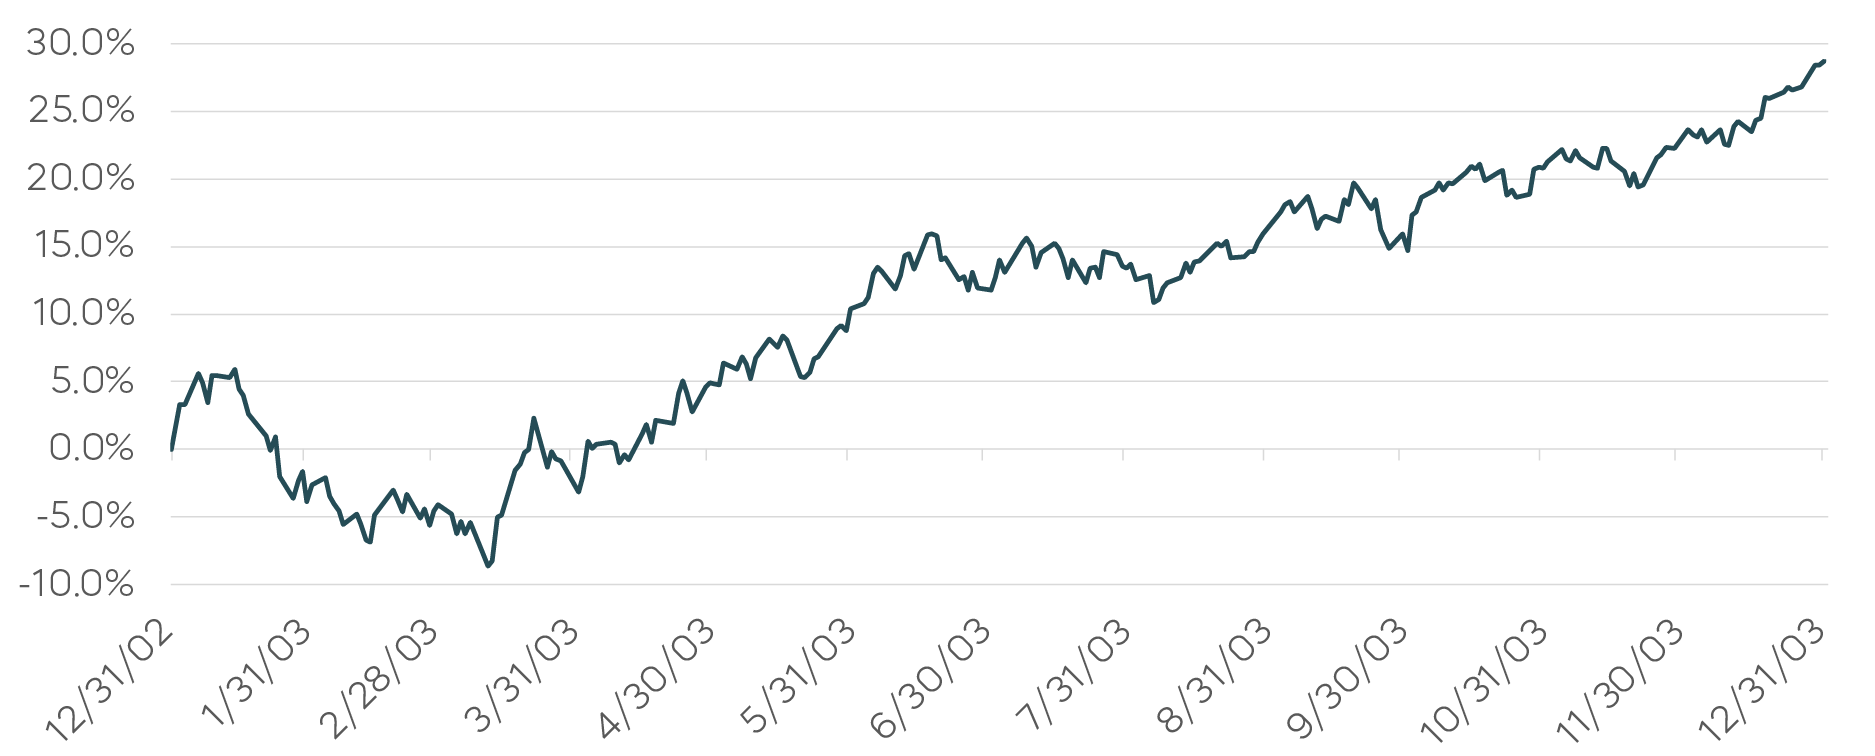 Source: Bloomberg. S&P 500 total returns 12/31/02–12/31/03. Index returns are for illustrative purposes only and do not reflect any management fees, transaction costs or expenses. Indexes are unmanaged, and one cannot invest directly in an index. Past performance does not guarantee future results.
Time in the market still matters more than timing the market, and investors should remember markets do not always snap back the way the S&P 500 has since April, after the initial tariff turmoil. While the backdrop for equities going into the latter half of 2025 seems reasonably positive, there is a chance of that assessment being wrong and that there could be a lengthy downturn. The S&P 500 has had at least two extended, 12+ year periods (1966–1982 and 2000–2012) during which stock prices stagnated and produced weak returns.[2]
Beyond stocks, diversification matters, too. Here, we point out that diversification into bonds doesn’t always work. At the height of the tariff uncertainty earlier this year, the Bloomberg U.S. Long Treasury Total Return Index Value Unhedged Index fell over 6%.[3] And looking back to 2022 when the S&P 500 fell over 18%, that same Bloomberg Treasury index fell over 29%. Of course, 2022 was the end of the Quantitative Easing era, and the odds of a sell-off of that magnitude in longer-term Treasuries today is less likely. However, while profit margins have been strong for the S&P 500 and bonds seem firm, markets often turn unexpectedly, and a typical diversification scheme using just stocks and bonds could fail.
Options strategies offer another path for risk management. When stocks and bonds fell together in 2002, it put a spotlight on buffer equity strategies that use options to manage equity risk and shape returns to match investors’ psyches. The S&P 500 Daily Dynamic Buffer Index offers an evolution to this approach. It uses daily options and targets more protection as expected volatility increases. For investors who may need a little help to stay invested during challenging markets—those with less time to recover from a downturn or greater aversion to loss—such a dynamic buffer approach may be worth a look.
Asset Class Perspectives
Asset Class Returns—June 2025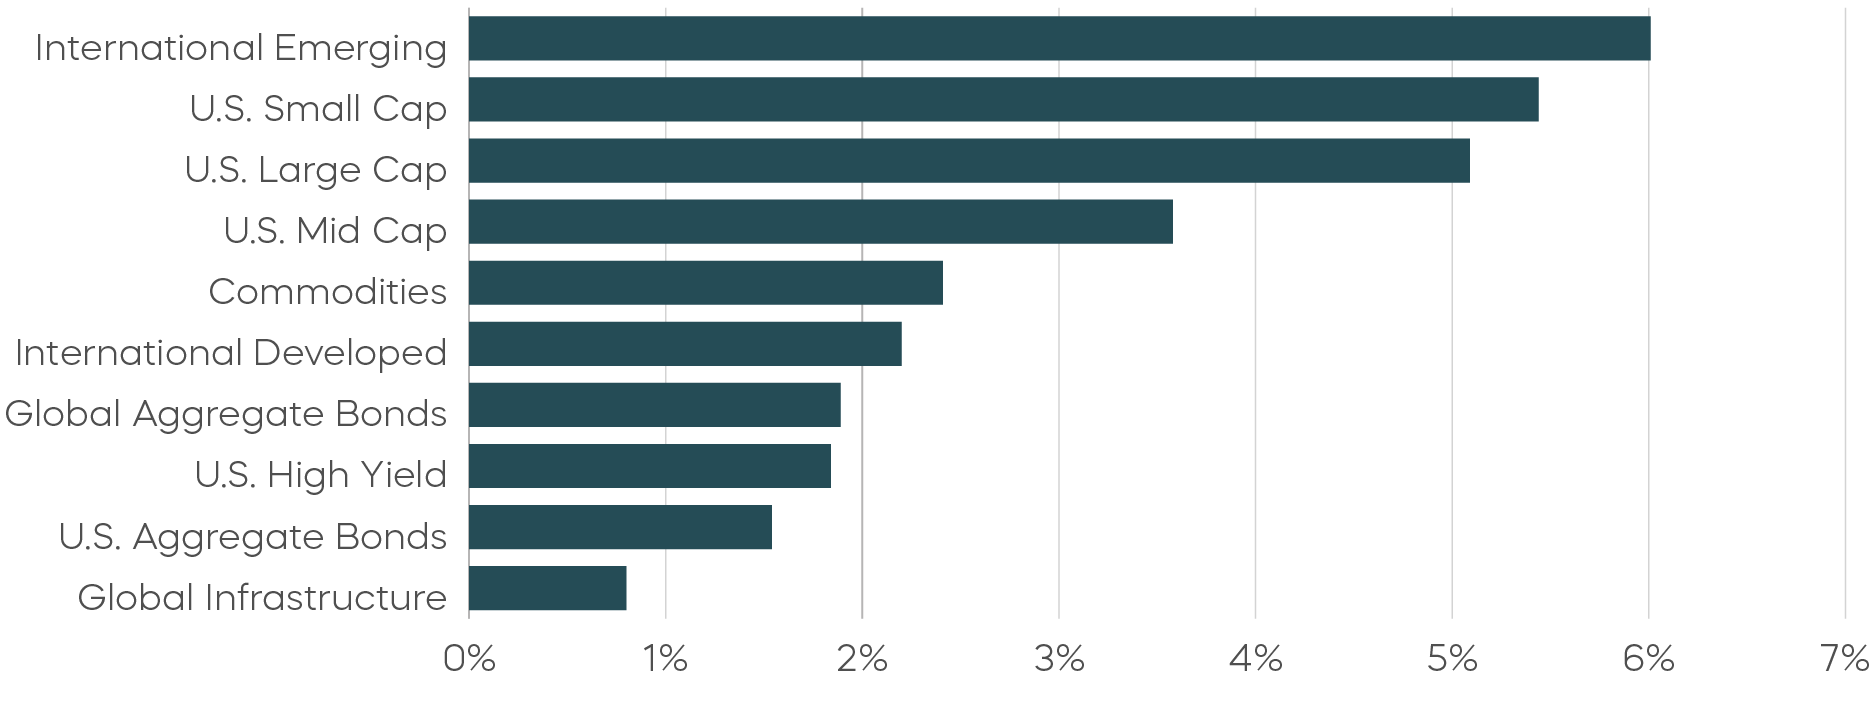
Asset Class Returns—Year-to-Date
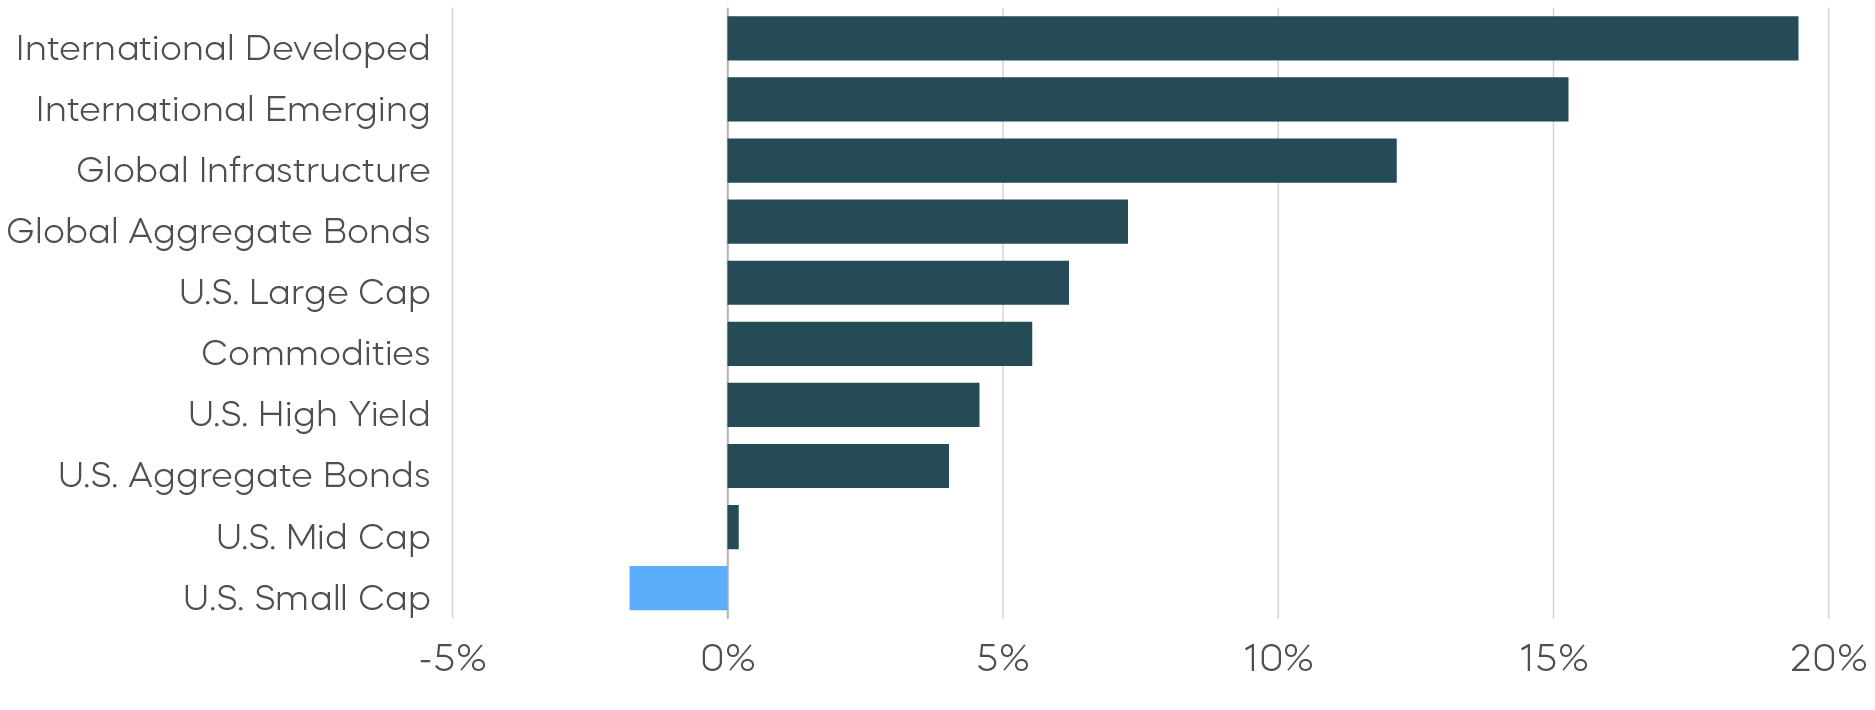 Source: Bloomberg. June returns 6/1/25–6/30/25; year-to-date returns 1/1/25‒6/30/25. Index returns are for illustrative purposes only and do not reflect any management fees, transaction costs or expenses. Indexes are unmanaged, and one cannot invest directly in an index. Past performance does not guarantee future results.
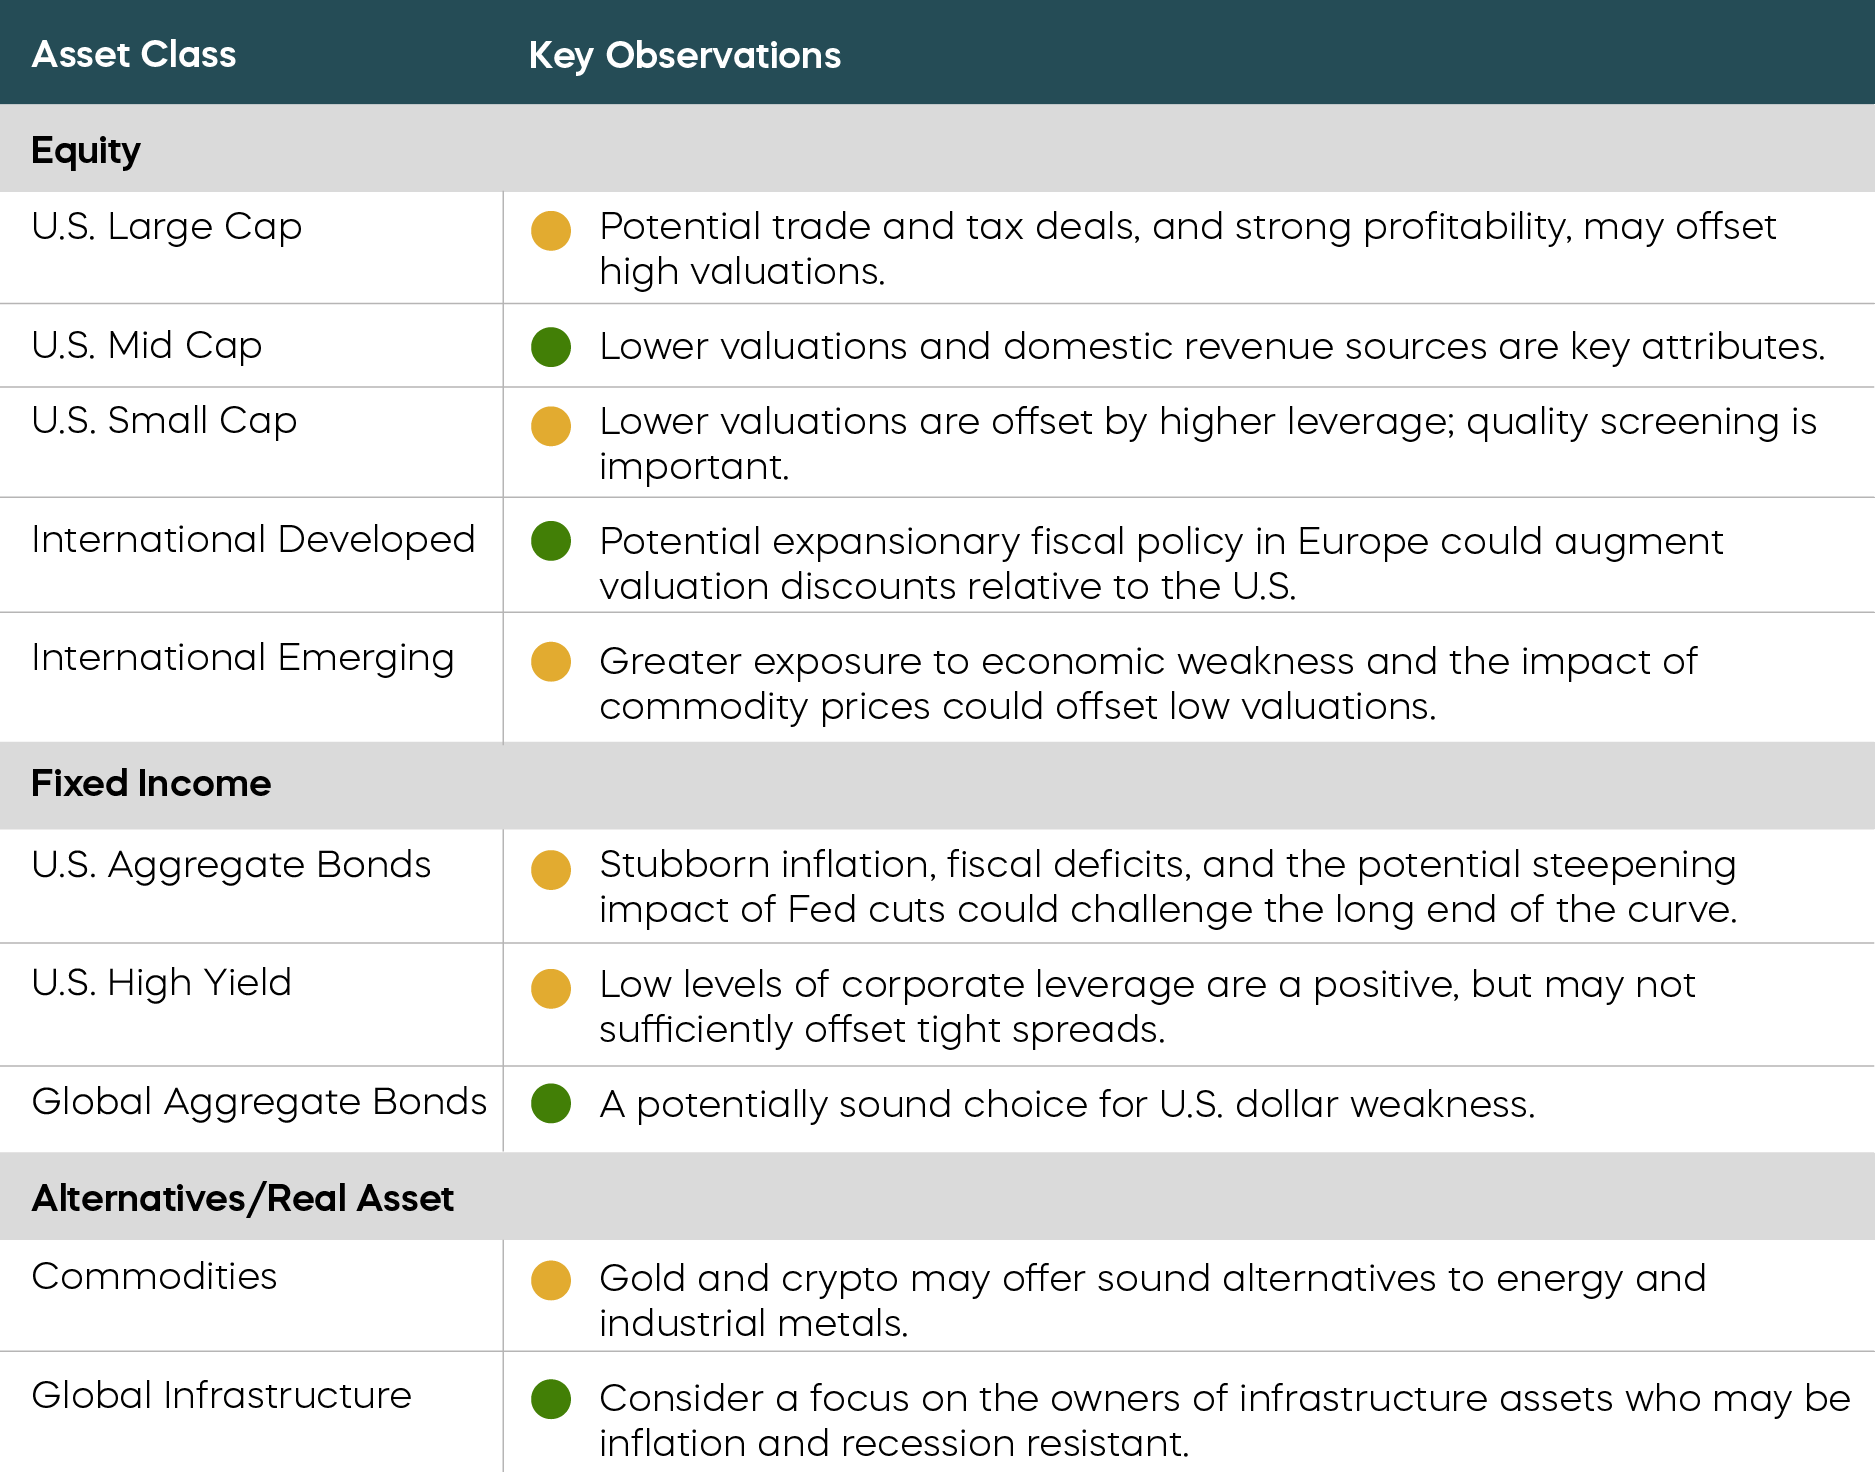
The following are observations on a range of asset classes. For each, green indicates a constructive backdrop, yellow indicates a neutral environment, and red would indicate a challenging backdrop.
Equity Perspectives
Fundamentals Remain Strong, but Elements of Froth Emerge
Our 2025 market outlook noted that continued equity strength was supported by history and fundamentals. Despite coming perilously close to a bear market in early April this year, the S&P 500 remains in a bull market and—along with the Nasdaq-100 Index—is now sitting at or near all-time highs. If we look at history as a guide, these facts we see are not typically a signal to retreat. The current bull market for the S&P 500 remains relatively young and has thus far provided lower-than-average returns compared to the historical average of all bull markets.[4] And, according to Standard & Poor’s and FactSet, investing when the market is at all-time highs has produced slightly better-than-average returns over the subsequent 1-, 3-, and 5-year periods.[5]
The fundamental equity picture in 2025 remains strong, if slightly less bright than at the start of the year. Second-quarter earnings estimates for all 11 sectors of the S&P 500 have been revised downwards over the past three months, according to FactSet, but we emphasize that calendar year 2025 and 2026 earnings are expected to remain positive across the capitalization spectrum. If realized, this growth could allow for S&P 500 stocks to grow into current valuations that have returned to slightly frothy levels. Notably, the S&P MidCap 400 continues to offer a solid combination of expected earnings growth and generally more favorable valuations versus the S&P 500, especially in high-quality names.
Earnings Estimates Have Been Revised Downward but Remain Healthy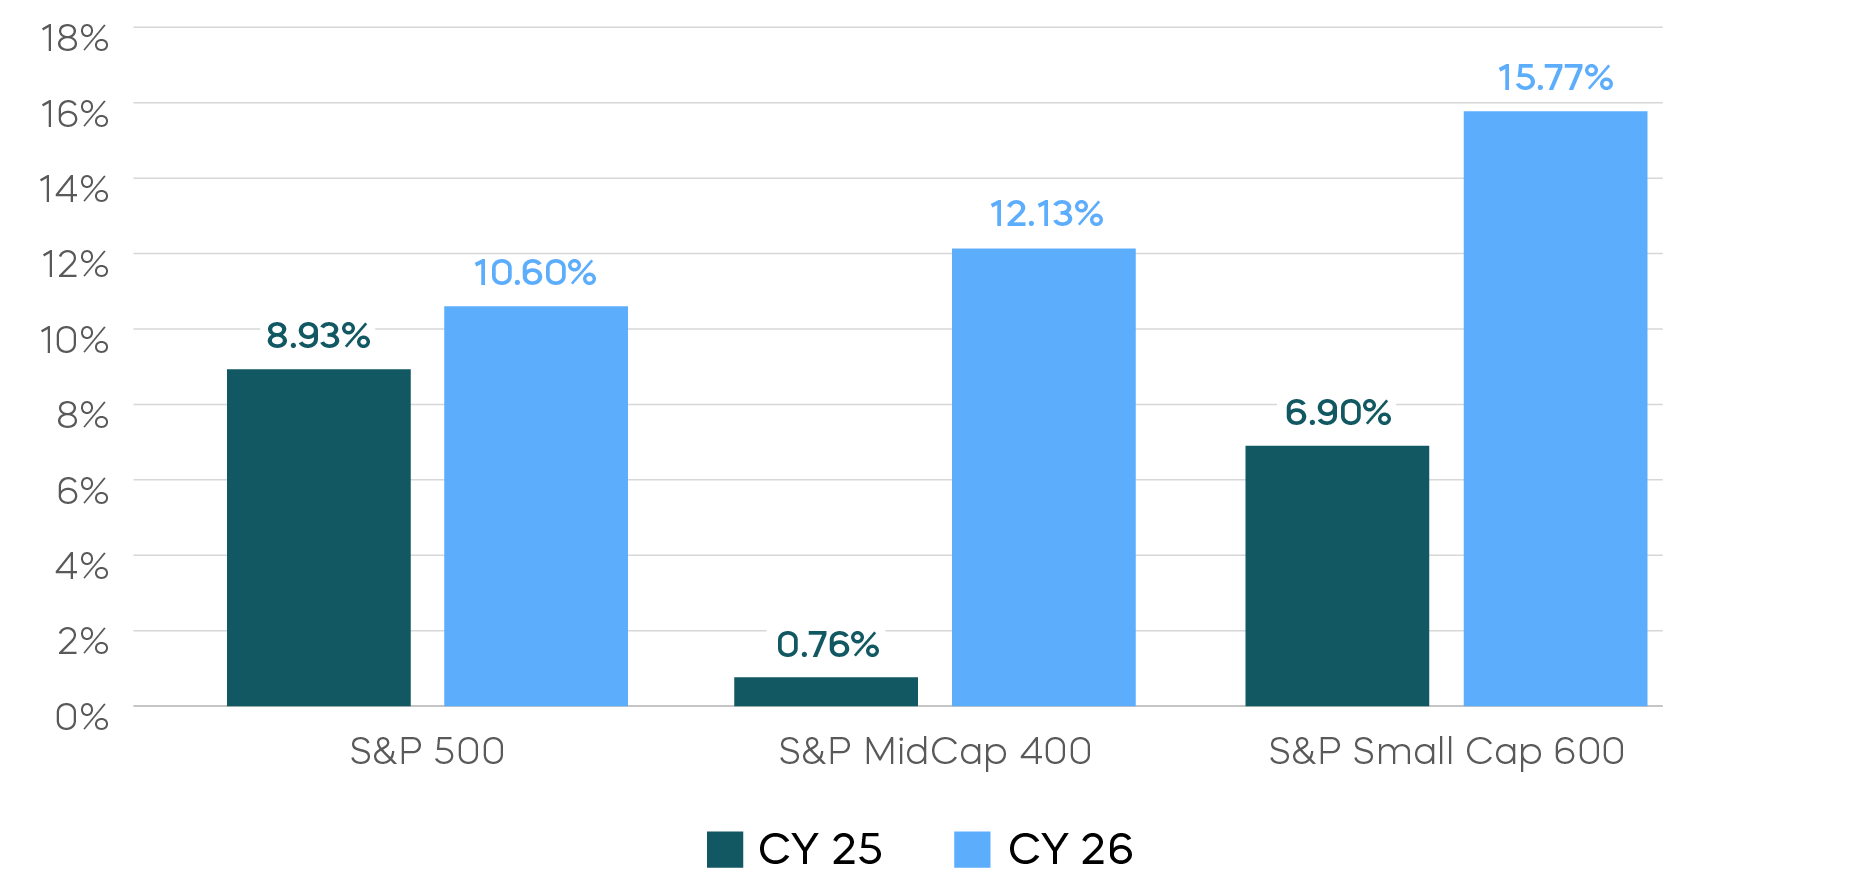 Source: FactSet. Data as of 7/2/25. Index returns are for illustrative purposes only and do not reflect any management fees, transaction costs or expenses. Indexes are unmanaged, and one cannot invest directly in an index. Past performance does not guarantee future results.
Investors Have New Strategies to Remain Nimble
The word uncertainty is frequently used to describe the current state of the equity markets. We don’t disagree. While we remain optimistic for continued equity strength in the second half of 2025, the reality is that market drawdowns can and do occur on a regular basis. Since 1957, investors in the S&P 500 have experienced a 10% pullback, and three 5% pullbacks every year, on average. Larger drawdowns of at least 15% happen about once every other year, and bear-market drawdowns of at least 20% happen every five years on average.
Frequency of S&P 500 Pullbacks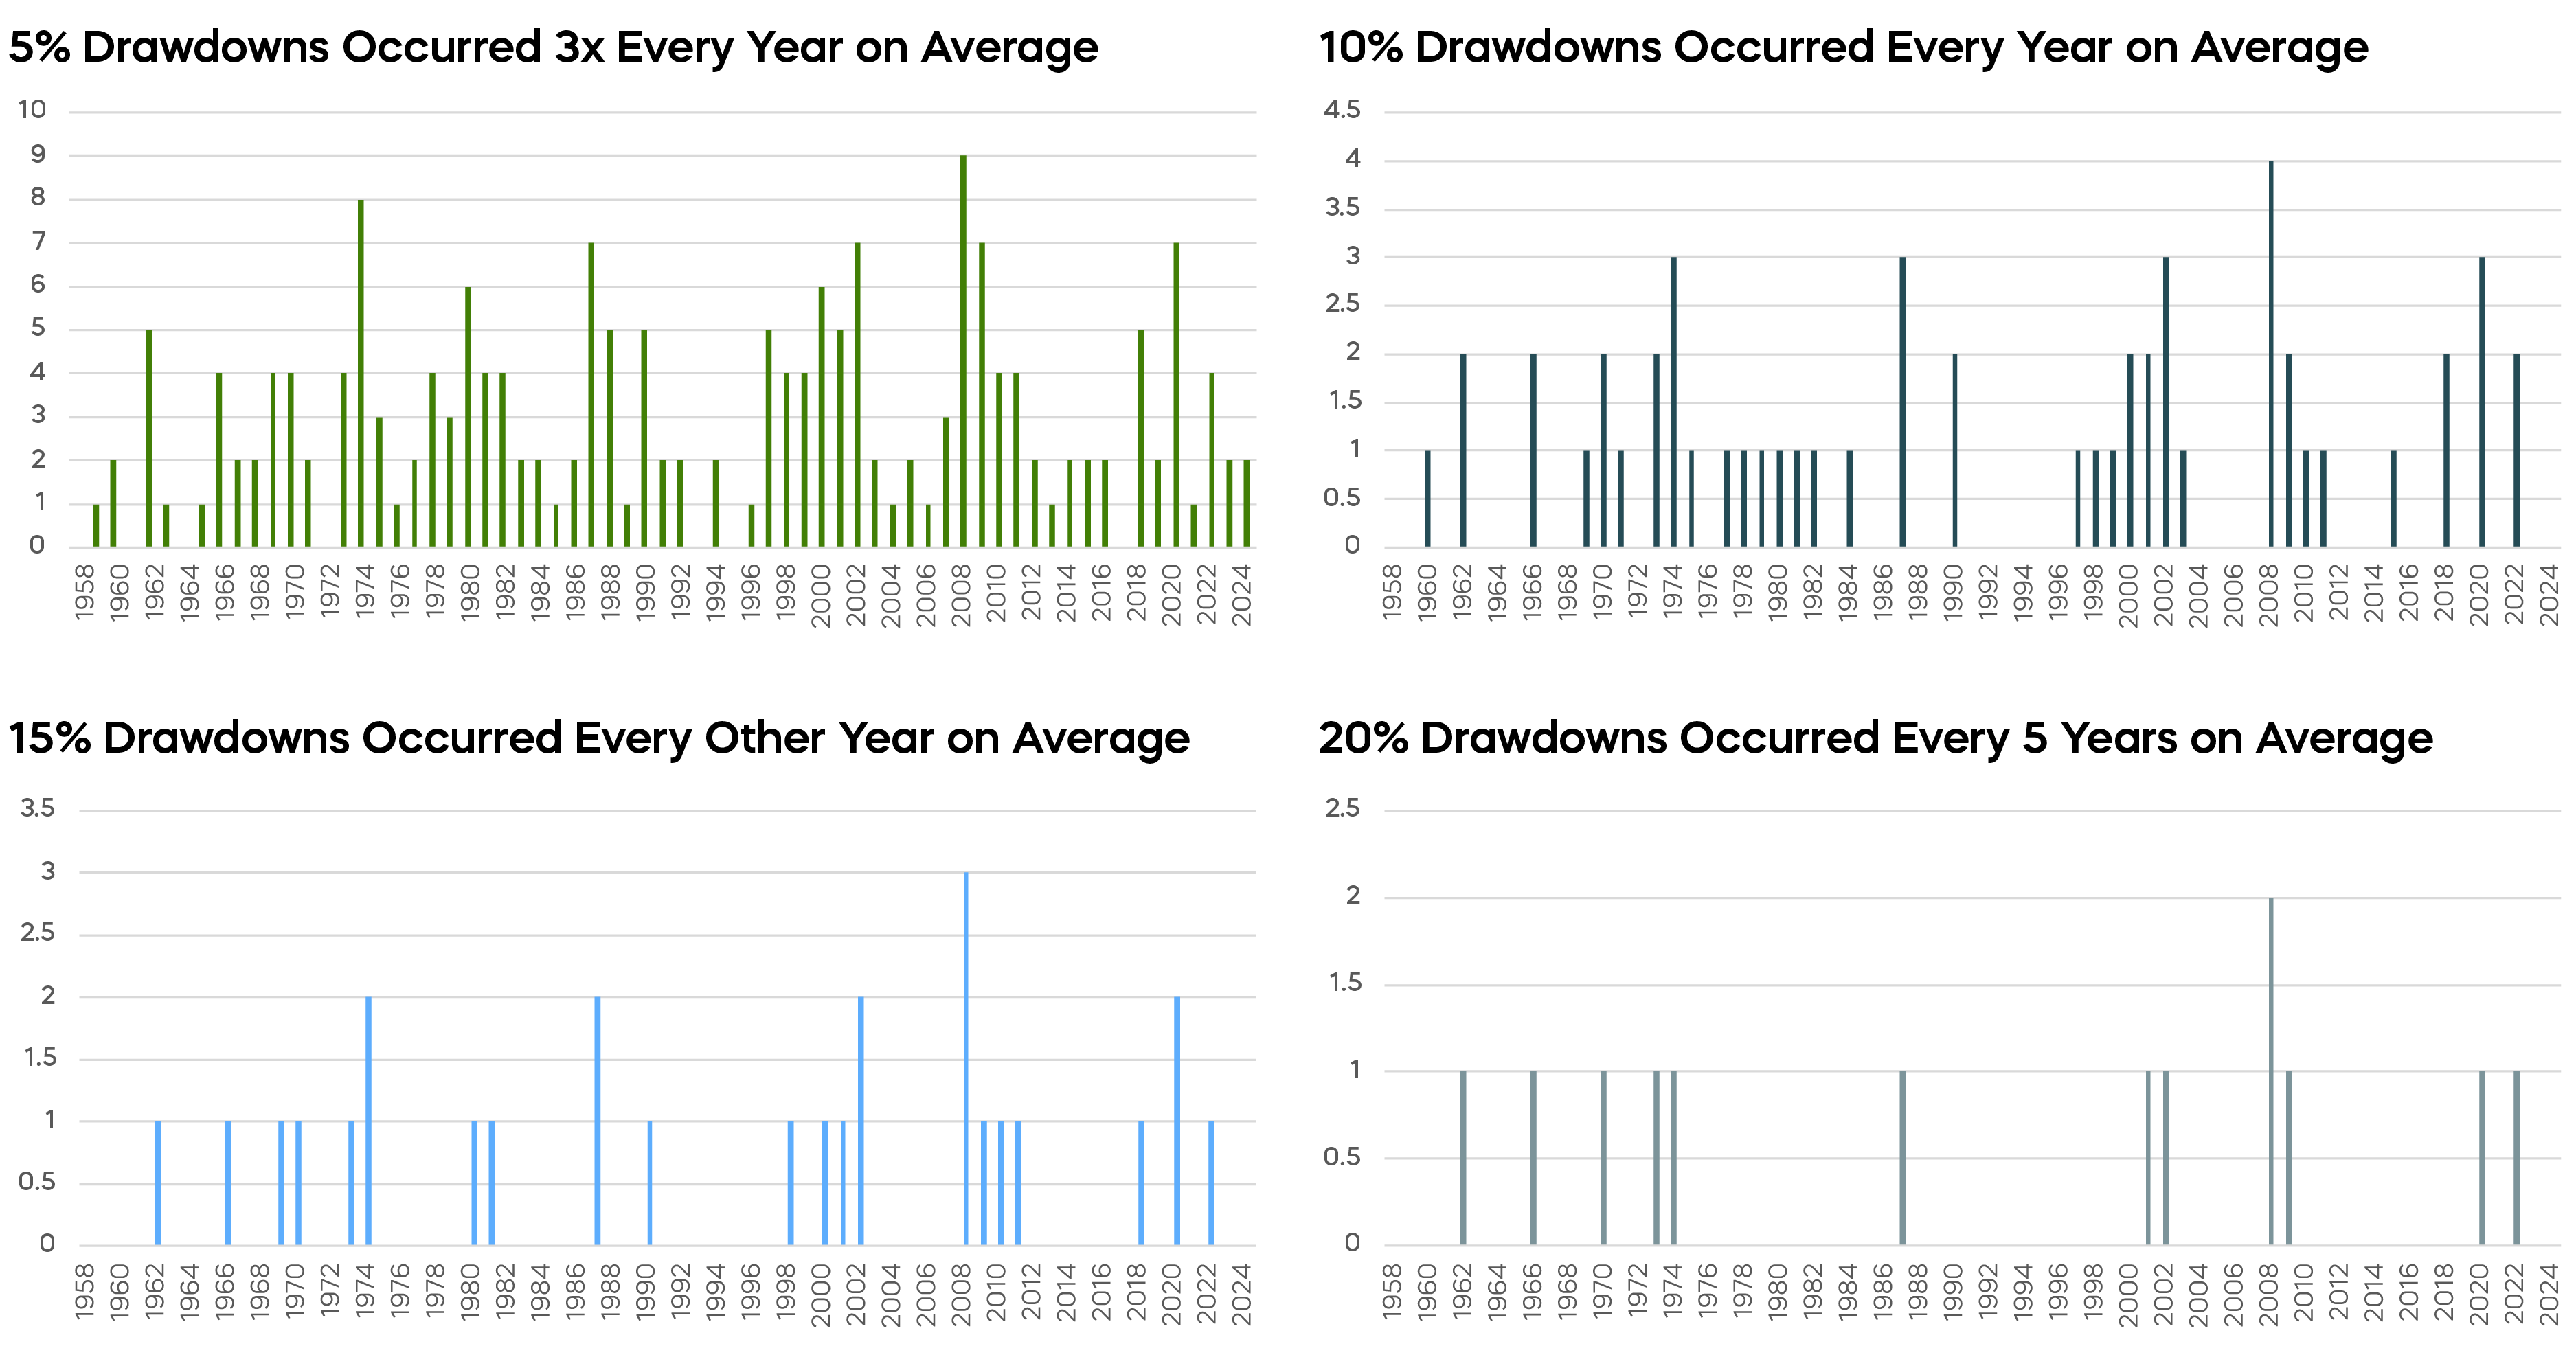 Source: Bloomberg. Data from 1957-2025. Index returns are for illustrative purposes only and do not reflect any management fees, transaction costs or expenses. Indexes are unmanaged, and one cannot invest directly in an index. Past performance does not guarantee future results.
This is all to say that downside risk is something investors must manage on a regular basis. Unfortunately, however, simply weathering down market periods is not always an option, as some investors don’t have the necessary timelines required for their investments to recover before that money is needed. Sudden and sharp market recoveries, as happened after COVID, are actually relatively rare. More often, recoveries take time.
This is not to suggest investors should become overly defensive. Hedged equity and options-based buffer strategies have been useful tools for risk-aware investors to remain invested in the market, even though they have some notable limitations.
The recently launched S&P 500 Daily Dynamic Buffer Index offers an evolution to those strategies designed to improve upon their limitations. It features a daily options strategy meant to capture gains on days the market rises, up to a cap, while targeting protection on days the market falls. The strategy is dynamic and designed to adapt to markets as they change by targeting more protection as expected volatility increases, enabling investors to potentially capture continued equity strength while still managing downside risk.
Fixed Income Perspectives
A Step Towards Fiscal Dominance
As of the end of June, the 30-year Treasury yield stood at 4.77%, essentially unchanged from where it began the year.[6] However, this apparent stability masks a series of developments over the past six months that could shape the path of yields going forward.
Policy uncertainty surrounding trade and immigration has continued to surprise markets, often exceeding expectations. And fiscal stimulus, particularly in the form of tax cuts, could more than offset any consumption drag from tariffs. Against this backdrop, investor concerns about the risk of fiscal dominance in the United States are becoming more pronounced.
While the Federal Reserve is weighing the possibility of resuming rate cuts in the second half of the year, the resulting market dynamics may differ from prior easing cycles. In the past, rate cuts typically led to a decline across the yield curve. Today, however, long-term yields could stay elevated even as short-term yields fall.
The Federal Reserve’s Dilemma
Investors often hear the advice to “see the forest through the trees,” emphasizing the importance of long-term perspective over short-term noise. Yet today, long-run policy orientation—the forest itself—keeps shifting. Even after several walk-backs of previously announced trade and immigration policies, the policy uncertainty index remains high. The threat of renewed escalation lingers, reinforcing the idea that persistent policy volatility may remain a defining feature of the current environment.
One recent example is the market reaction following the “Liberation Day” tariff announcement. Since then, the effective tariff rate has been revised several times across economists’ models. A more grounded approach could be to evaluate tariffs ex post by measuring collected tariff revenues as a share of the goods trade deficit. By that metric, the effective rate currently falls below 10%. Although this excludes potential Section 232 tariffs, it demonstrates the degree of difficulty in predicting how policies will impact the economy.
Tariff Revenue as a Percent of Goods Imports Lower than Initial Expectations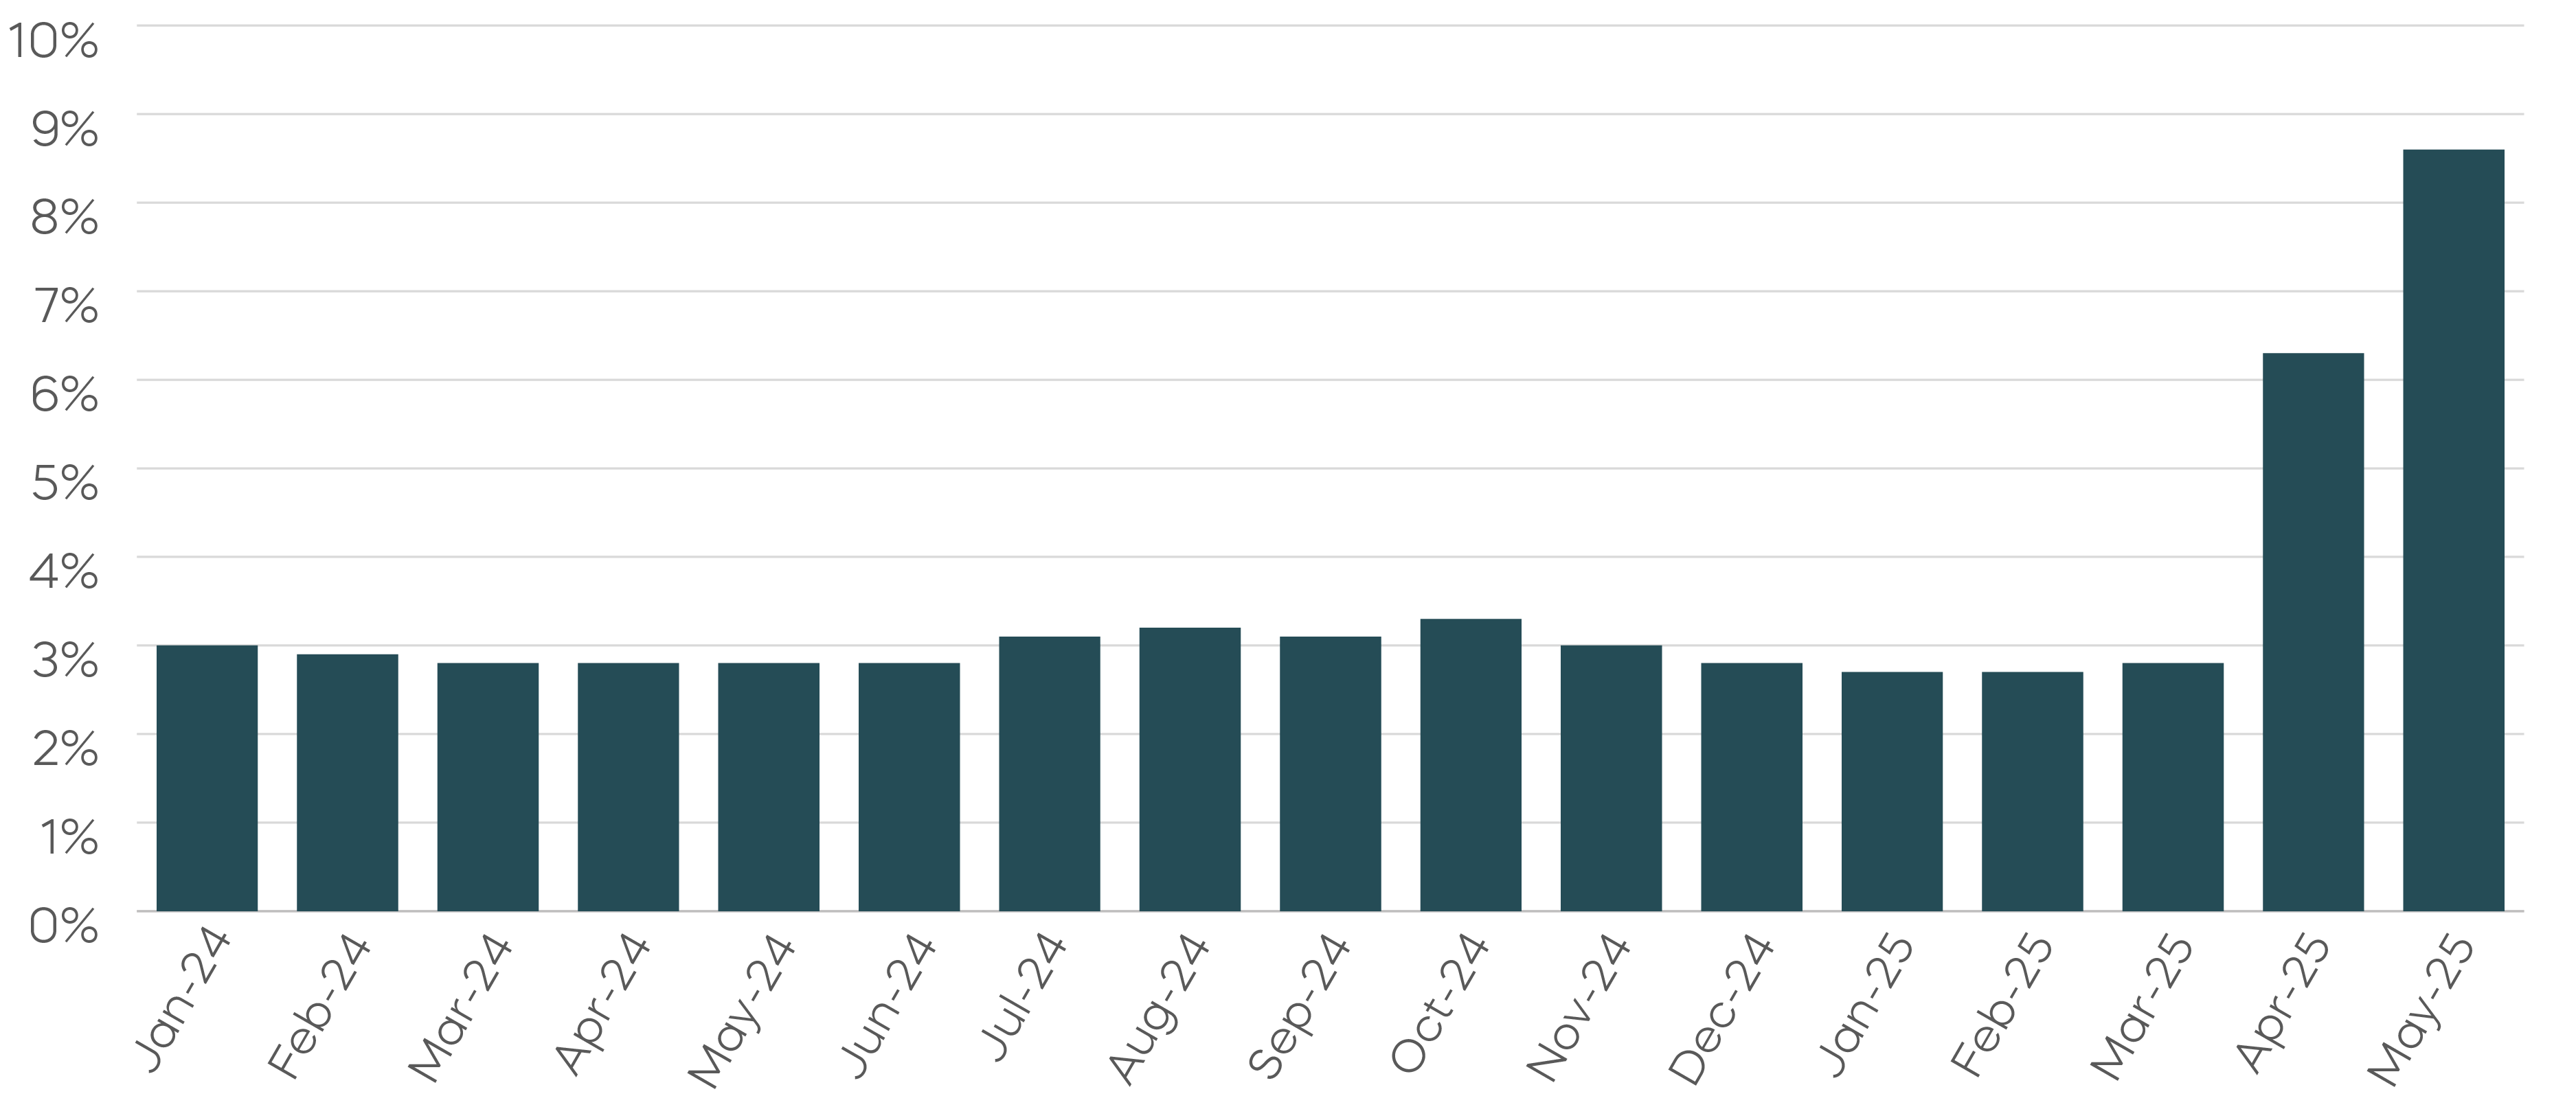
Source: Bureau of the Fiscal Service, Daily Treasury Statement. Bureau of Economic Analysis, U.S. International Trade in Goods and Services, May 2025.
The same policy volatility has complicated the Fed’s ability to implement monetary policy. For the Federal Reserve, data dependence has long been viewed as a way to balance credibility with flexibility. But in the current environment, it can also limit the Fed’s responsiveness. Policy volatility has made it difficult for the data to reflect the full scope of its potential impacts. At the same time, the Federal Reserve could face criticism for being politically motivated, whether they resume cutting soon or delay much further.
What Does the Data Say?
Leading up to the first rate cut last year, the labor market showed initial signs of slowing through a declining job opening rate. Since then, the Beveridge curve, which tracks the relationship between job openings and the unemployment rate, has stabilized.
Meanwhile, wage growth data points towards continued normalization. The Atlanta Fed’s wage tracker shows that pandemic-era trends, such as higher wage growth for low-skill jobs and a widening gap between job switchers and stayers, are fading. As these distortions dissipate, the labor market no longer seems to justify holding interest rates at restrictive levels.
Pandemic-Era Distortions in Wage Growth Are Dissipating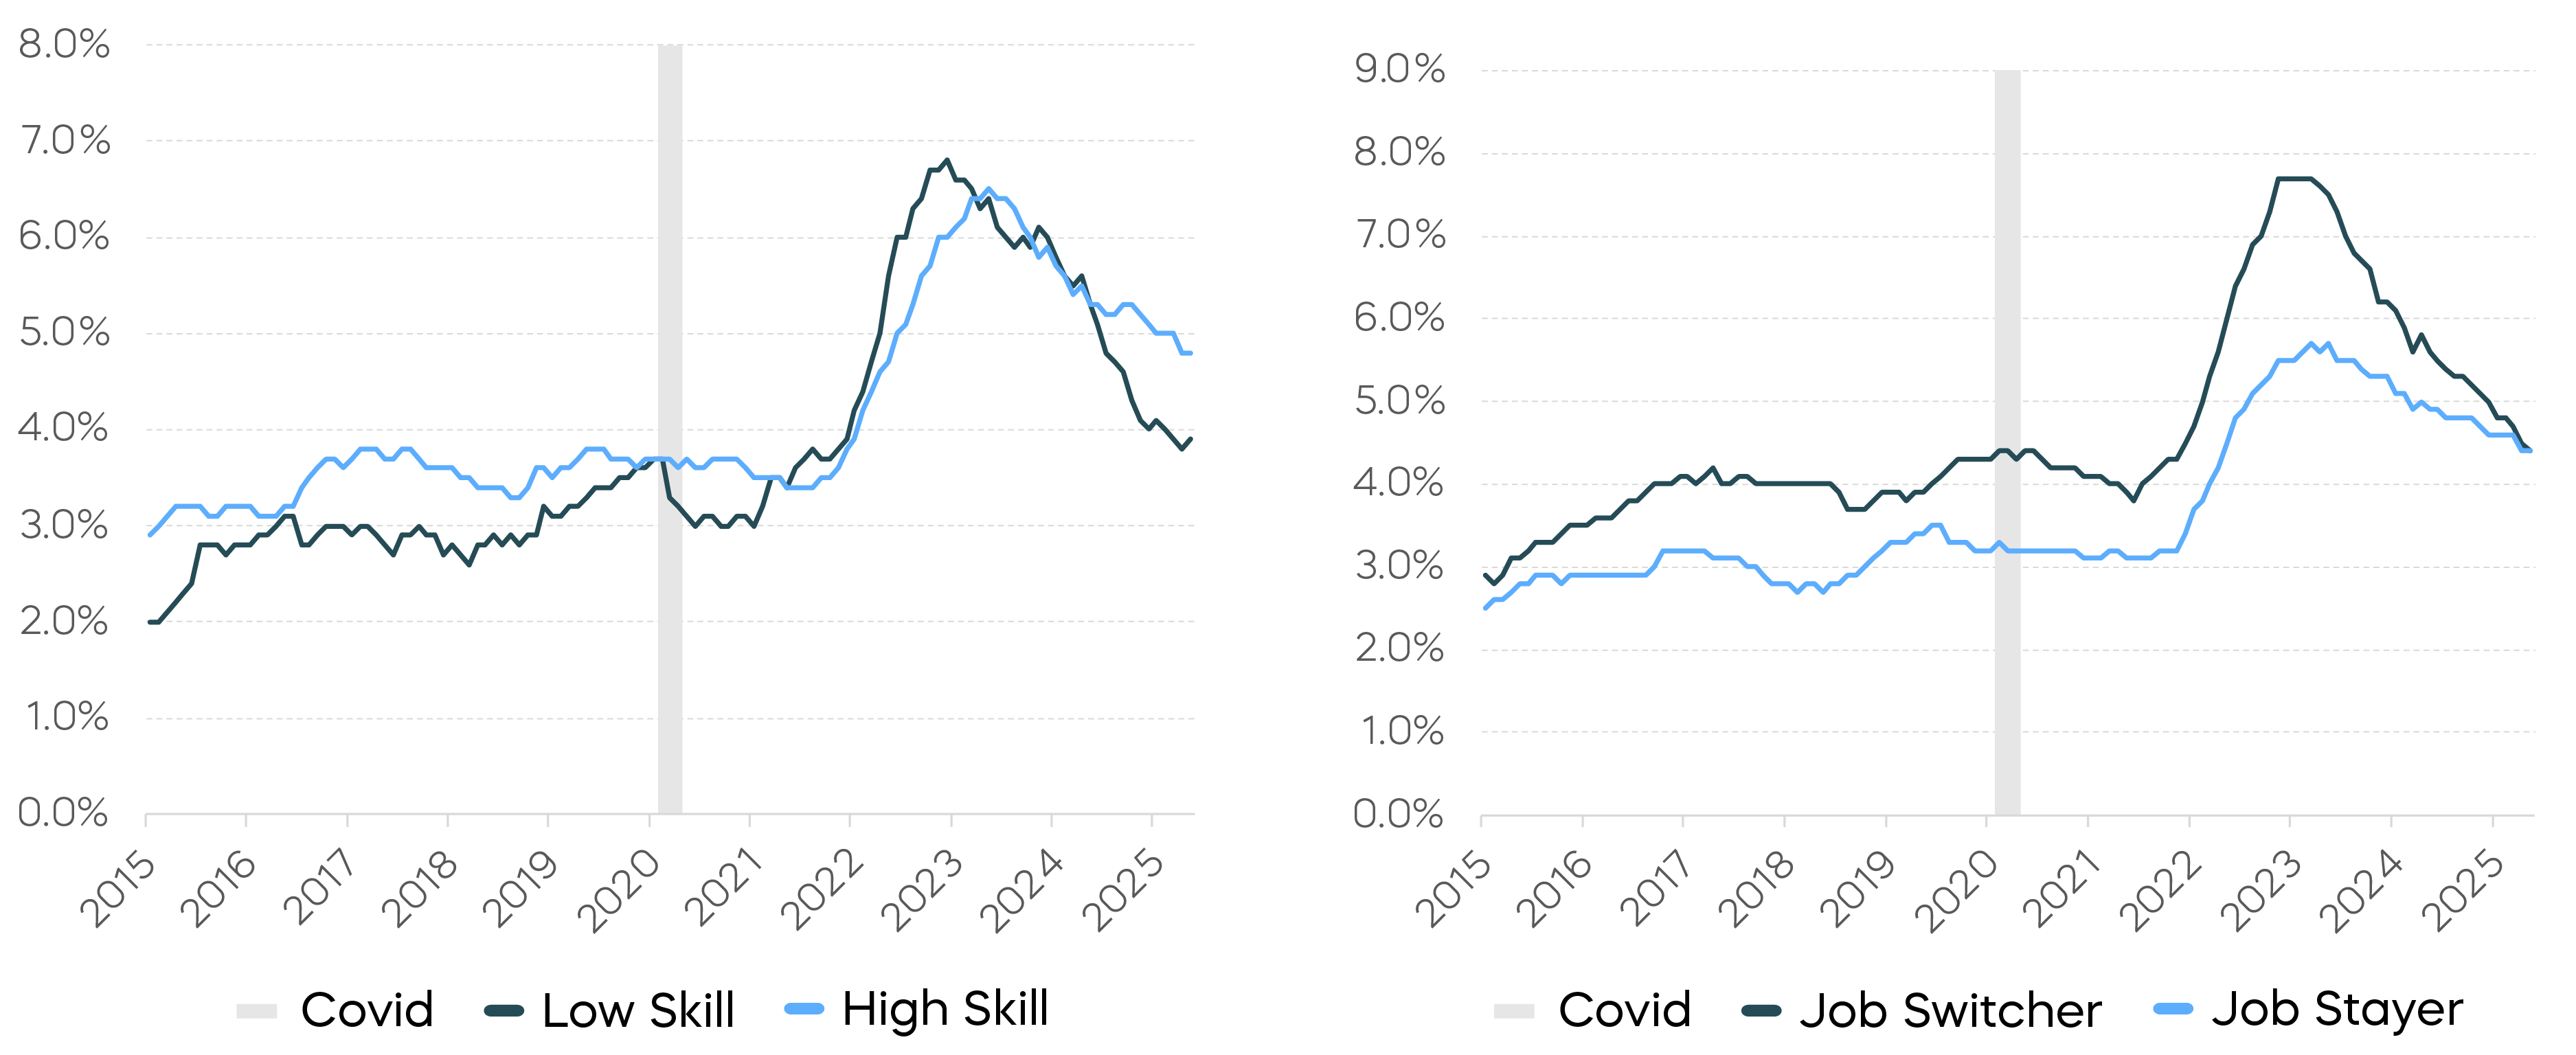 Source: Federal Reserve Bank of Atlanta, 12-month moving averages of monthly median wage growth, May 2025.
Inflation data, on the other hand, seems less supportive of rate cuts. Although headline inflation has moved closer to the Fed’s target, services inflation remains elevated, which may signal more persistent underlying trends. Furthermore, part of the recent improvement in inflation has come from flat goods prices. However, since the start of the year, the ISM Manufacturing Prices Paid Index has steadily increased, indicating real-time input cost pressures that could eventually feed into rising consumer prices.
Goods Prices May Slow Further Progress on Inflation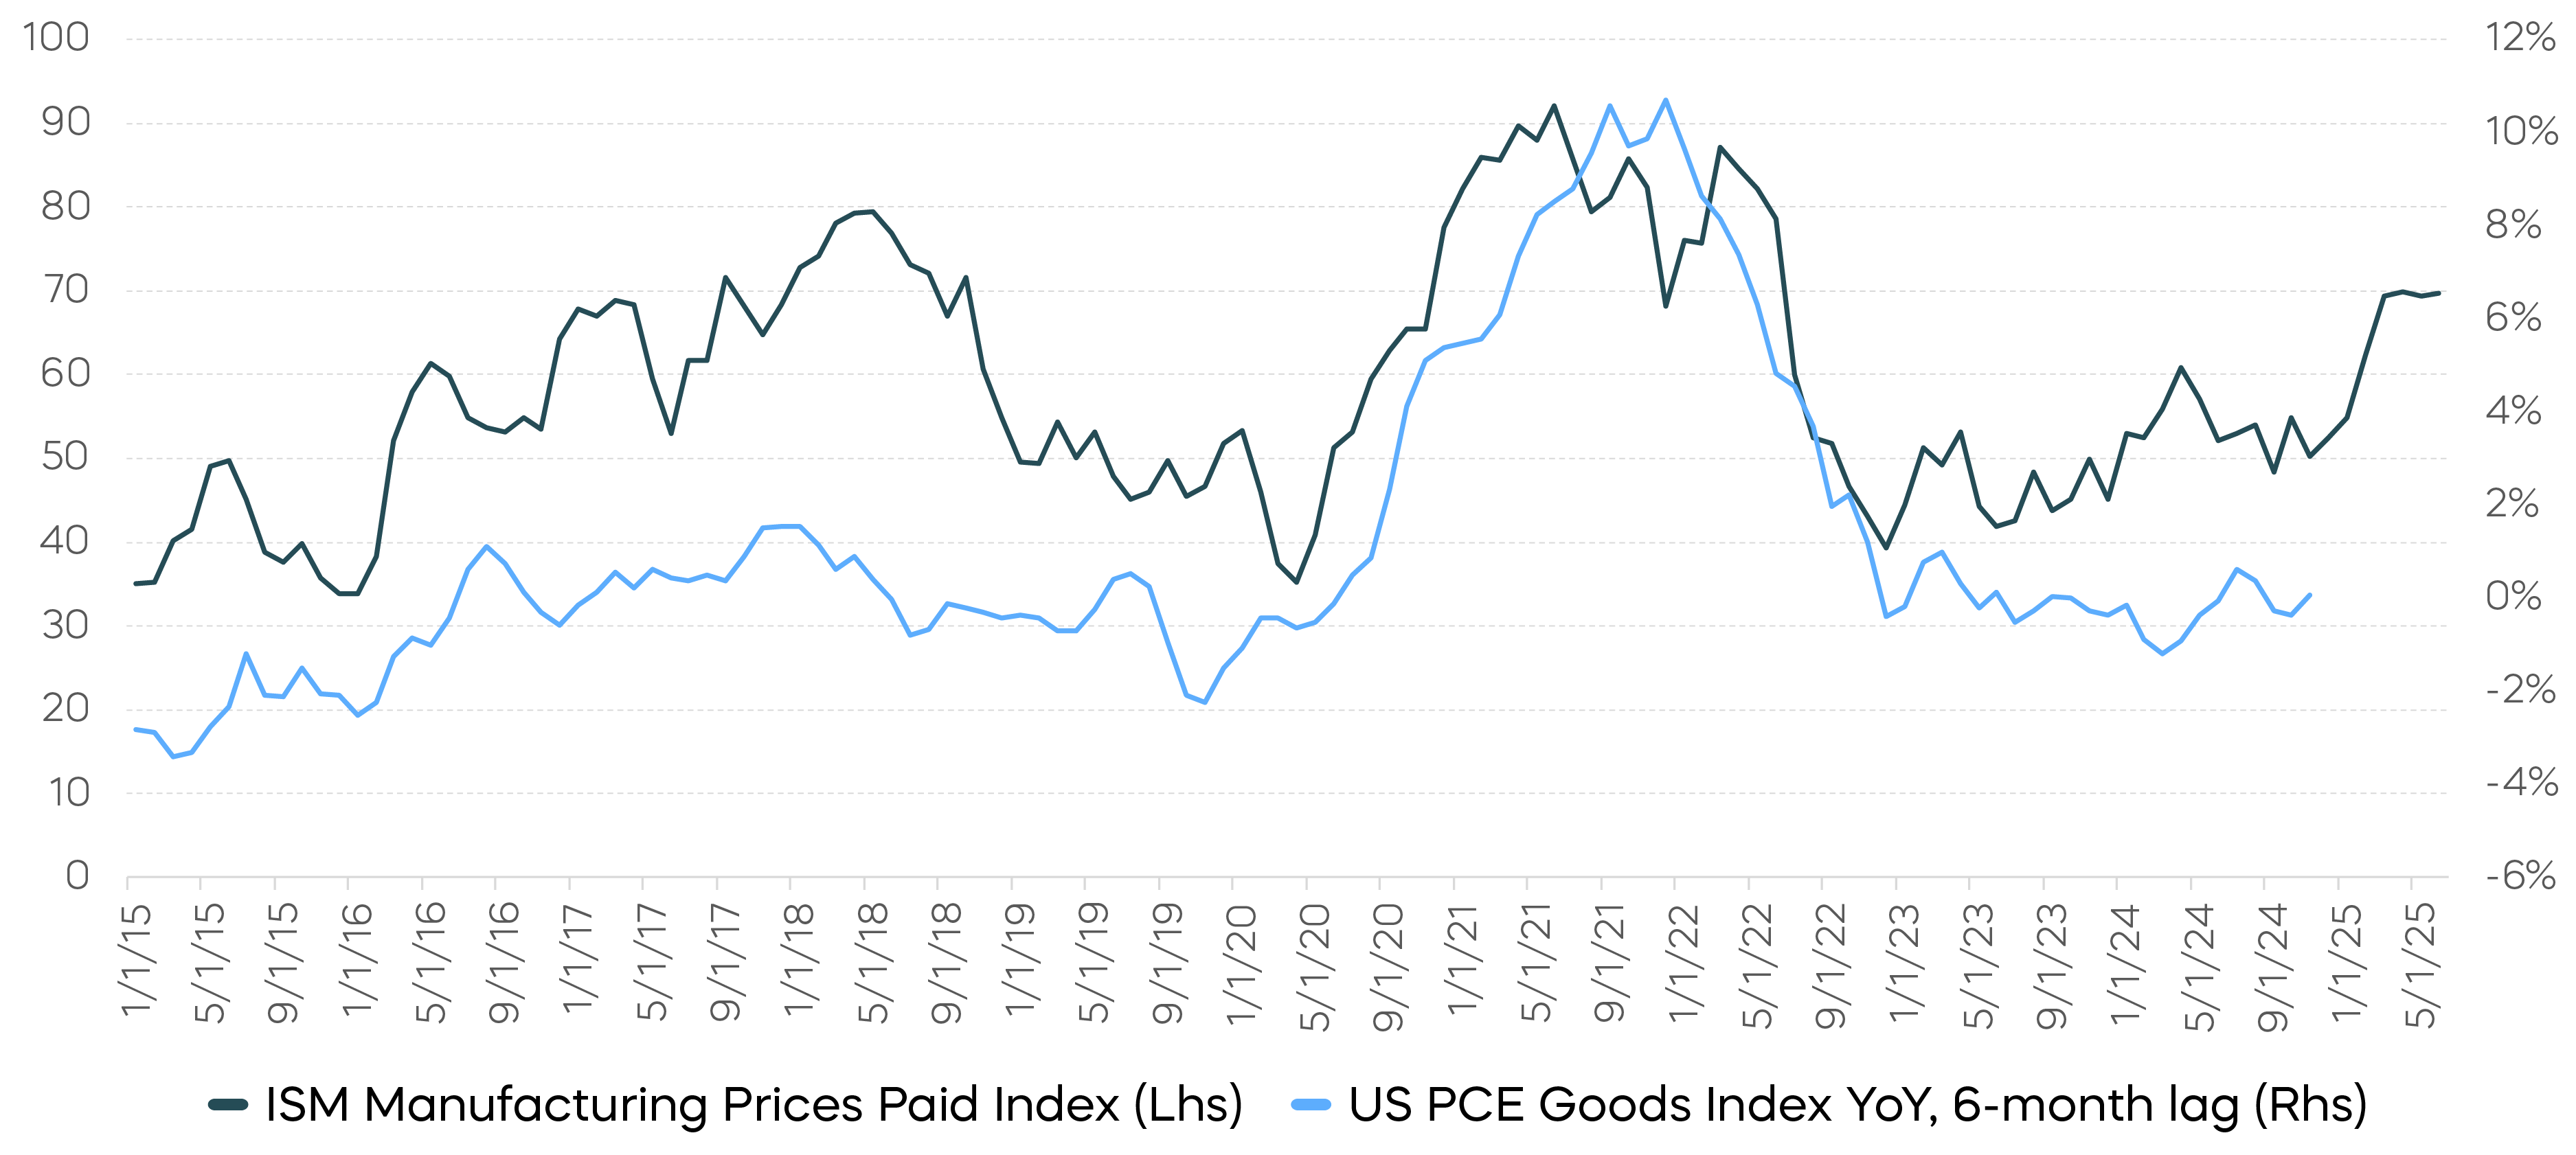 Source: Bureau of Economic Analysis, Personal Income and Outlays, May 2025. Institute for Supply Management, ISM Report on Business, June 2025.
Lastly, tariffs also pose an inflation risk. A New York Fed survey of business leaders in the New York and Northern New Jersey region found that many firms plan to pass on some or all of the tariff costs to customers. Both manufacturers and service firms reported that tariffs were increasing selling prices and hurting profit margins. While economic theory holds that a negative supply shock like tariffs should cause just a one-time increase in prices, the risk is that businesses begin to expect ongoing cost increases and adjust their pricing behavior accordingly. In that case, the Fed would be right to treat inflation risks as asymmetric.
Is It “Too Late” to Cut Rates?
Putting these trends together, the underlying economic picture may not be materially different from the start of the year, despite major shifts in policy headlines. The labor market has been moderating, and the case for restrictive interest rates has weakened. The Fed may need to resume rate cuts not to stimulate the economy but to return to a neutral stance. This aligns with the Fed’s own long-term policy rate projection, which has remained near 3% for over a year.
Any easing would most likely be reflected in the short end of the yield curve. In contrast, long-term yields may continue rising. Since the Treasury market volatility in April, there have been growing reasons for investors to demand a premium on long-duration debt. The recent passage of the One Big Beautiful Bill could deliver a fiscal stimulus that overwhelms any offset from tariff revenues. If the U.S. debt trajectory continues to deteriorate, long-term yields are likely to reflect those concerns.
This creates the potential for a regime shift toward fiscal dominance, in which rising government debt begins to constrain the Fed’s ability to control inflation. Several warning signs are emerging. These include the guidance of growing short-term debt issuance, despite the U.S. already having one of the shortest average maturities in the developed world and speculation that an ultra-dovish successor could replace Chair Powell. While policy makers have many tools at their disposal to directly influence interest rates, aggressive front-end cuts may offer short-term relief, but could come at the cost of long-term inflation or currency depreciation. Historical precedent suggests that a low policy rate relative to the Taylor rule leads to a steeper yield curve and an increased term premium.
Looking ahead, the yield curve may continue steepening as the U.S. confronts the realities of managing its increasing debt burden. This reinforces the idea that long-end rates could stay elevated or rise, even as short-end rates fall, posing challenges for portfolios holding significant duration at the long end of the yield curve.
Yield Curve Typically Steepens When Policy Rates Are Accommodative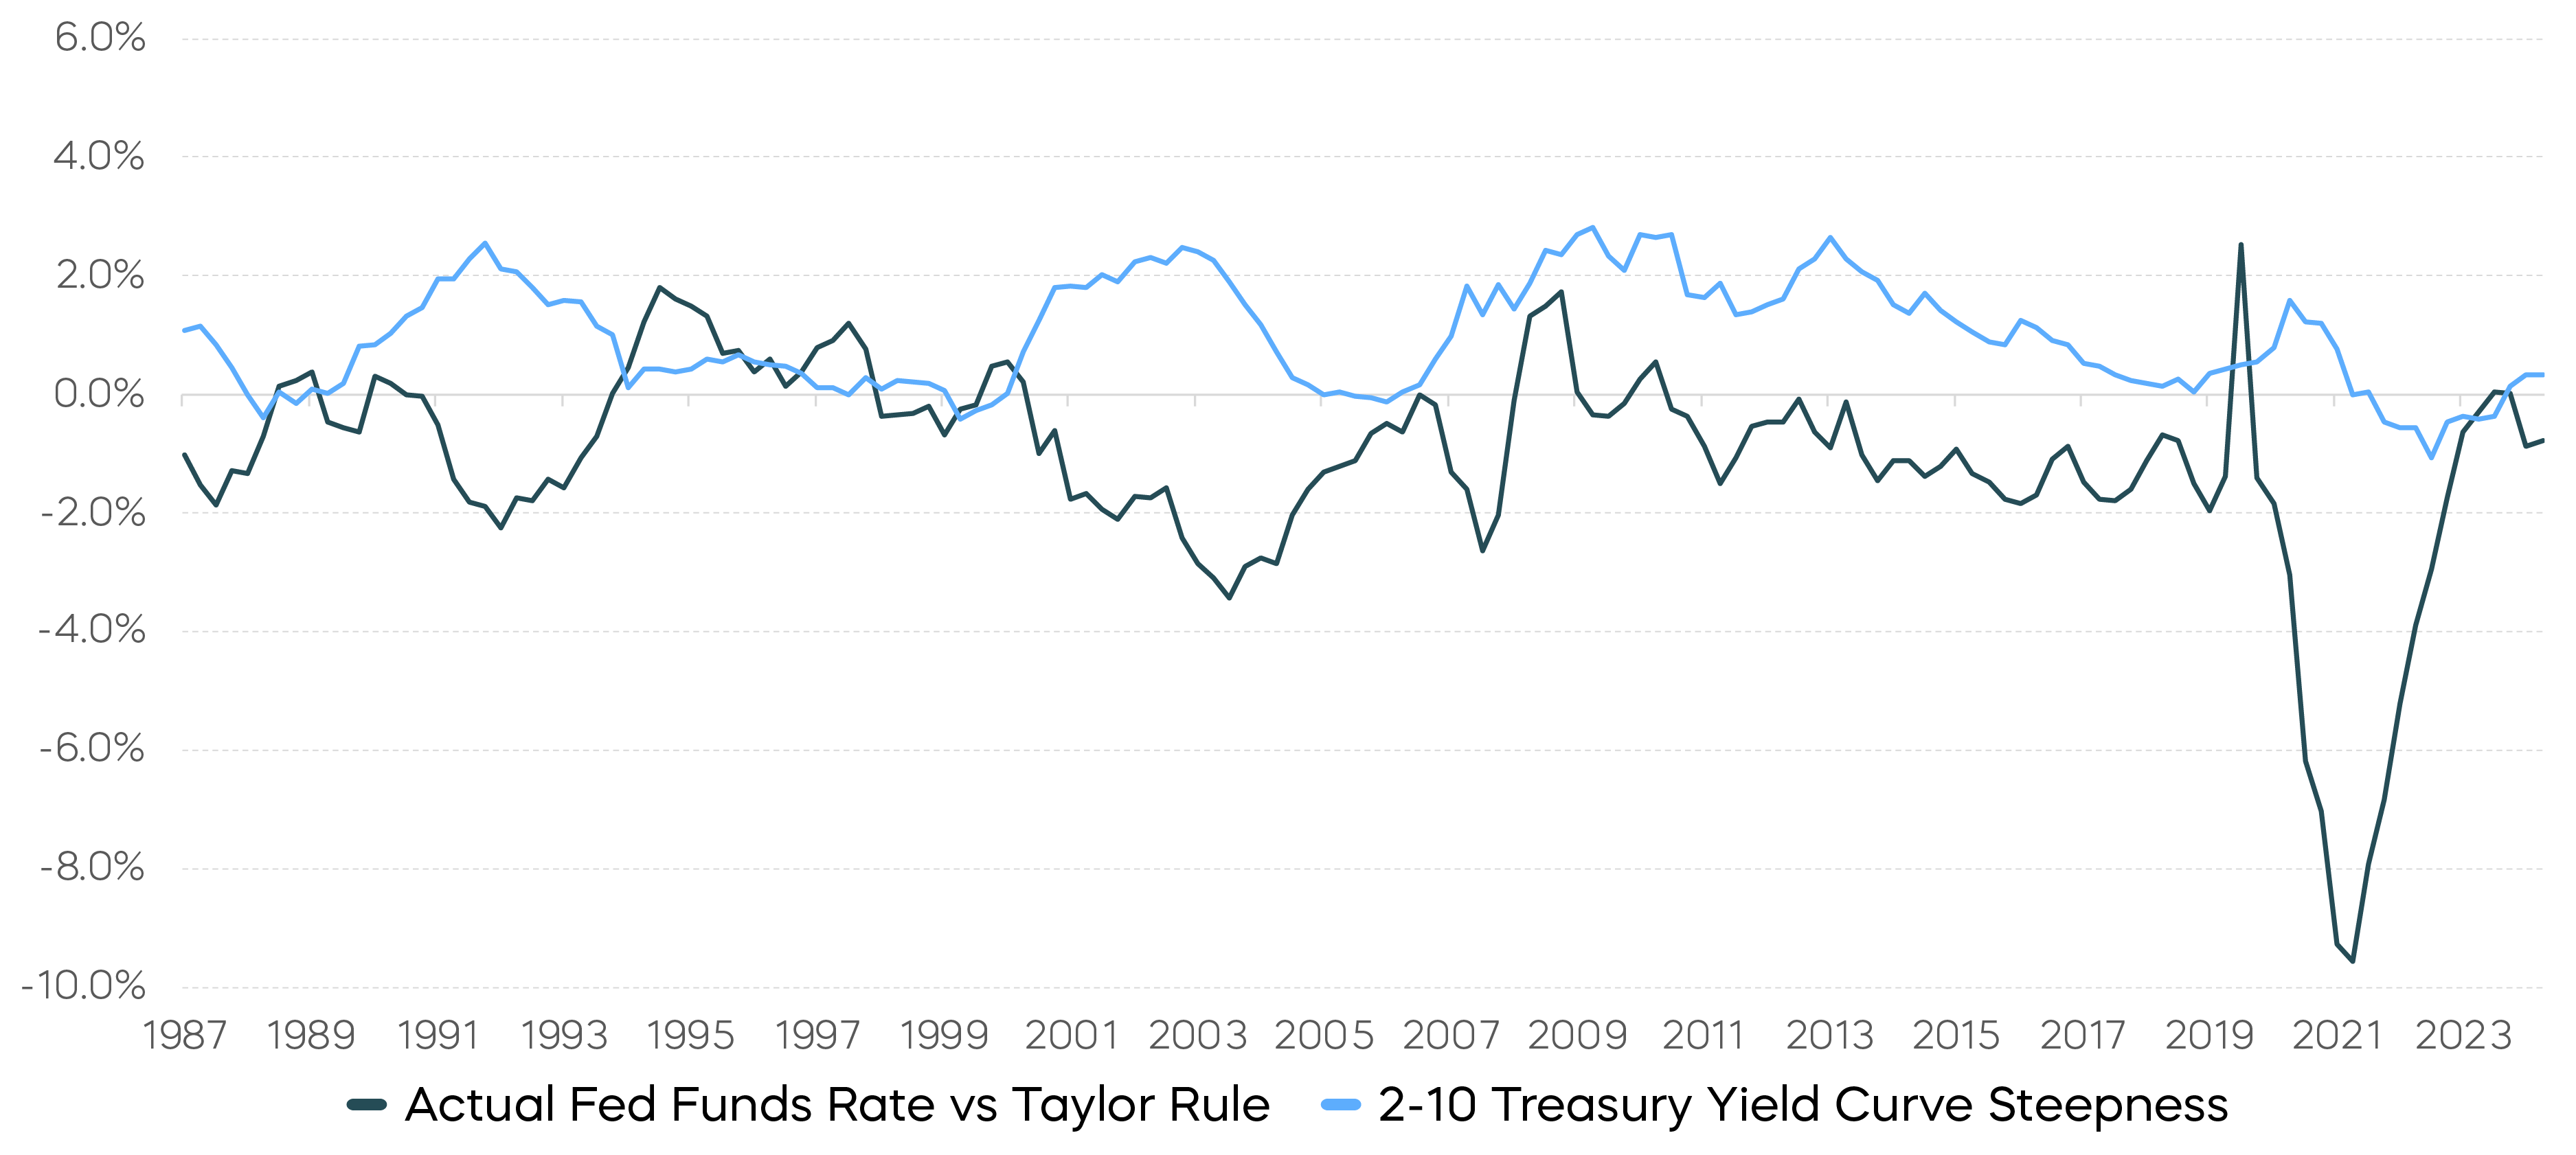 Source: Federal Reserve Bank of Atlanta, Taylor Rule using Laubach-Williams model 1-sided estimate and CBO real GDP gap. Bloomberg, Q1 2025.
[1] Source: Bloomberg. Data as of 7/1/25.
[2] Source: Bloomberg. Data from 2/9/1966–8/12/1982 and 9/1/2000–9/4/2012.
[3] Source: Bloomberg. Bloomberg U.S. Long Treasury Total Return Index Value Unhedged (LUTLTRUU) total returns 4/4/25–4/11/25.
[4] Source: Bloomberg. Data as of 6/30/25.
[5] Source: Standard & Poor’s and FactSet. Data 1/1/1950 through 6/30/2025.
[6] Source: Bloomberg. Data as of 7/1/25.
Sources for data and statistics: Bloomberg, FactSet, Morningstar, and ProShares.
The different market segments represented in the performance recap charts use the following indexes: U.S. Large Cap: S&P 500 TR; U.S. Large Cap Growth: S&P 500 Growth TR; U.S. Large Cap Value: S&P 500 Value TR; U.S. Mid Cap: S&P MidCap TR; U.S. Small Cap: Russell 2000 TR; International Developed Stocks: MSCI Daily TR NET EAFE; Emerging Markets Stocks: MSCI Daily TR Net Emerging Markets; Global Infrastructure: Dow Jones Brookfield Global Infrastructure Composite; Commodities: Bloomberg Commodity TR; U.S. Bonds: Bloomberg U.S. Aggregate; U.S. High Yield: Bloomberg Corporate High Yield; International Developed Bonds: Bloomberg Global Agg ex-USD; Emerging Market Bonds: DBIQ Emerging Markets USD Liquid Balanced.
The different market segments represented in the fixed income returns charts use the following indexes: Global Agg Bond Market: Bloomberg Global-Aggregate Total Return Index Value Unhedged USD; Mortgage Backed Securities: Bloomberg U.S. MBS Index Total Return Value Unhedged USD; Treasury Bonds: Bloomberg U.S. Treasury Total Return Unhedged USD; U.S. Agg Bond Market: Bloomberg U.S. Agg Total Return Value Unhedged USD; Corporate Bonds: Bloomberg US Corporate Total Return Value Unhedged USD; High Yield Bonds: Bloomberg U.S. Corporate High Yield Total Return Index Value Unhedged USD; Interest Rate-Hedged High Yield Bonds: FTSE High Yield (Treasury Rate-Hedged) Index; Treasury Inflation Protected (TIPS): Bloomberg U.S. Treasury Inflation Notes TR Index Value Unhedged USD; Short term (1-3 Yr) High Yield: Bloomberg U.S. Corporate 0-3 Year Total Return Index Value Unhedged USD; Senior Loans: Morningstar LSTA U.S. Leveraged Loan 100 Index; Short term (1-3 Yr) Corp Bonds: Bloomberg U.S. Corporate 1-3 Yr Total Return Index Value Unhedged USD; Floating Rate: Bloomberg U.S. FRN < 5 yrs Total Return Index Value Unhedged USD; Interest Rate-Hedged Corporate Bonds: FTSE Corporate Investment Grade (Treasury Rate-Hedged) Index.
The S&P 500 is a benchmark index published by Standard & Poor's (S&P) representing 500 companies with large-cap market capitalizations. The S&P MidCap 400 is a benchmark index published by Standard & Poor's (S&P) representing 400 companies with mid-cap market capitalizations. The S&P SmallCap 600 is a benchmark index published by Standard & Poor's (S&P) that seeks to measure the small-cap segment of the U.S. equity market. The S&P 500 Daily Dynamic Buffer Index measures the performance of a long position in the S&P 500 (TR) along with three S&P 500 Weeklys Index options, consisting of a short call, a long put and a short put, one day from the maturity date. The Bloomberg U.S. Treasury: Long Index measures U.S. dollar-denominated, fixed-rate, nominal debt issued by the U.S. Treasury with 10 years or more to maturity. The ISM Manufacturing Prices Paid Index represents business sentiment regarding future inflation. A high reading is seen as positive for the USD, while a low reading is seen as negative.
This is not intended to be investment advice. Indexes are unmanaged, and one cannot invest directly in an index. Past performance does not guarantee future results.
Any forward-looking statements herein are based on expectations of ProShare Advisors LLC at this time. Whether or not actual results and developments will conform to ProShare Advisors LLC’s expectations and predictions, however, is subject to a number of risks and uncertainties, including general economic, market and business conditions; changes in laws or regulations or other actions made by governmental authorities or regulatory bodies; and other world economic and political developments. ProShare Advisors LLC undertakes no duty to update or revise any forward-looking statements, whether as a result of new information, future events or otherwise.
Investing involves risk, including the possible loss of principal. This information is not meant to be investment advice.
The “S&P 500®,” “S&P MidCap 400®,” “S&P SmallCap 600®,” and “S&P 500 Daily Dynamic Buffer Index” are products of S&P Dow Jones Indices LLC and its affiliates. "S&P®" is a registered trademark of Standard & Poor’s Financial Services LLC (“S&P”), and “Dow Jones®" is a registered trademark of Dow Jones Trademark Holdings LLC (“Dow Jones”) and they have been licensed for use by S&P Dow Jones Indices LLC and its affiliates. All have been licensed for use by ProShare Advisors LLC. ProShares ETFs based on these indexes are not sponsored, endorsed, sold or promoted by these entities or their affiliates, and they make no representation regarding the advisability of investing in ProShares ETFs. THESE ENTITIES AND THEIR AFFILIATES MAKE NO WARRANTIES AND BEAR NO LIABILITY WITH RESPECT TO PROSHARES.