Key Observations
As we write this, the market’s reaction to the government shutdown in the U.S. has been little more than a shoulder shrug. That would seem a rational response, particularly if this shutdown is short-lived. The U.S. dollar might be slightly more tarnished, but it’s been on a downward trend for some time. Gold and bitcoin might get a boost, but both have been on an upward trajectory for the last year as well. Any impact on corporate earnings would likely be limited too.
Interest rates, however, are more of a wild card. Federal furloughs, potential layoffs, and a temporary drop in government expenditures might reduce output. That could add to downward price pressures and perhaps cause a decline in U.S. Treasury yields. But just as the uncertainty and perceived dysfunction of a shutdown can tarnish the dollar, it can also prompt longer-term Treasury yields to rise if investors, perceiving extra risk, demand more yield.
Given the ambiguous impact of a shutdown on interest rates, and the likelihood that the shutdown will be short-lived, it may be more prudent to look toward the Federal Reserve and inflation for clues regarding the direction of interest rates. Among the most important points to remember is that longer-term interest rates do not necessarily follow the Fed, as the charts of the two most recent rate cutting cycles below show.
Charts of the Month
Source: Bloomberg, data from 9/16/25 through 9/30/25 and 9/17/24 through 12/19/24.
While it wasn’t much, the modest increase in longer-term Treasury yields after the latest Fed rate cut shouldn’t have been a surprise, since a 4% 10-year Treasury yield is consistent with 2% inflation, which has not yet been achieved. Even with one or two more 25 basis point cuts from the Fed in the near term, that 10-year Treasury yield may prove to be stubborn.
A stubborn 10-year Treasury yield places the focus for equities on earnings, particularly those of large-cap companies. It is extremely early in the Q3 earnings season, but results appear positive so far. And when you consider seasonality—equity gains traditionally continue through Q4 when the first nine months of the year have been strong—it’s difficult to argue against bullish sentiment and a risk-on approach.
Asset Class Perspectives
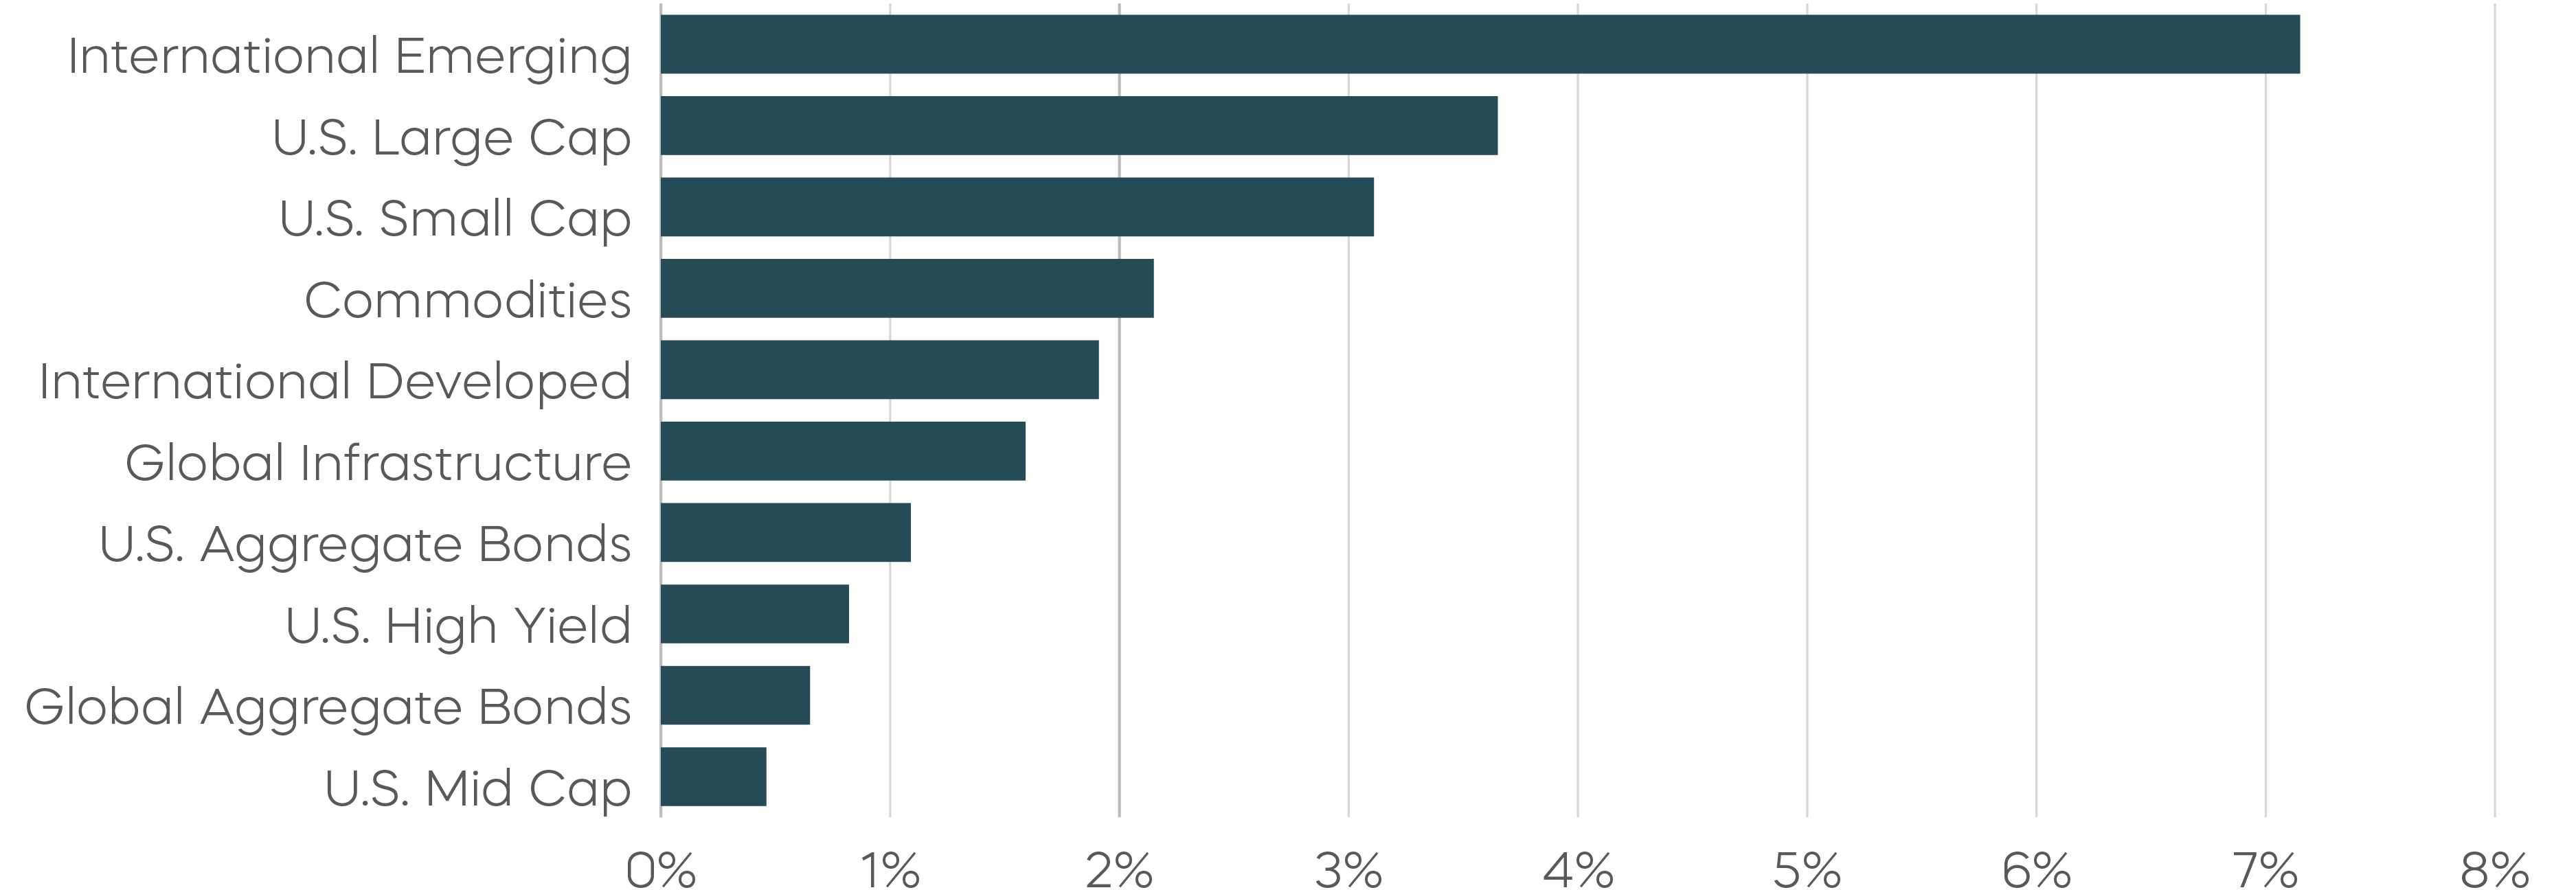
Asset Class Returns—September 2025
Asset Class Returns—Year-to-Date
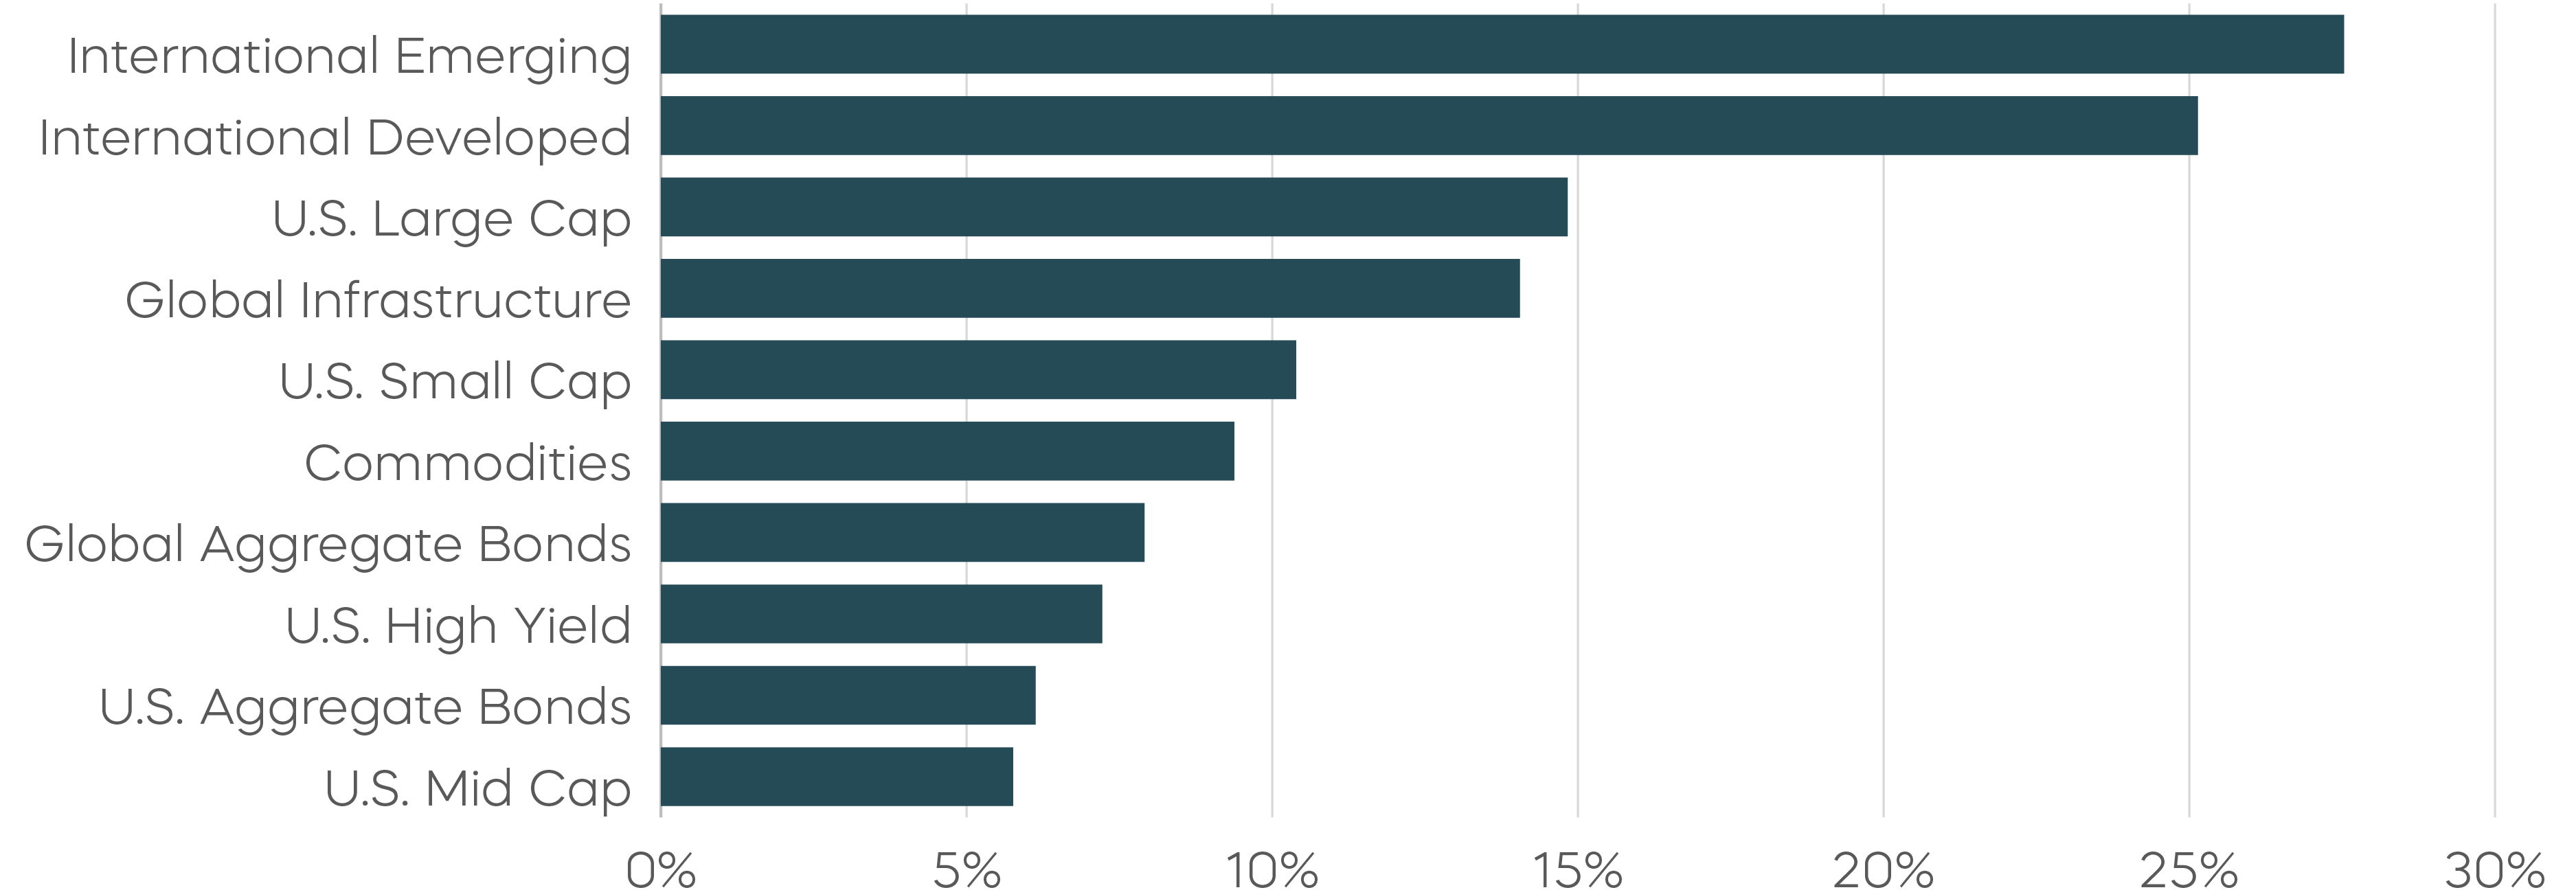
Source: Bloomberg. September returns 9/1/25–9/30/25; year-to-date returns 1/1/25‒9/30/25. Index returns are for illustrative purposes only and do not reflect any management fees, transaction costs or expenses. Indexes are unmanaged, and one cannot invest directly in an index. Past performance does not guarantee future results.
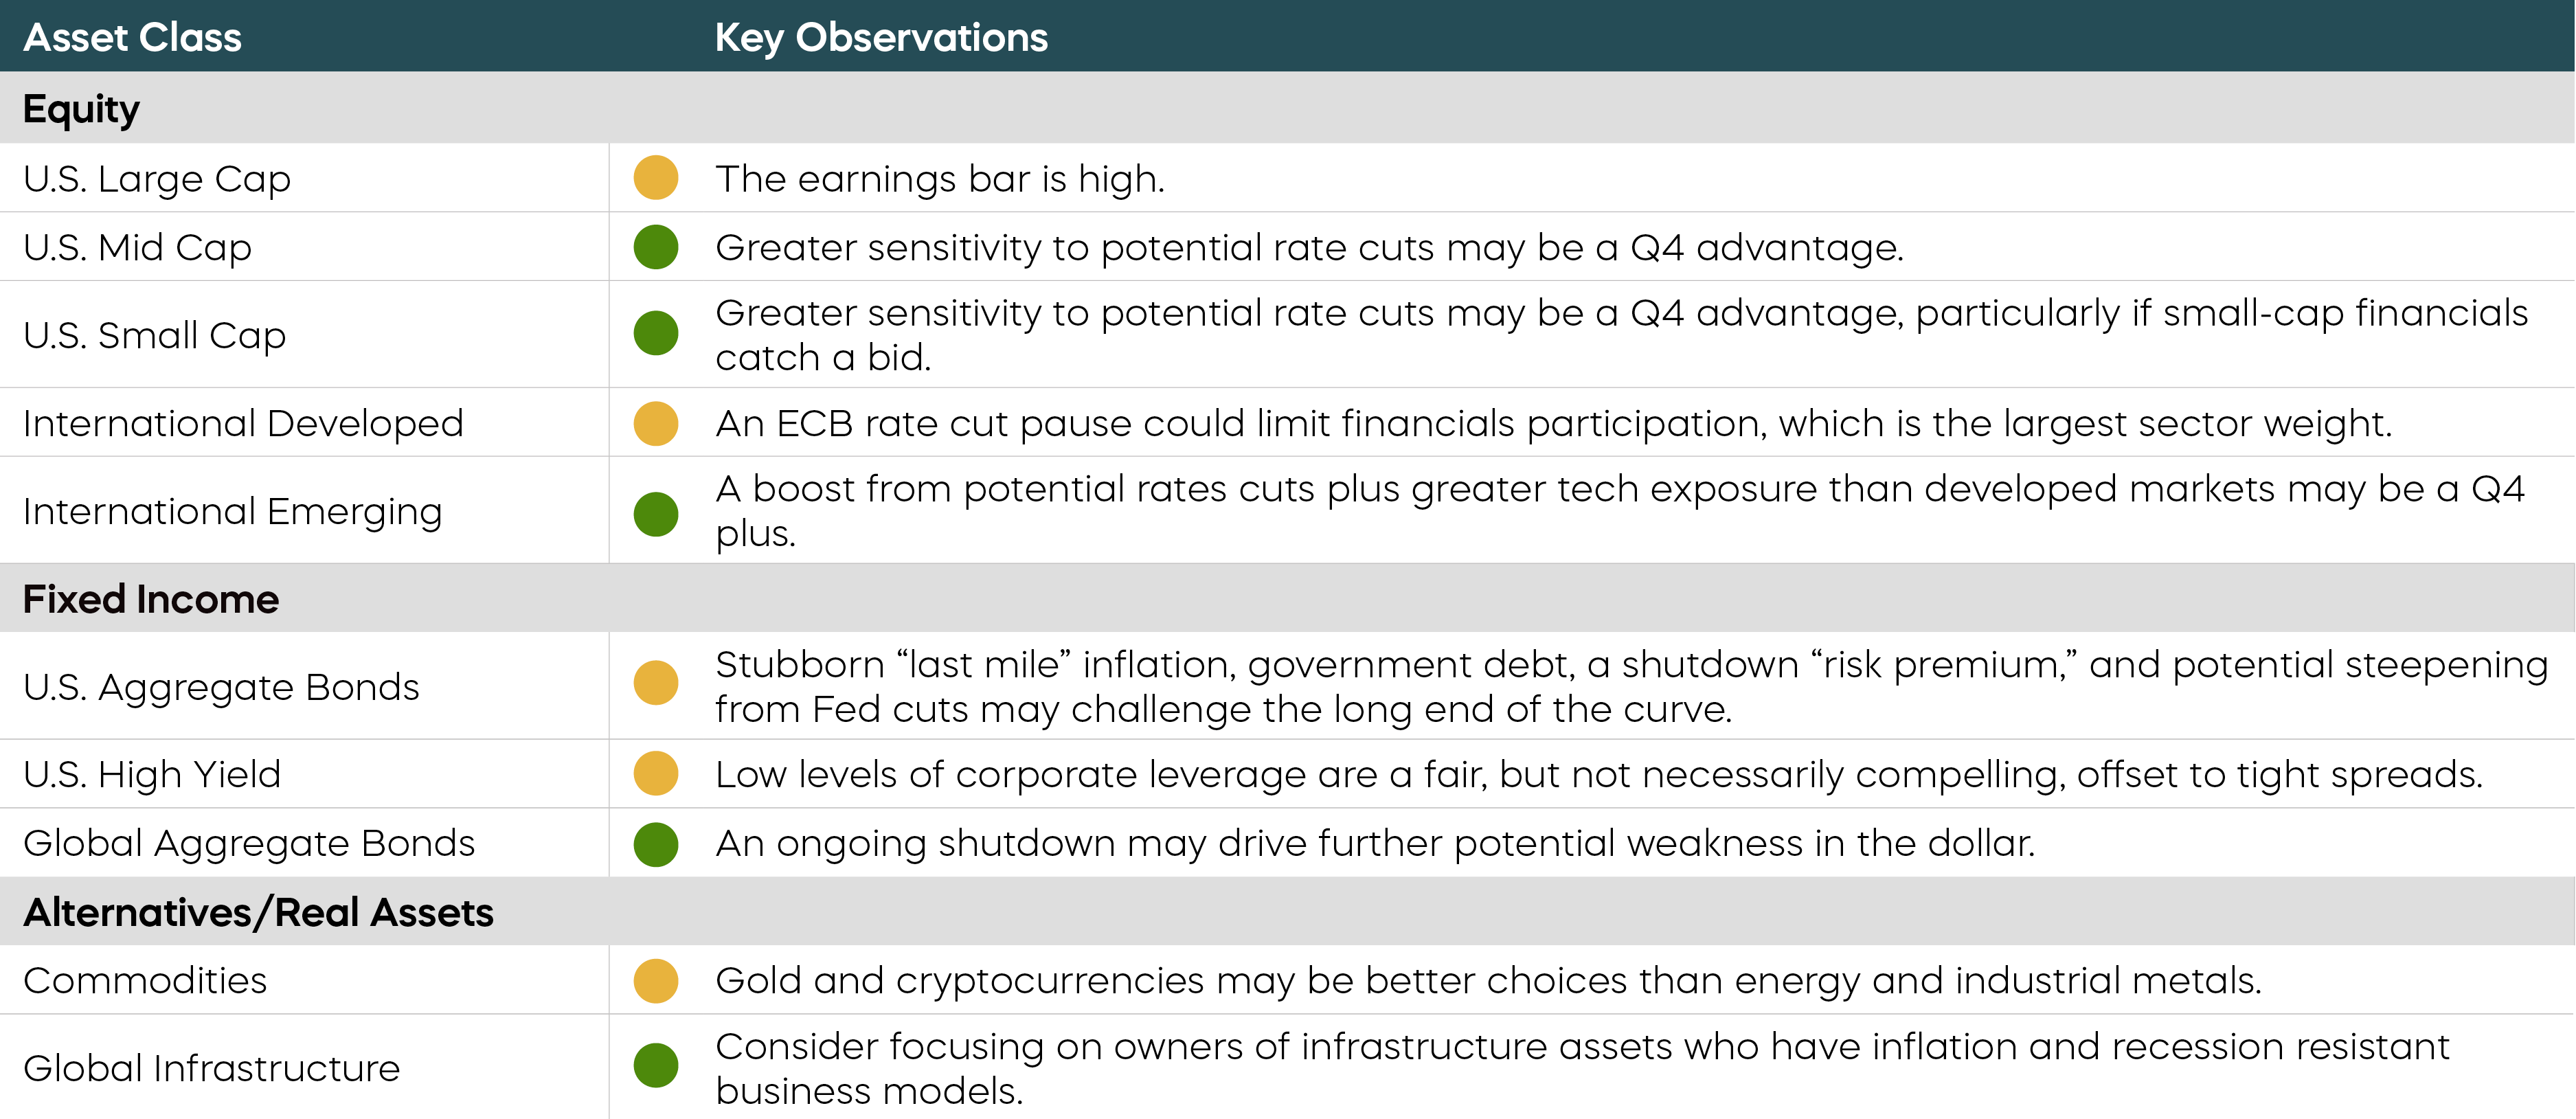
The following are observations on a range of asset classes. For each, green indicates a constructive backdrop, yellow indicates a neutral environment, and red would indicate a challenging backdrop.
Economic Calendar
U.S. government data releases below may be impacted by the government shutdown.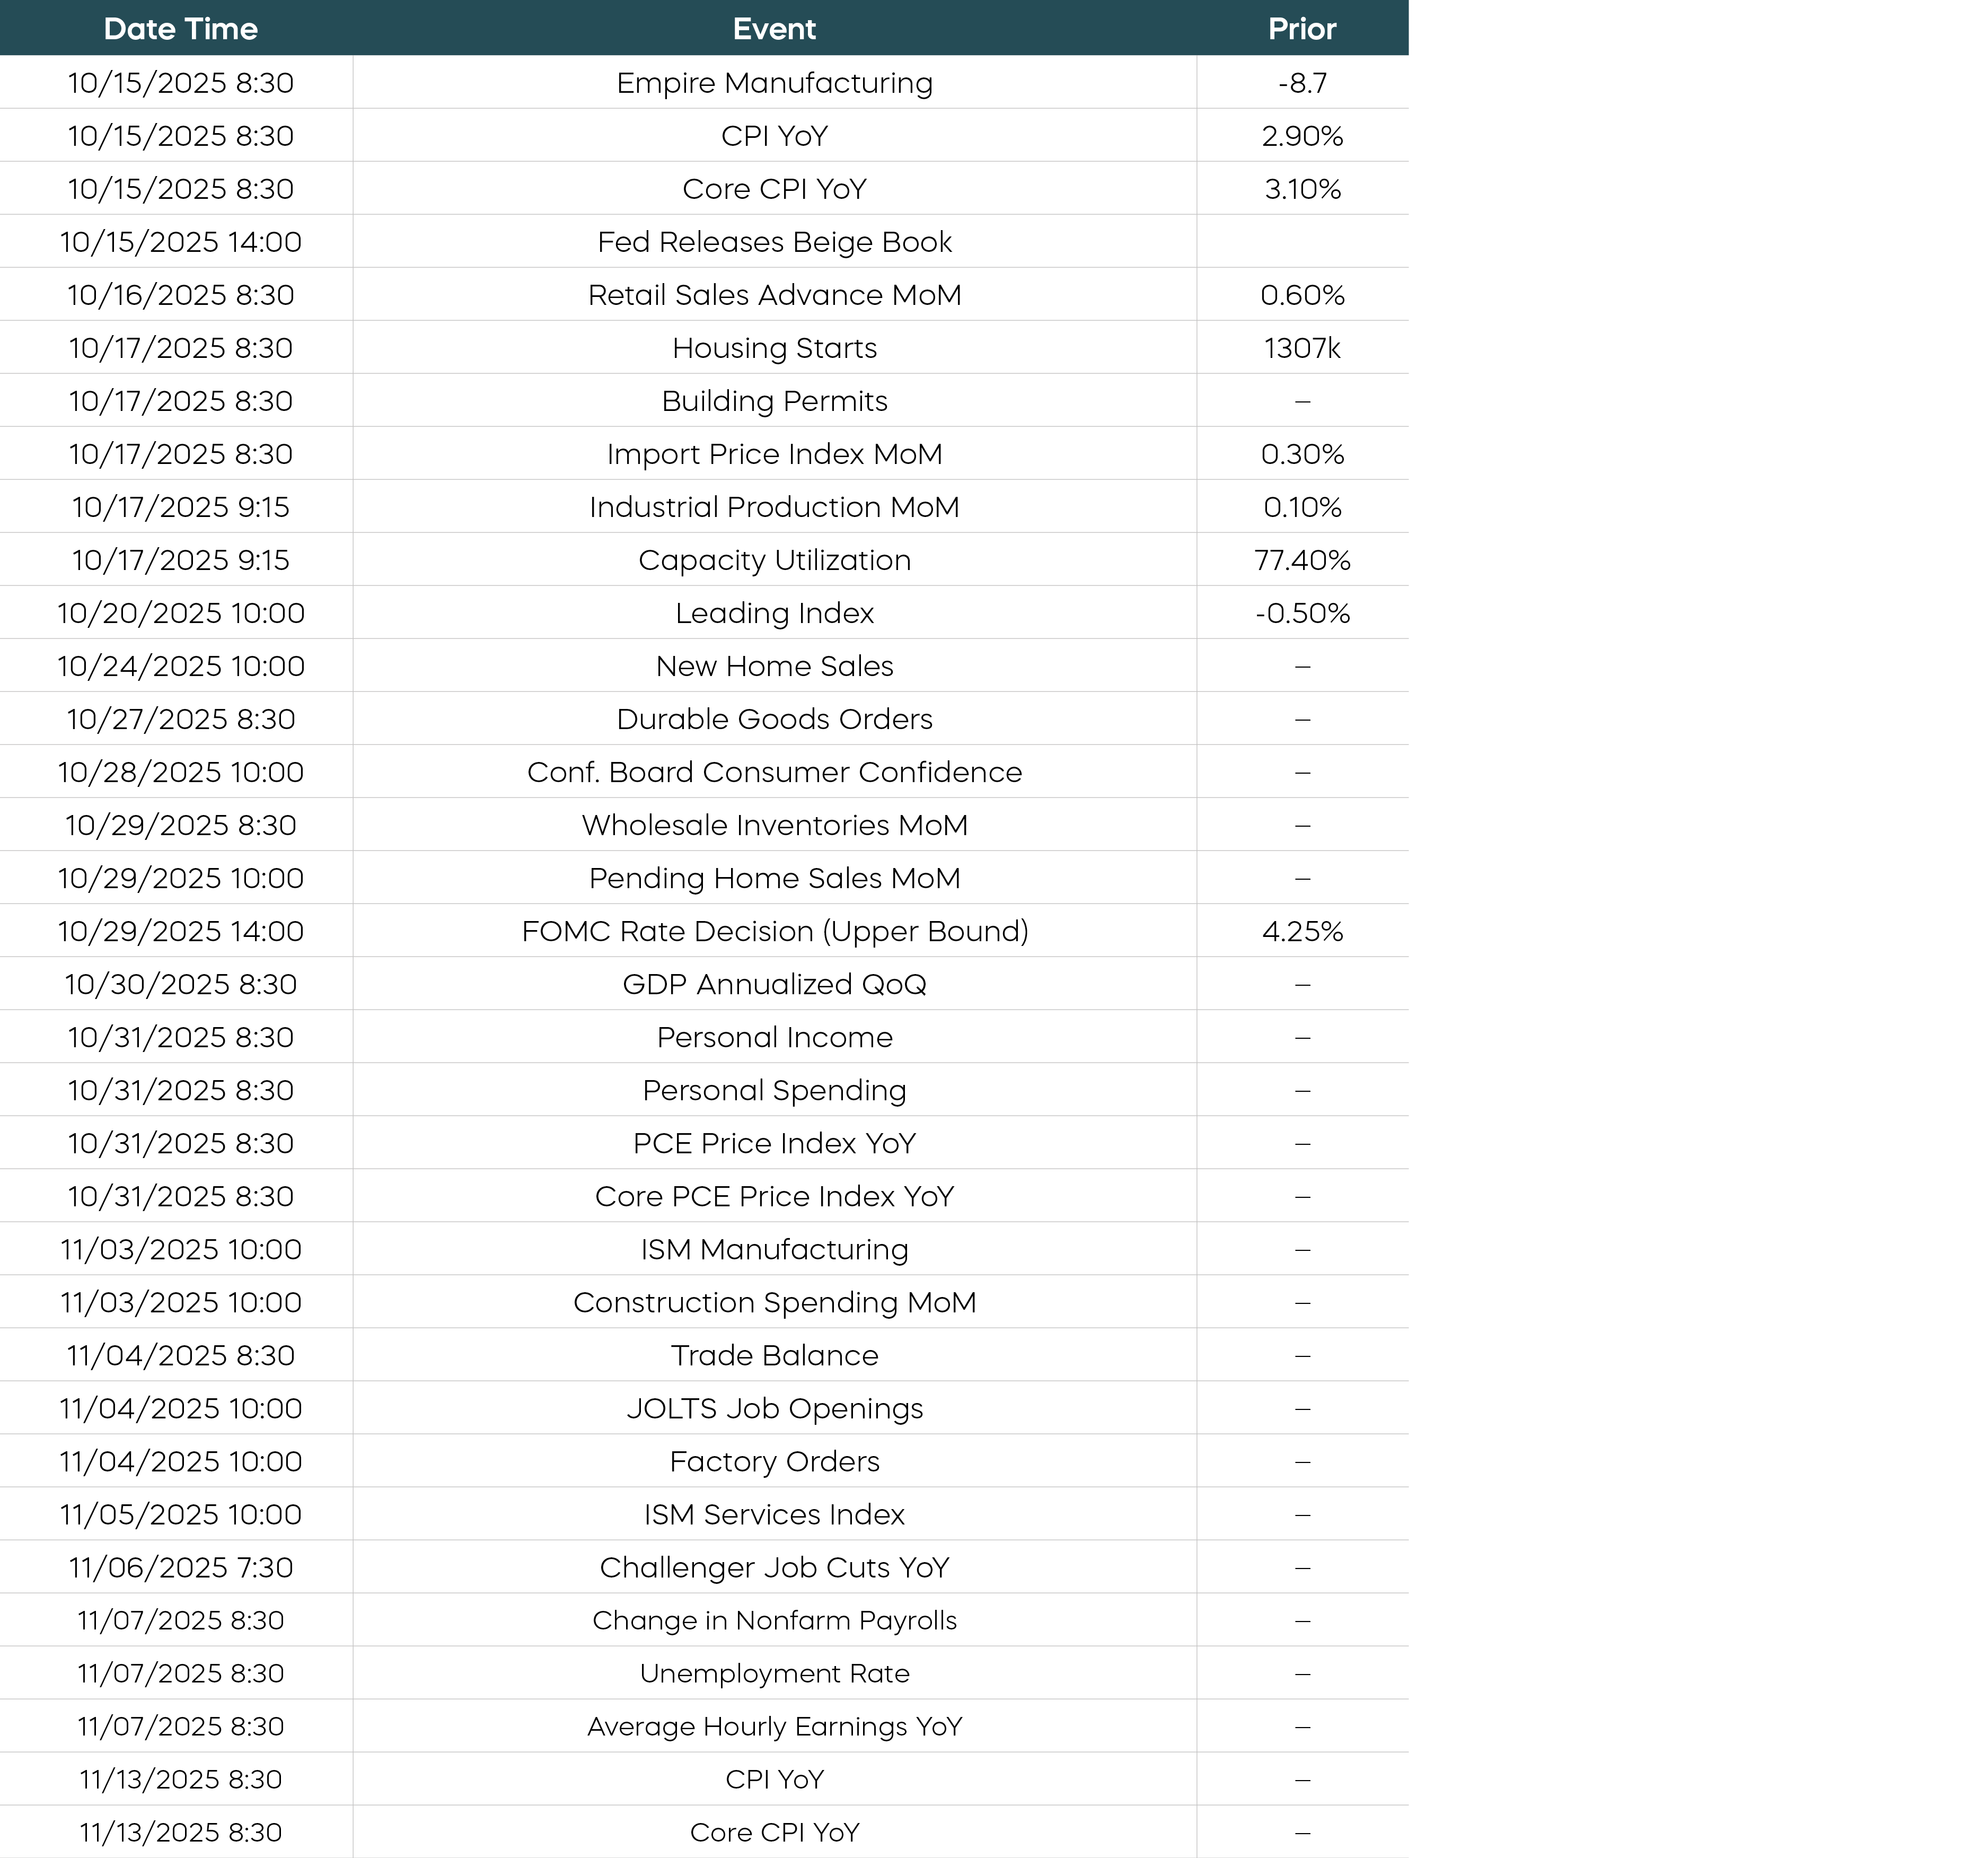
Source: Bloomberg. Data as of 10/2/25.
Equity Perspectives
September closed out a very strong third quarter for stocks—the S&P 500 rose 3.7% for the month while setting 23 new highs.[1] Large-cap tech stocks have remained the dominant force in equity markets, with over half of the S&P 500’s 8.1% return for the quarter driven by the information technology sector.[1] Despite large-cap growth stocks’ ongoing leadership, there is expanding evidence that the rally is broadening. Both mid- and small-cap stocks have been strong performers for most of the year. In fact, since its low on April 8, the Russell 2000 Index has delivered returns of 39.3%, which is 4.2% more than the S&P 500.[2] The S&P MidCap 400 Index has also risen 28.4% since April 8.[2]
We see three primary reasons why this current momentum could continue:
- Economic Growth
Recent data suggests we might be entering a period of accelerating economic growth. According to the Bureau of Economic Analysis, the second quarter’s real GDP increased at a seasonally adjusted annualized rate of 3.8%. That reversed three consecutive quarters of decreasing or negative growth and included an upward revision of the prior estimate, primarily reflecting stronger consumer spending.
Real GDP Has Accelerated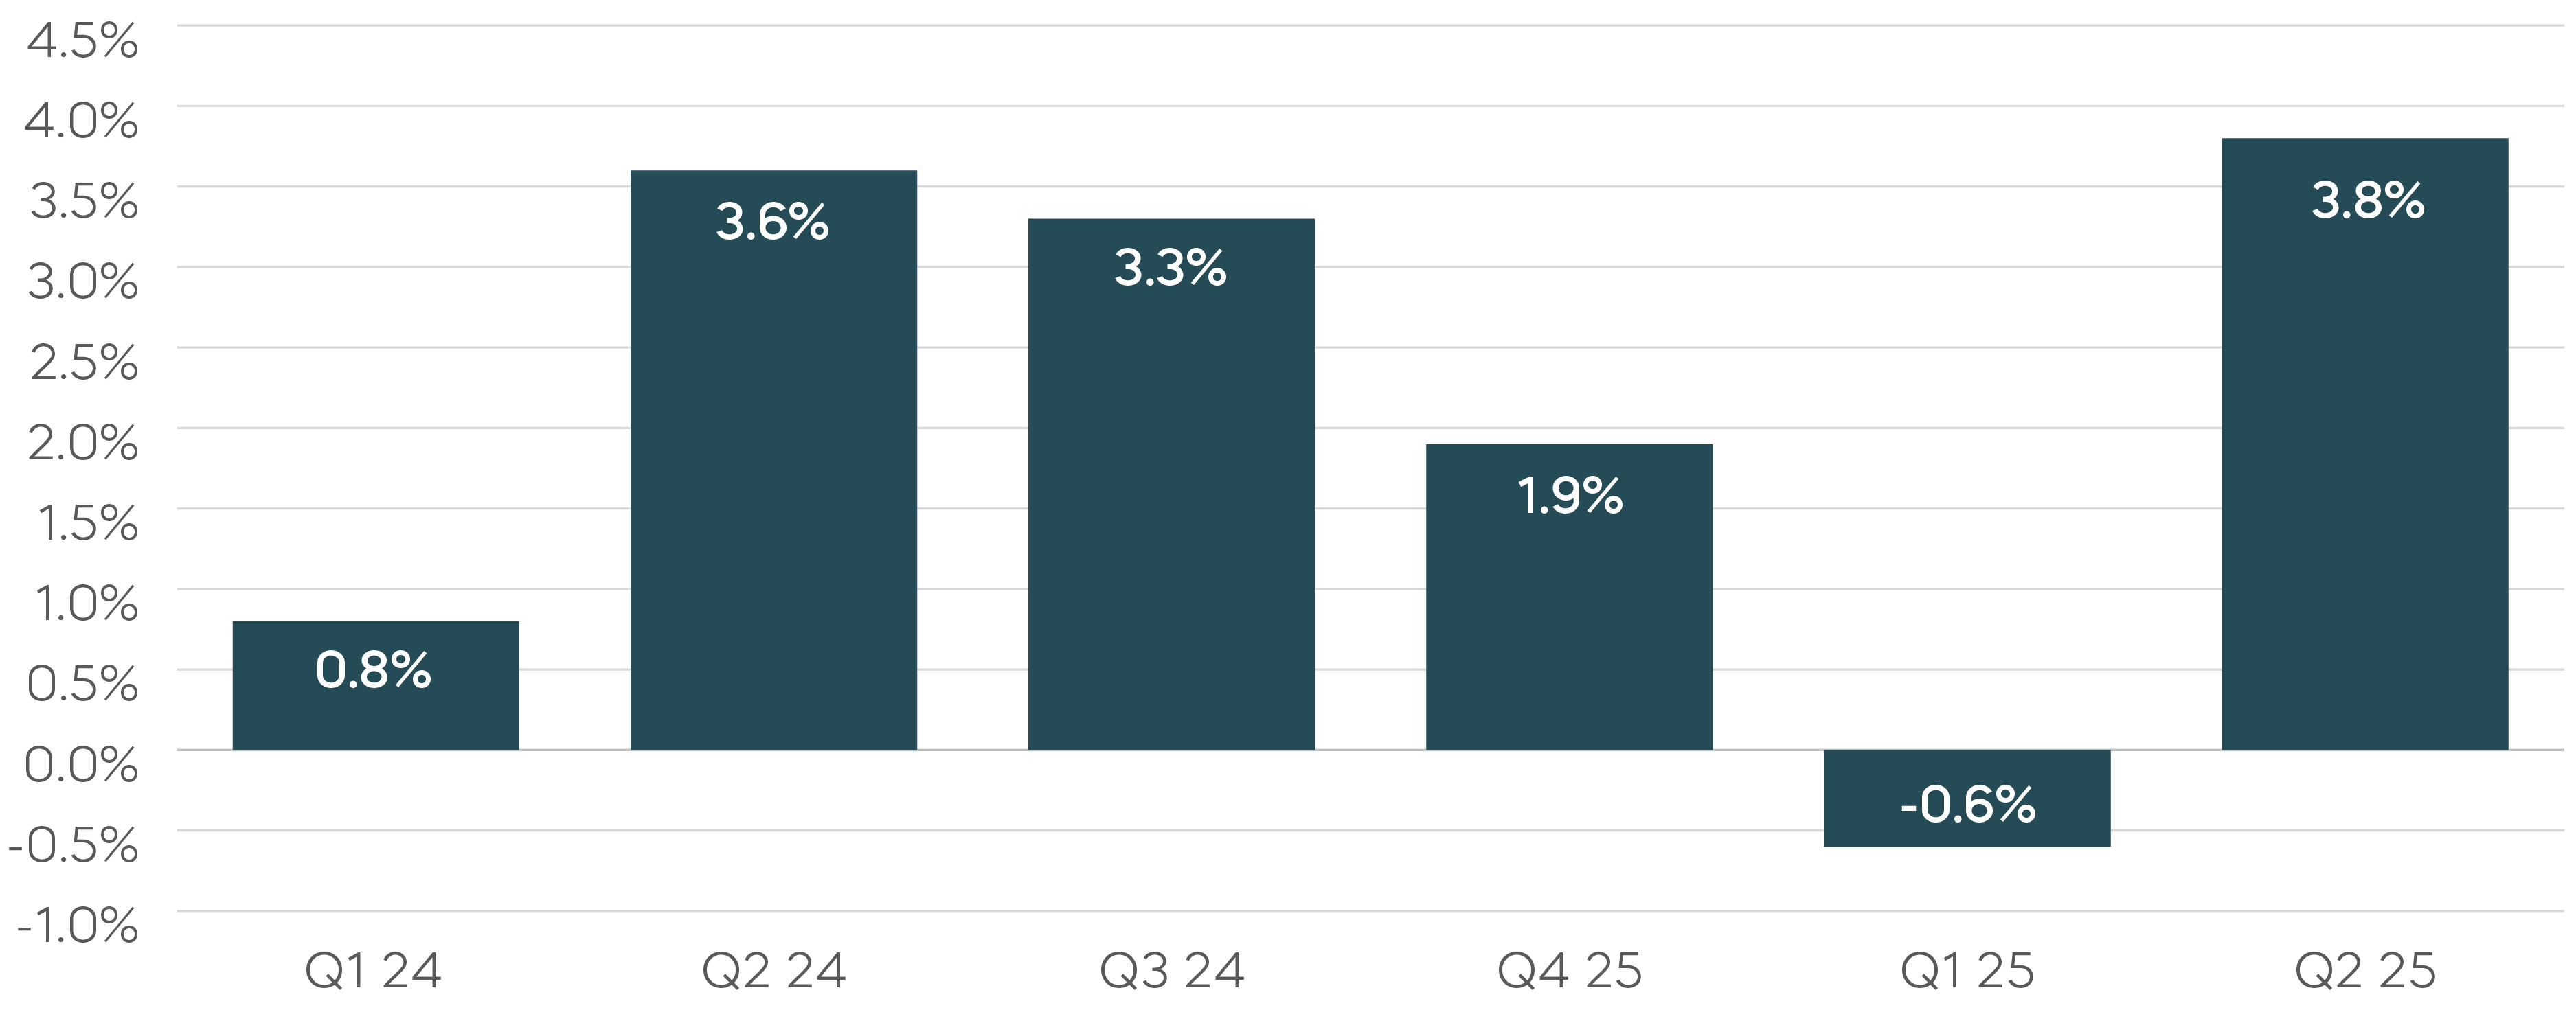
Source: U.S. Bureau of Economic Analysis. - Fed Rate Cuts
Following the 25 basis point cut in September, the Fed projected two additional rate cuts for 2025. “Don’t fight the Fed” is usually good advice, and stocks across the market capitalization spectrum have historically performed well following Fed rate-cutting cycles. Mid- and small-cap stocks have generally been outsized beneficiaries, as we detailed in last month’s commentary. - Strong Fundamentals[3]
Earnings growth and strong profit margins remain generally supportive of equity market performance. S&P 500 earnings results were solid for the second quarter, and Nasdaq-100 results were exceptional, with year-over-year growth approaching 30%. Heading into the third-quarter earnings season, analysts have revised estimates for the S&P 500 higher and expect growth of 7.9%. Mid-cap stocks are expected to deliver 2026 earnings growth of 12.1% while small caps are expected to deliver growth of almost 16%.
Target More Upside with a Covered Call Strategy Powered by Daily Options
For investors using covered call strategies for both income and to participate in the current equity market upside, the structure matters. Traditional covered call strategies—those that use monthly options—are popular for income, but they typically limit upside potential. Over time, the CBOE S&P 500 BuyWrite Index, a proxy for traditional covered call strategies, has sacrificed approximately two-thirds of the total returns of the S&P 500.[4] We have observed a similar pattern during the current bull market. Since the market low on April 8, the CBOE S&P 500 BuyWrite Index has lagged the S&P 500 by a wide margin, as you can see in the chart below.
A Covered Call Strategy Powered by Daily Options Has Captured More Upside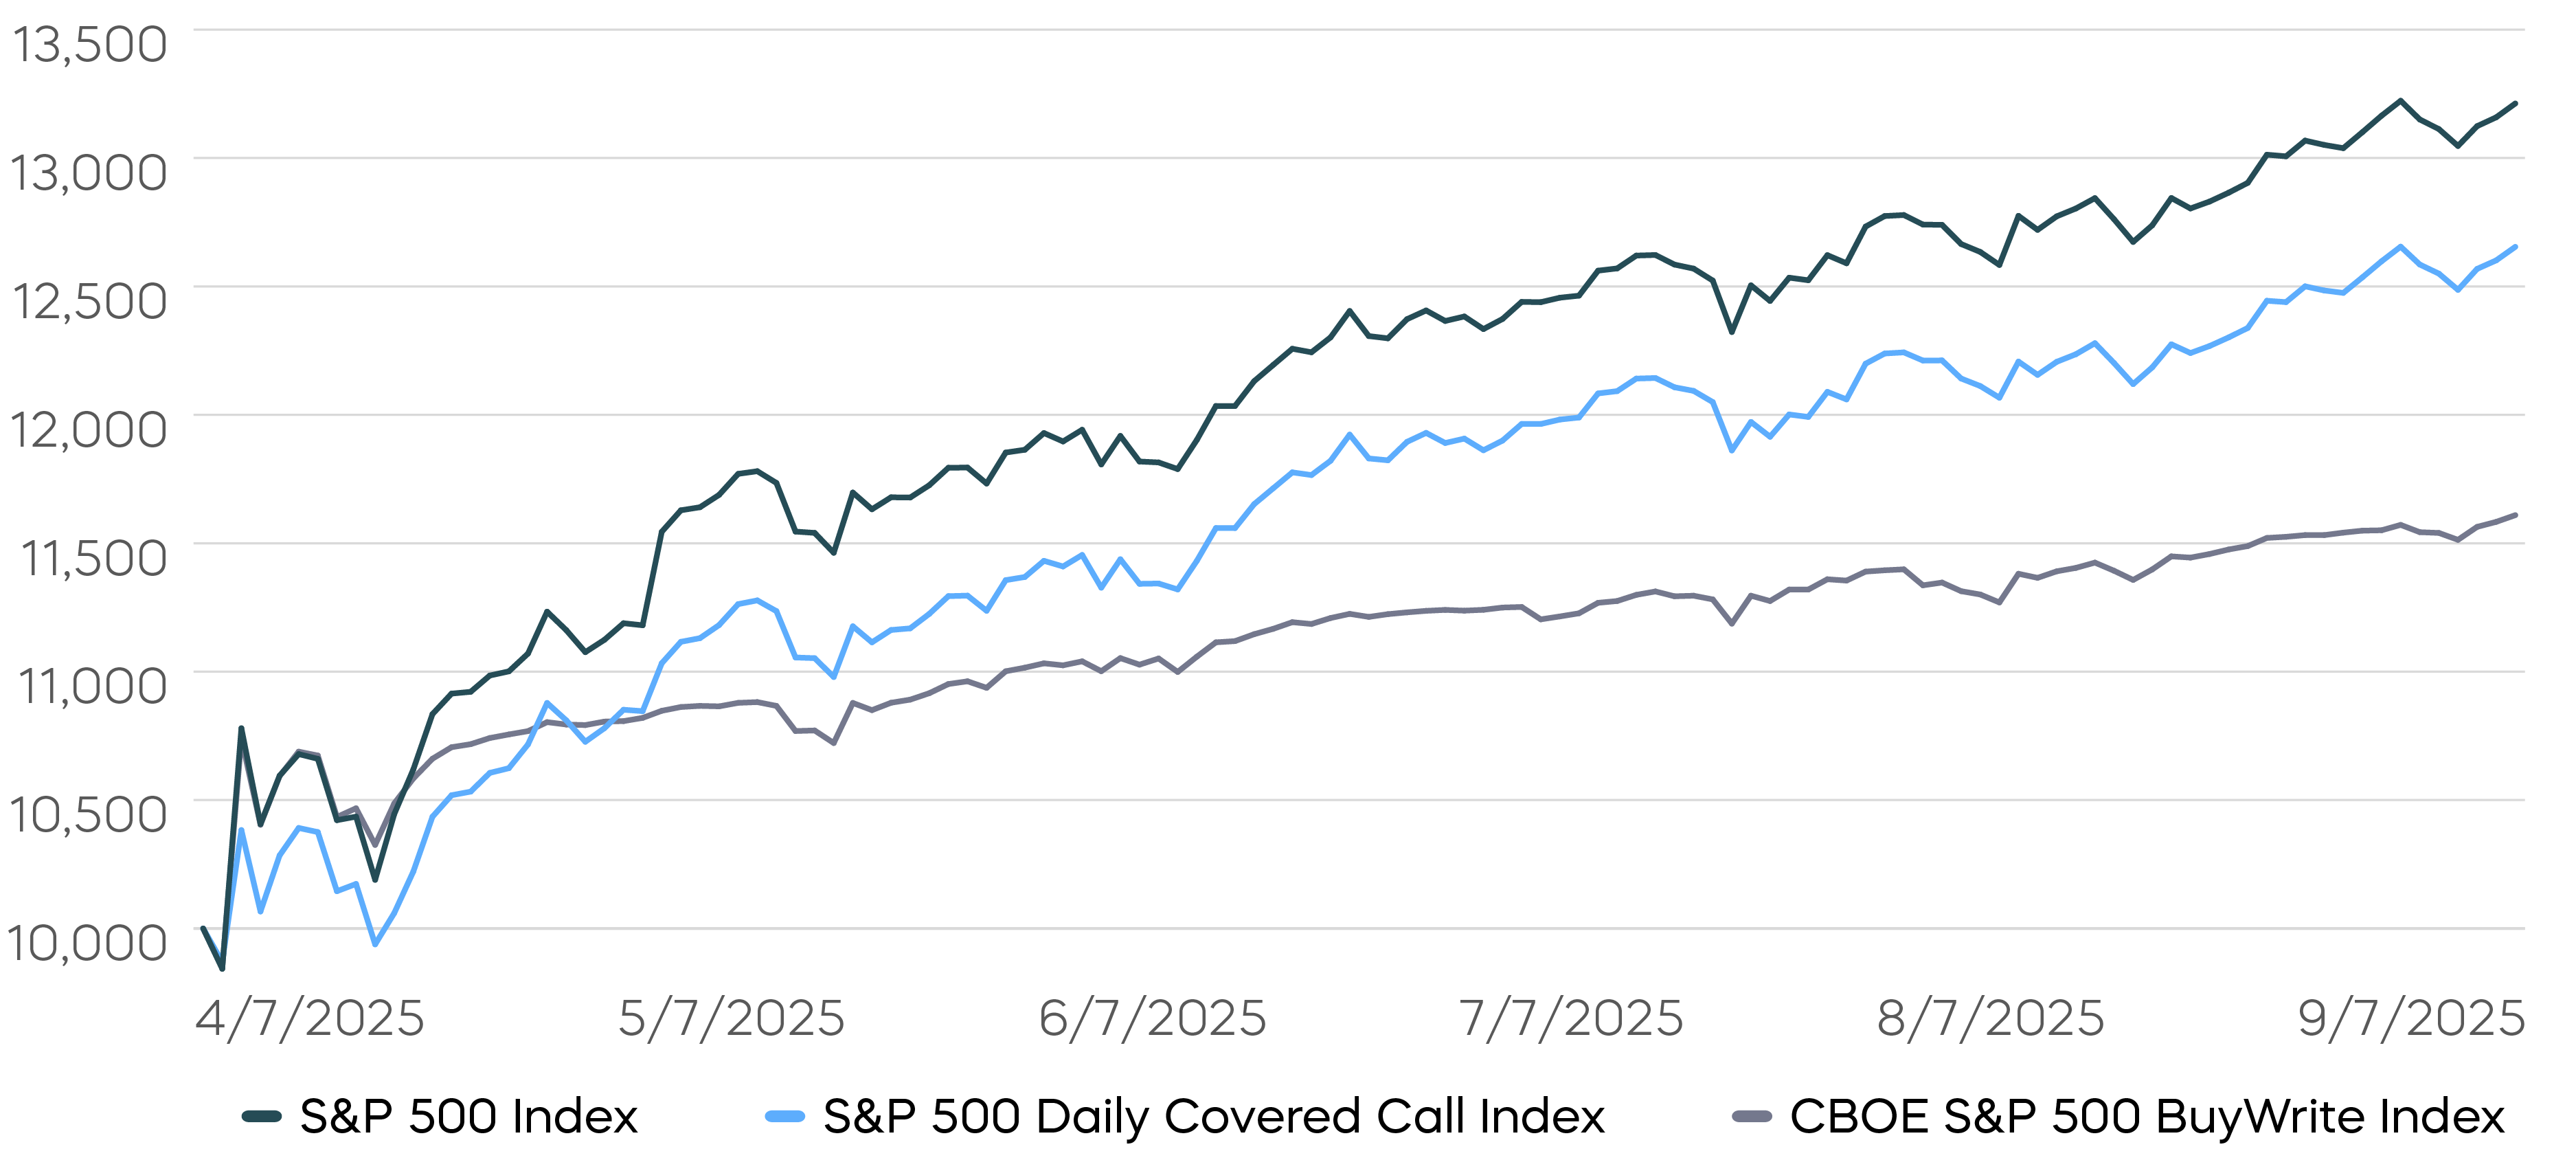
Source: Bloomberg. Data from 4/8/25 through 9/30/25. Index returns are for illustrative purposes only and do not reflect any management fees, transaction costs or expenses. Indexes are unmanaged, and one cannot invest directly in an index. Past performance does not guarantee future results.
The S&P 500 Daily Covered Call Index seeks to improve upon the tradeoff between generating high levels of income and capturing long-term total returns. Since its inception, the index has captured significantly more of the S&P 500’s total returns, including during the current rally.[5]
Fixed Income Perspectives
When Past Is Not Prologue
Markets are, of course, debating the implications of the government shutdown on bond yields. Although recent shutdowns have sometimes coincided with lower yields, the effect this time may be marginal as monetary policy and broader economic fundamentals remain far more important drivers.
While a shutdown is unlikely to shift medium- or long-term growth prospects, the resulting fiscal policy direction could be more lasting. Historically, most shutdowns have tilted the U.S. toward a neutral or contractionary stance, often reflecting Republican-led efforts to restrain spending. Past demands have included attempts to defund the Affordable Care Act in 2013, the “Contract with America” agenda of 1995–1996, and deficit-reduction negotiations in 1990.
This time, Democrats are pushing to extend ACA subsidies and reverse cuts from the "One Big Beautiful Bill"—a shift that could signal an expansionary outcome if their demands are met. In short, history may not be a reliable guide for how yields behave this time.
A Recent History of U.S. Government Shutdowns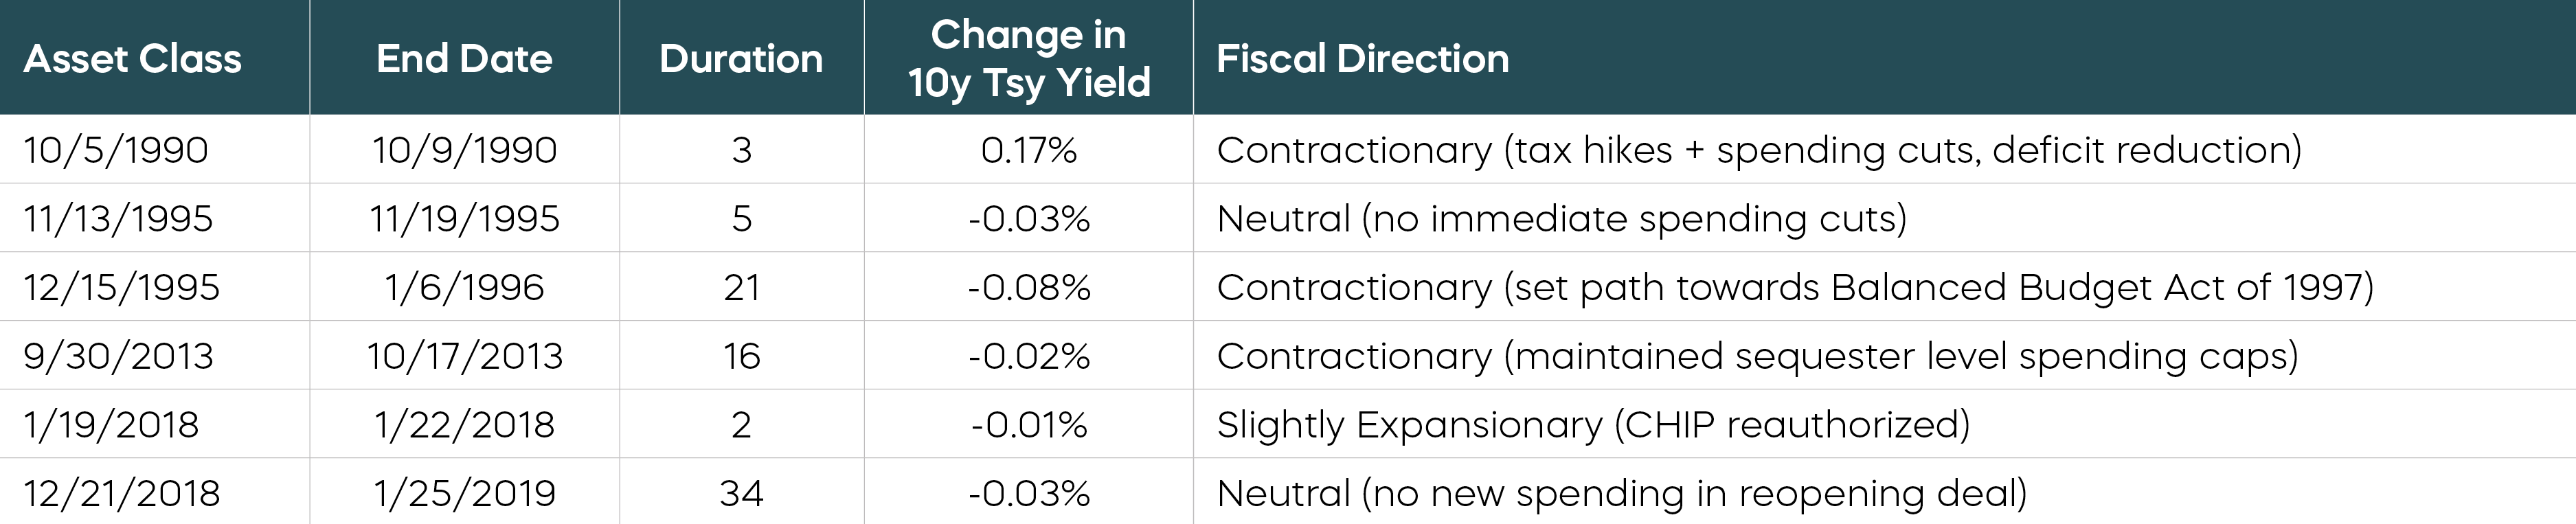
Source: ProShares, U.S. House of Representatives.
The shutdown also complicates the Federal Reserve’s task. A data-dependent Fed is searching for weakness in the labor market to justify additional rate cuts, but the Bureau of Labor Statistics’ closure will delay jobs reports and revisions at a critical juncture. Meanwhile, markets are pricing in further easing following recent labor market softness. We believe that the Fed will stay on its path of gradual rate reductions into next year, but data gaps due to the shutdown introduce greater uncertainty into the timeframe for potential future cuts.
Fed independence remains another concern. Last month, speculation swirled around expanding the Fed’s mandate to include “moderate long-term interest rates” and even using its balance sheet to support housing markets through an “operation mortgage twist.” These ideas have cooled since Governor Stephen Miran publicly rejected them, yet they underscore the pressures of fiscal dominance.
On the other hand, aggressive Fed policies could undermine easing efforts if markets push back. For example, U.S. Treasuries and gold have traditionally exhibited a positive correlation as potential safe haven assets. Since April, however, U.S. Treasuries have been negatively correlated with gold. By contrast, government bonds in other developed markets have mostly maintained their positive correlations with gold.
While the U.S. has ample capacity to restore confidence, ongoing risks to fiscal discipline and Fed independence suggest that long-term yields are likely to remain range-bound, even if the Fed follows through with additional easing.
Return Correlations of Global Government Bonds vs. Gold, April–Sept 2025
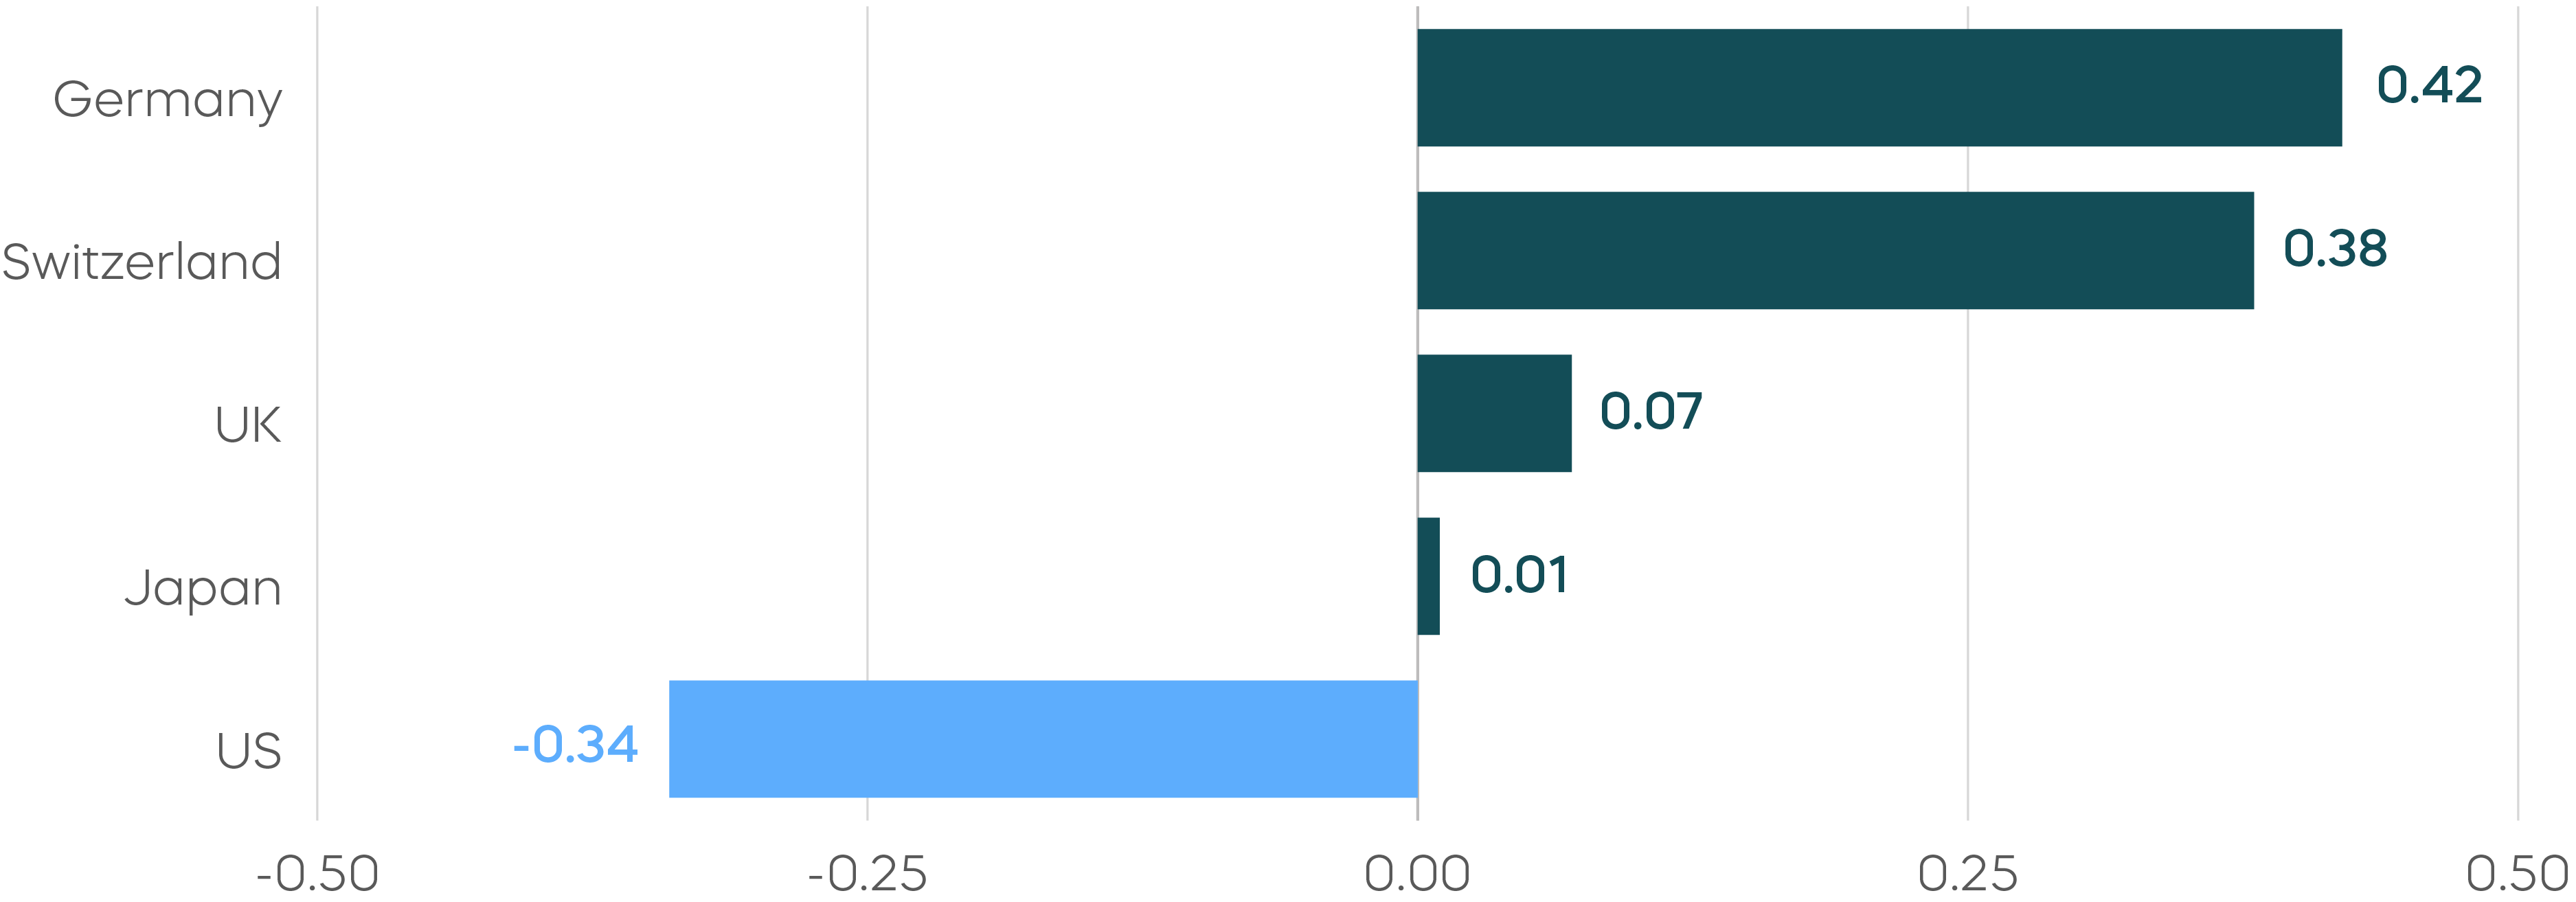
Source: Bloomberg, unhedged 7-10 year government bond total return indexes, weekly returns. Index returns are for illustrative purposes only and do not reflect any management fees, transaction costs or expenses. Indexes are unmanaged, and one cannot invest directly in an index. Past performance does not guarantee future results.
Fixed Income Returns—September 2025
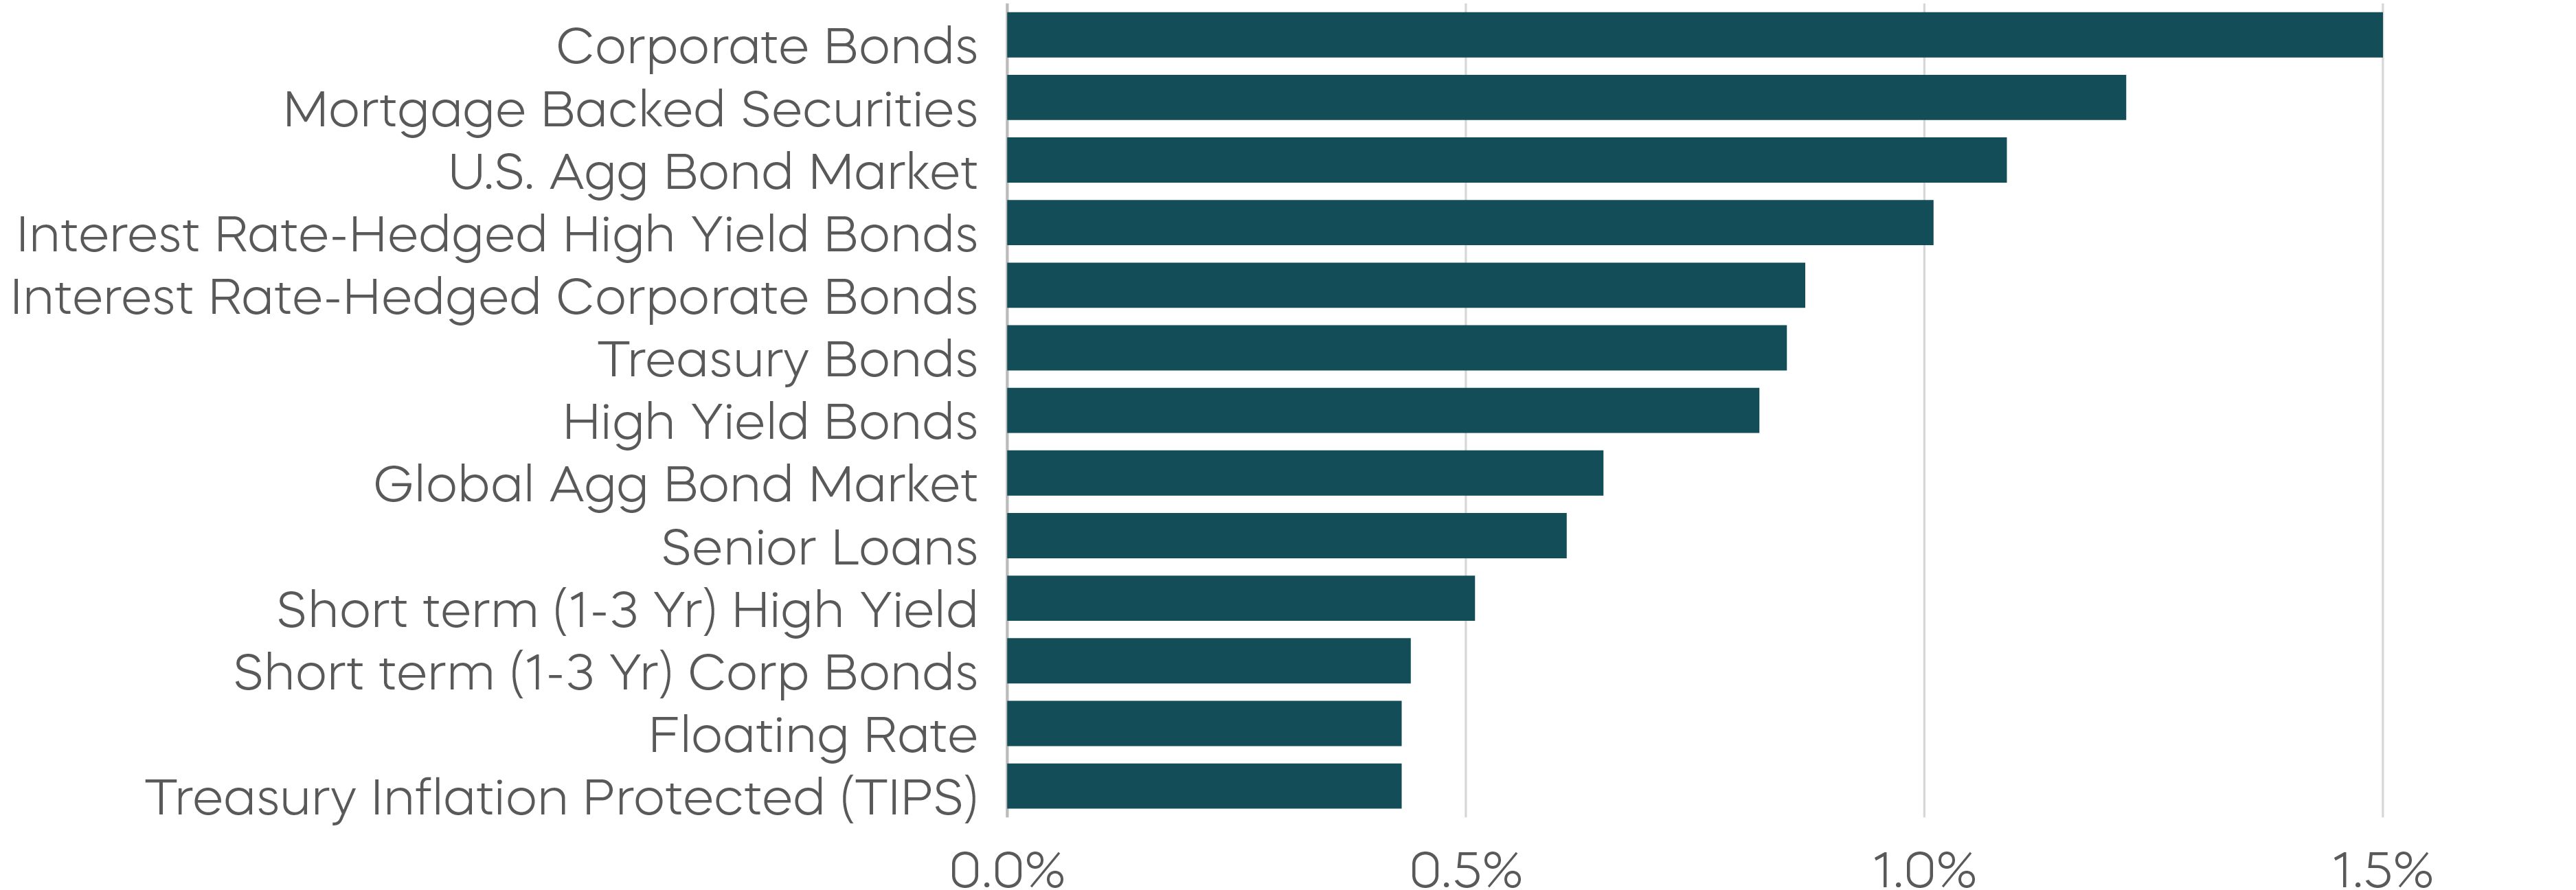
Source: Bloomberg. September returns 9/1/25–9/30/25. Index returns are for illustrative purposes only and do not reflect any management fees, transaction costs or expenses. Indexes are unmanaged, and one cannot invest directly in an index. Past performance does not guarantee future results.
[1] Source: S&P Dow Jones Indices, data as of 9/30/25.
[2] Source: Bloomberg, data from 4/8/25 through 9/30/25.
[3] Source: FactSet, as of 9/30/25.
[4] Source: Bloomberg, inception through 9/30/25.
[5] Source: Bloomberg, data from 4/8/25 through 9/30/25.