Key Observations
- Small caps are rallying after a prolonged period of underperformance, thanks to re-accelerating economic growth, strong earnings, and Fed rate cuts.
- Today, small caps have become potentially fertile ground for investors to generate income and target quality growth potential.
- Two ETFs—the ProShares Russell 2000 High Income ETF (ITWO) and the ProShares Russell 2000 Dividend Aristocrats ETF (SMDV)—offer investors the potential to capture small cap upside and generate high levels of income that can grow over time.
Small Caps Are Rallying
Investors can be forgiven their skepticism towards small caps, despite the current rally. After all, small caps have underperformed the top-heavy, large-cap S&P 500 over the last decade. Reasons are twofold: First, earnings have been anemic; and second, private markets now play a greater role in small-firm financing. According to Morningstar, public companies are increasingly being taken private, and many fast-growing small companies are remaining private for longer.[1]
But something shifted this spring. Bloomberg data shows that since its low on April 8, the Russell 2000 Index has gained 37.8%, outpacing the S&P 500 by 4.5% through Sept. 25. The small-cap index also received a fresh boost in September from the Fed’s latest interest rate cut. Since the market low on April 8, the Russell 2000 Index has rallied 37.8%, a 4.5% advantage over the S&P 500.
Small Caps Have Outperformed Large Caps Since April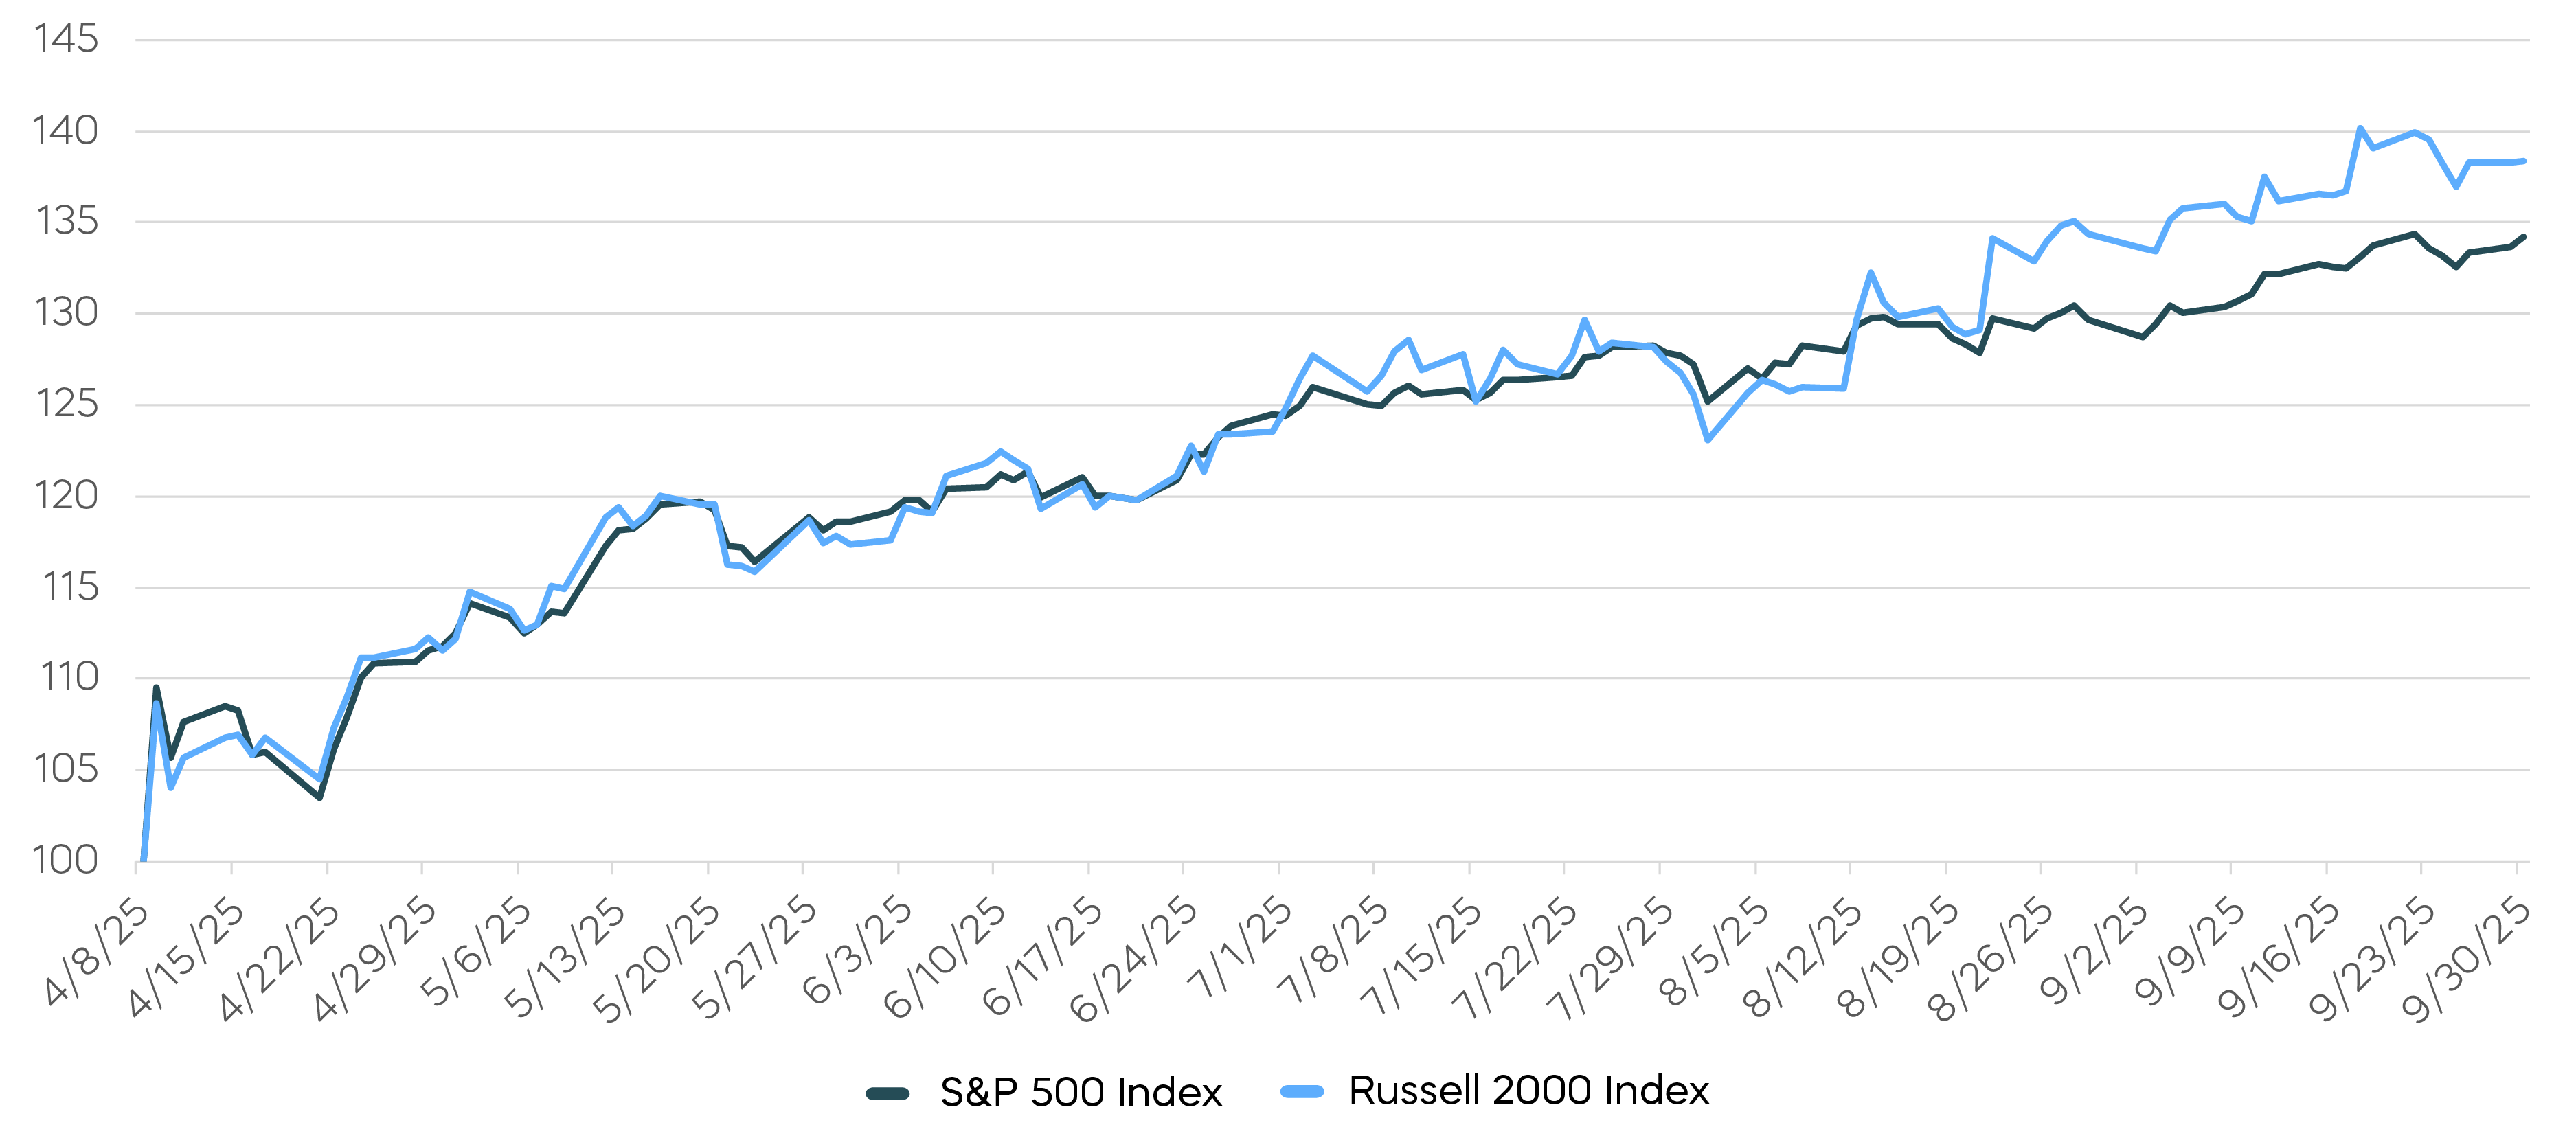
We see three reasons why the current small-cap momentum could continue:
-
Economic Growth
Small cap stocks have tended to perform better in the early stages of economic expansions. Recent data suggests we might be entering a period of higher growth. According to the Bureau of Economic Analysis, second quarter real GDP increased at an annual rate of 3.8%, reversing three consecutive quarters of declining growth.
-
Fed Rate Cuts
Stocks have historically performed well following Fed rate-cutting cycles, with small caps being outsized beneficiaries. Because smaller stocks are typically more leveraged, lower borrowing costs can disproportionately benefit them versus their larger peers. Bloomberg data shows that, over the last seven rate-cut cycles, the Russell 2000 Index outperformed the S&P 500 by at least 4% annualized over subsequent 1-, 2-, and 3-year periods.[2]
-
Improving Fundamentals
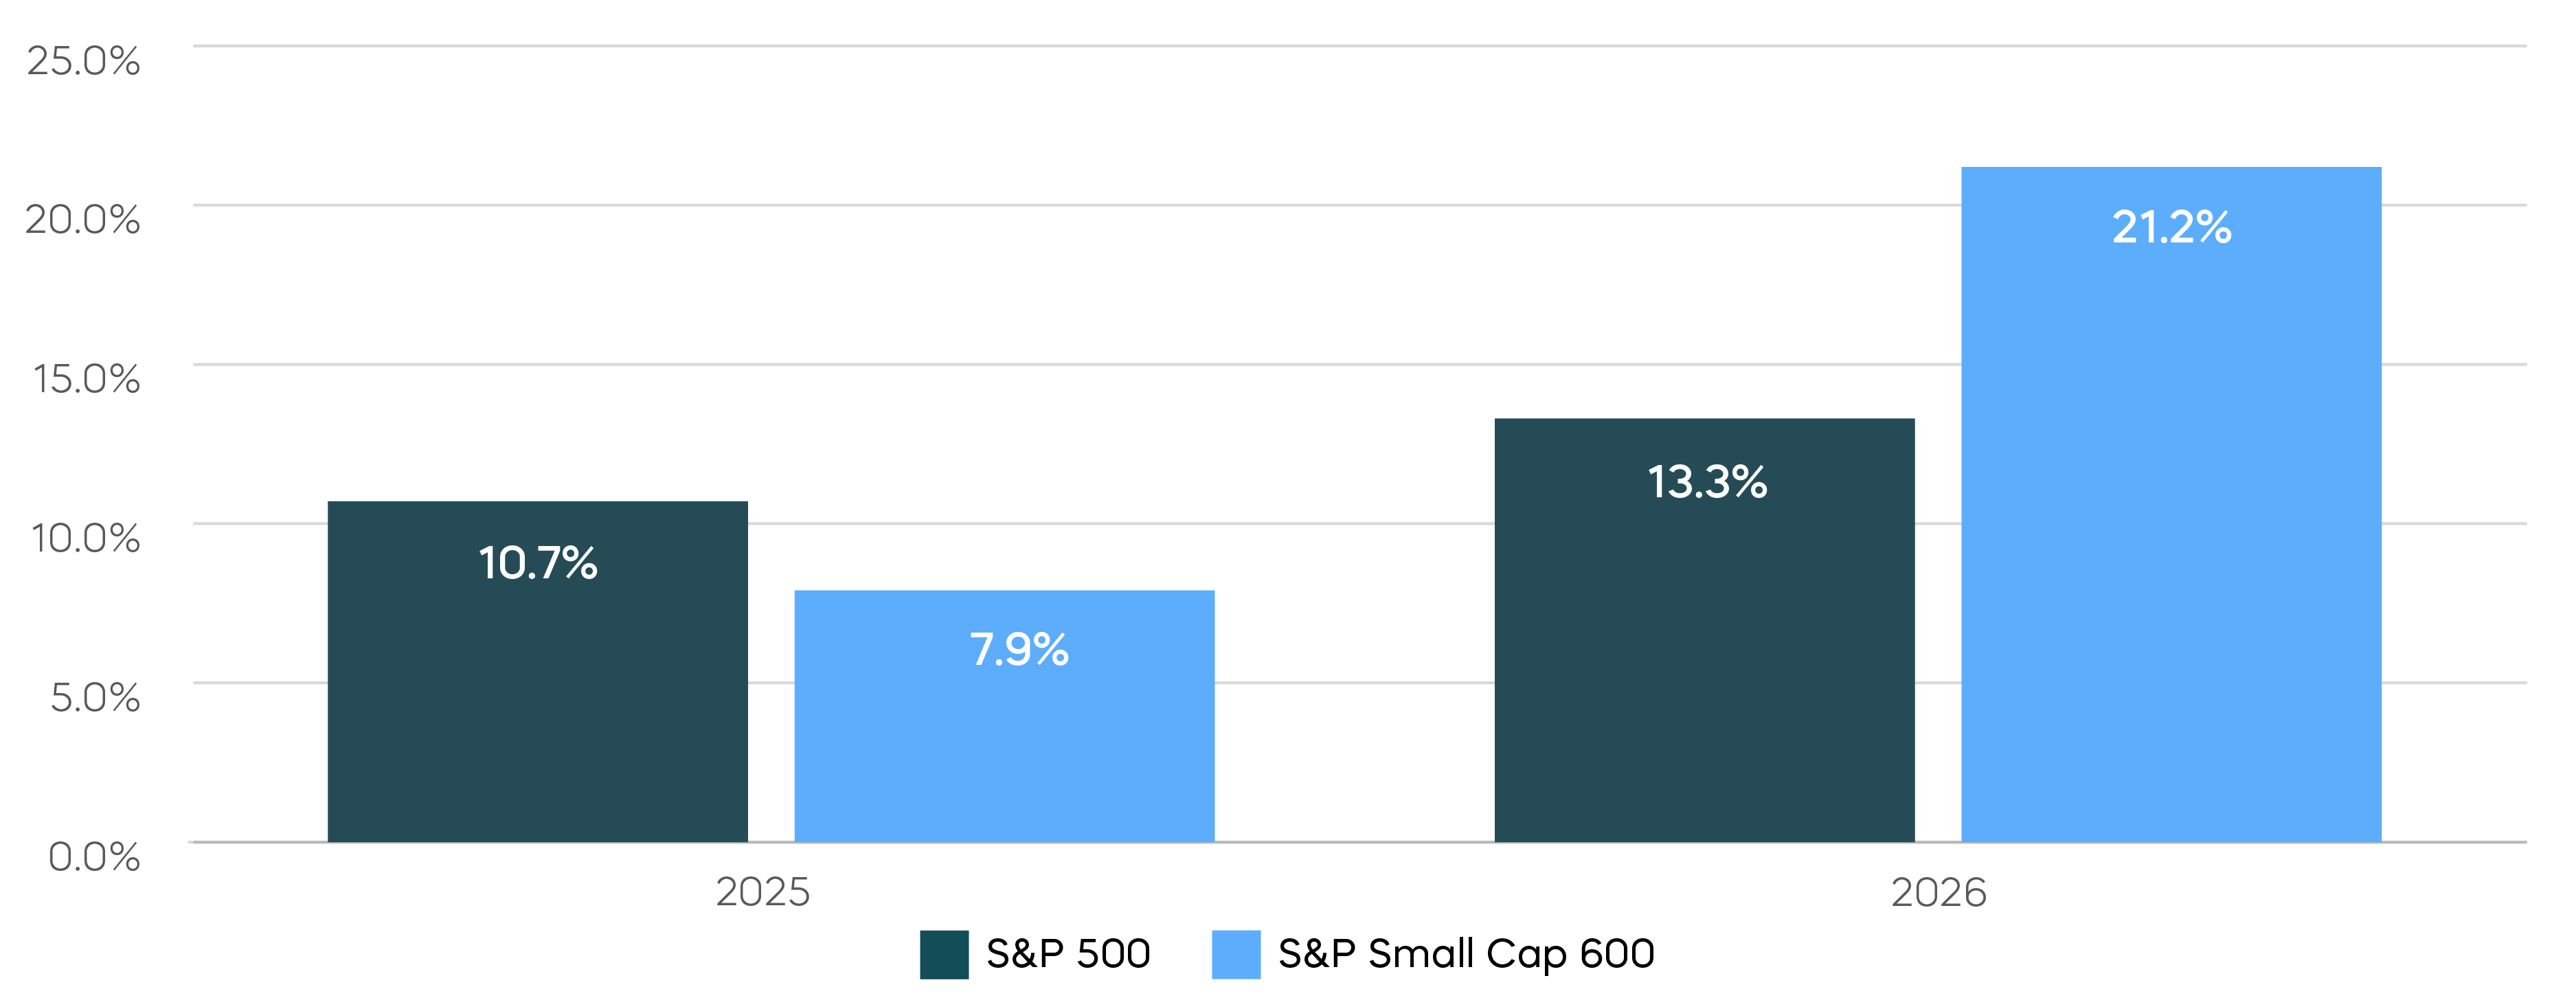
After an earnings recession in 2023 and flat growth in 2024, small caps can be expected to rebound. The S&P SmallCap 600 is projected to deliver earnings growth of just under 8% in 2025, followed by growth of 21.2% in 2026 (see chart).
Small Caps are Expected to Deliver Strong Earnings Growth in 2026
Modern index strategies may enable investors to generate high income levels and target quality stocks in their small-cap allocations.
Given this favorable backdrop for small caps, investors should be aware of two innovative approaches to small-cap investing. In addition to potentially capturing market upside, modern index strategies may enable investors to generate high income levels and target quality stocks in their small-cap allocations.
How to Target High Income from Small Caps
Covered call strategies are increasingly popular thanks to their potential to capture both equity market upside and high levels of income. While many such funds focus on the S&P 500, small-cap stocks can be fertile ground for executing a covered call strategy because of their frequently higher implied volatility. Greater volatility means small caps often demand higher option premiums, which covered call strategies can harvest and translate into potentially higher levels of income than comparable large-cap strategies.
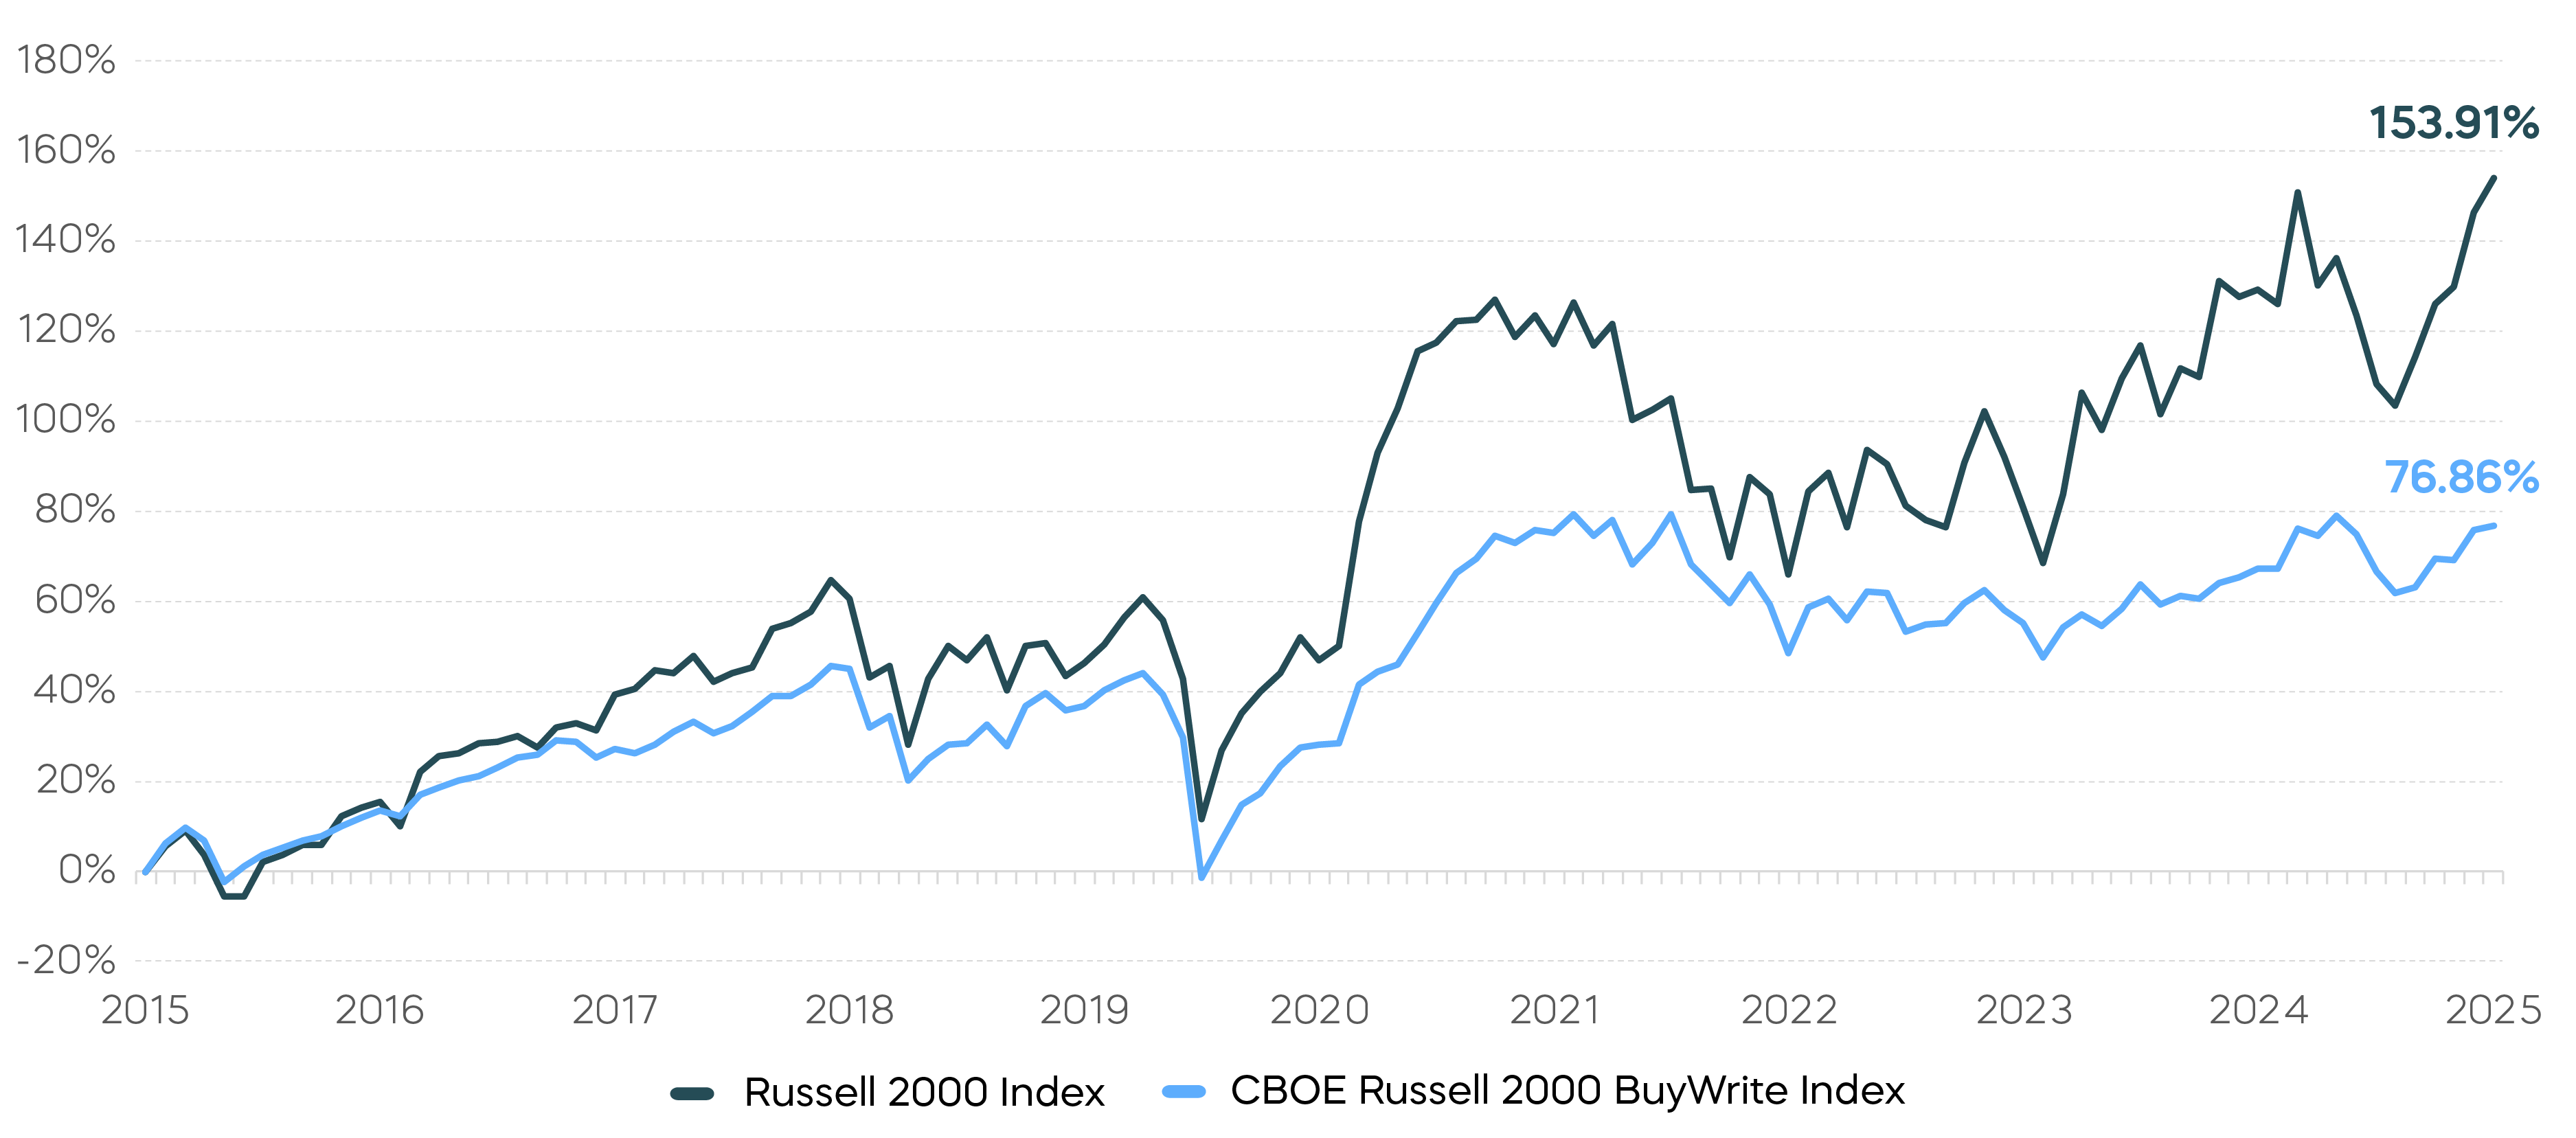
But here’s the catch: traditional covered call strategies that use monthly expiring options have sacrificed significant total return in exchange for high levels of income. For small caps, that trade-off can be particularly costly.
Russell 2000 Monthly Covered Call Strategies Have Underperformed
A recent innovation—daily call options—makes it possible to offer a solution designed to help investors participate in more upside gains while also potentially capturing long-term returns that monthly small-cap strategies can miss.
ProShares Russell 2000 High Income ETF (ITWO), which tracks the Russell 2000 Daily Covered Call Index, employs such a strategy,[3] enabling investors to seek high levels of income and capture more of the Russell 2000 Index’s growth over time. Since its inception in September 2024 through September 30, 2025, ITWO has captured 95% of the Russell 2000 Index’s returns. ITWO’s most recent 12-month distribution rate was 15.1% as of September 30, 2025, according to Bloomberg data.[4]
Total Return Since ITWO's Index Inception 8/27/2024-9/30/2025
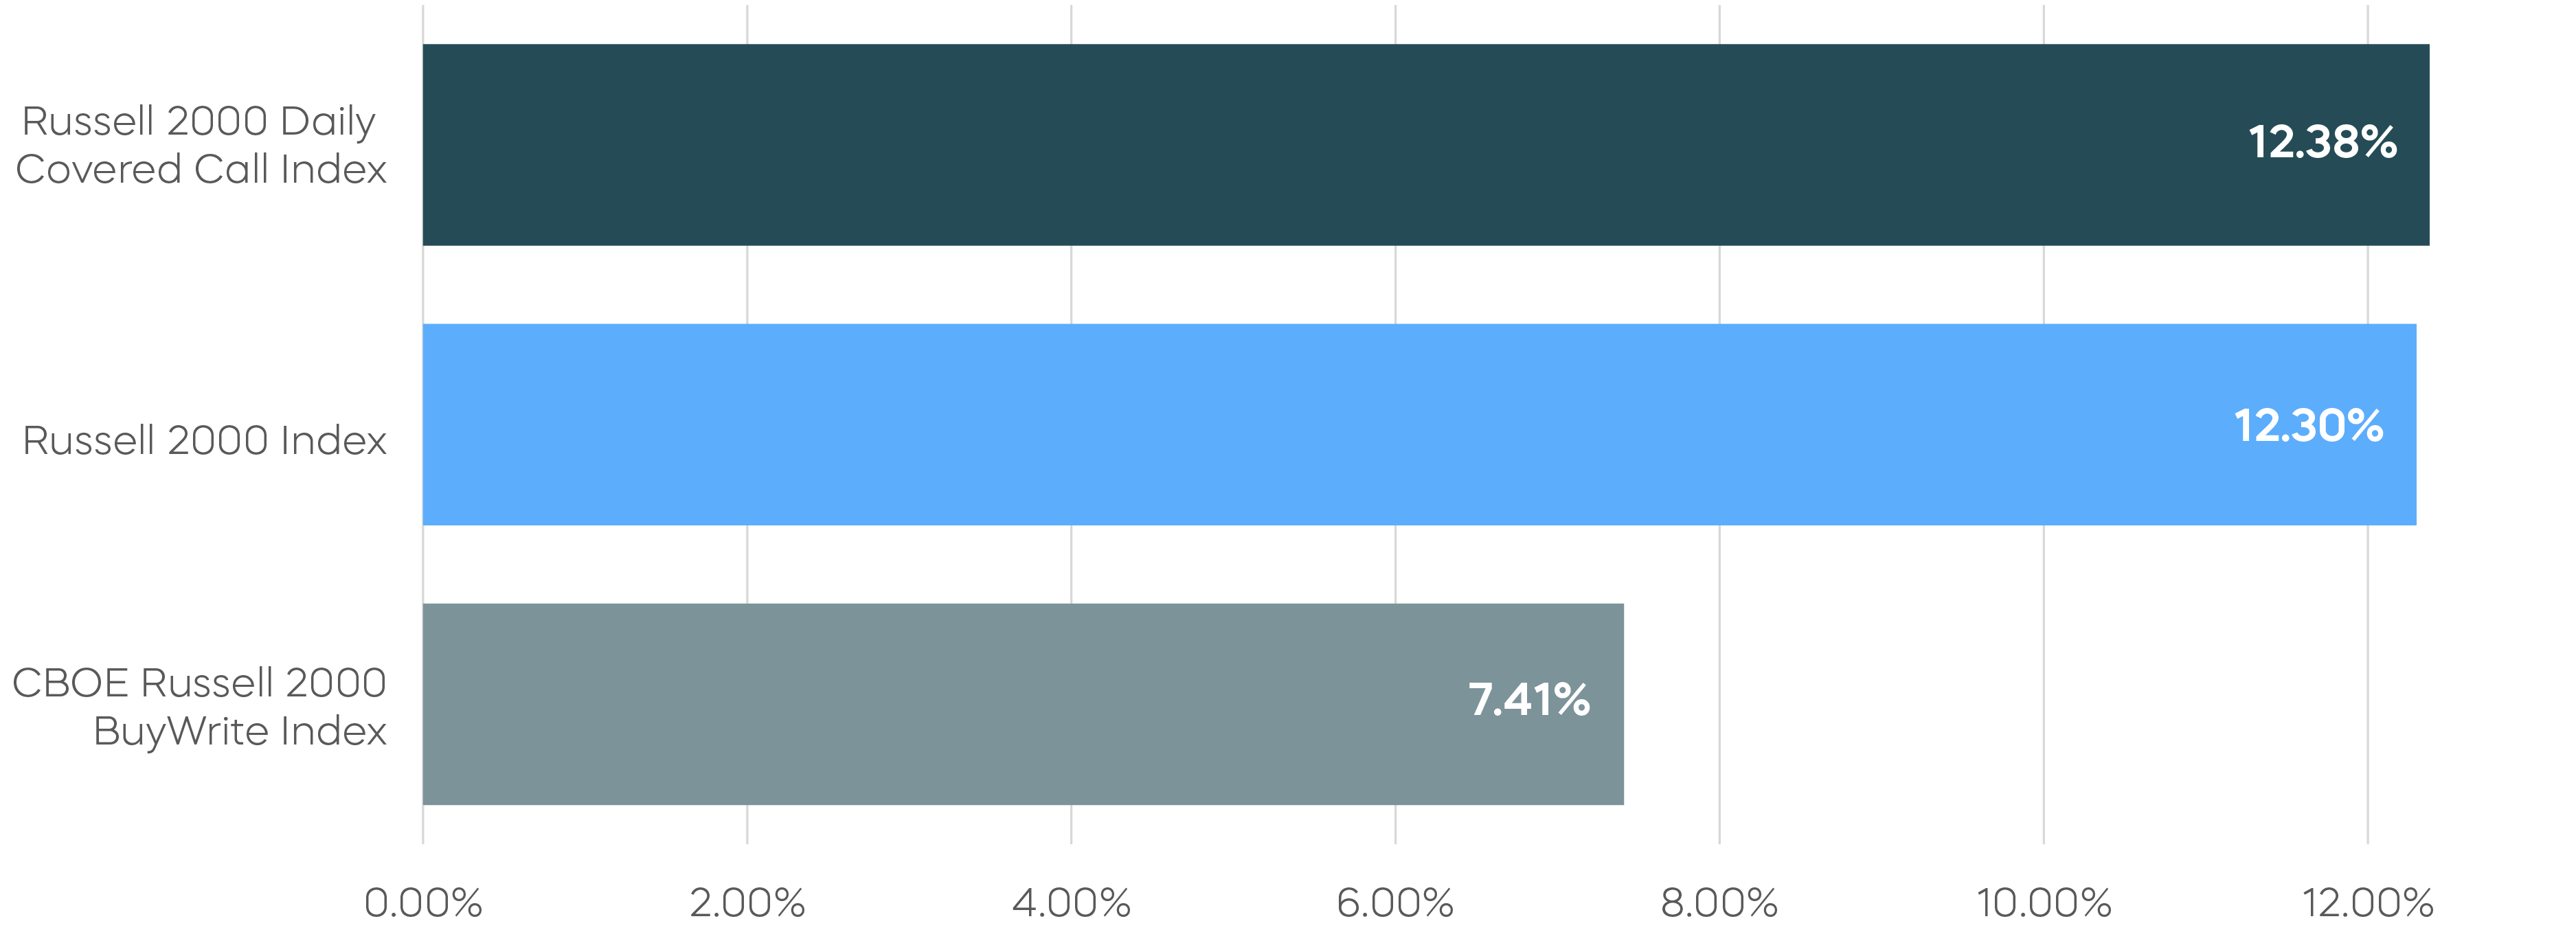
ITWO’s performance as of 9/30/25: One-year is 8.78% (NAV) | 8.87% (Market Price); Since 9/4/24 inception is 13.33% (NAV) | 13.55% (Market Price).
The 12-Month Distribution Rate represents the sum of ITWO's distributions for the last 12 months, expressed as a percentage of the NAV at the end of the previous month. Distributions include return of capital which may be taxable or non-taxable. The characterization as return of capital does not impact whether the distribution is taxable. See 19a-1 notice for estimated percentage of return of capital. Distributions will reduce the NAV by the amount of the distribution. Future distributions may differ significantly from the latest distribution and are not guaranteed. Actual sources of the distributions may vary at the end of the year and will be provided in a Form 1099-DIV.
The performance quoted represents past performance and does not guarantee future results. Investment return and principal value of an investment will fluctuate so that an investor's shares, when sold or redeemed, may be worth more or less than the original cost. Shares are bought and sold at market price (not NAV) and are not individually redeemed from the fund. Market price returns are based upon the midpoint of the bid/ask spread at 4:00 p.m. ET (when NAV is normally determined for most funds). Your brokerage commissions will reduce returns. Current performance may be lower or higher than the performance quoted. For standardized returns and performance data current to the most recent month end, see the Performance page.
Focusing on Quality with Small Cap Dividend Growers
A common concern among small-cap investors is profitability. It’s a fair point. Some 43% of stocks in the Russell 2000 Index produced negative net income per share in their latest fiscal year, according to FactSet.
A potential solution? Focus on small-cap companies that have continuously grown their dividends. These stocks typically show hallmarks of quality like stable earnings, strong histories of profit and growth, and solid fundamentals. Investors can precisely focus their small-cap allocation on these high-quality stocks using the ProShares Russell 2000 Dividend Growers ETF—SMDV.
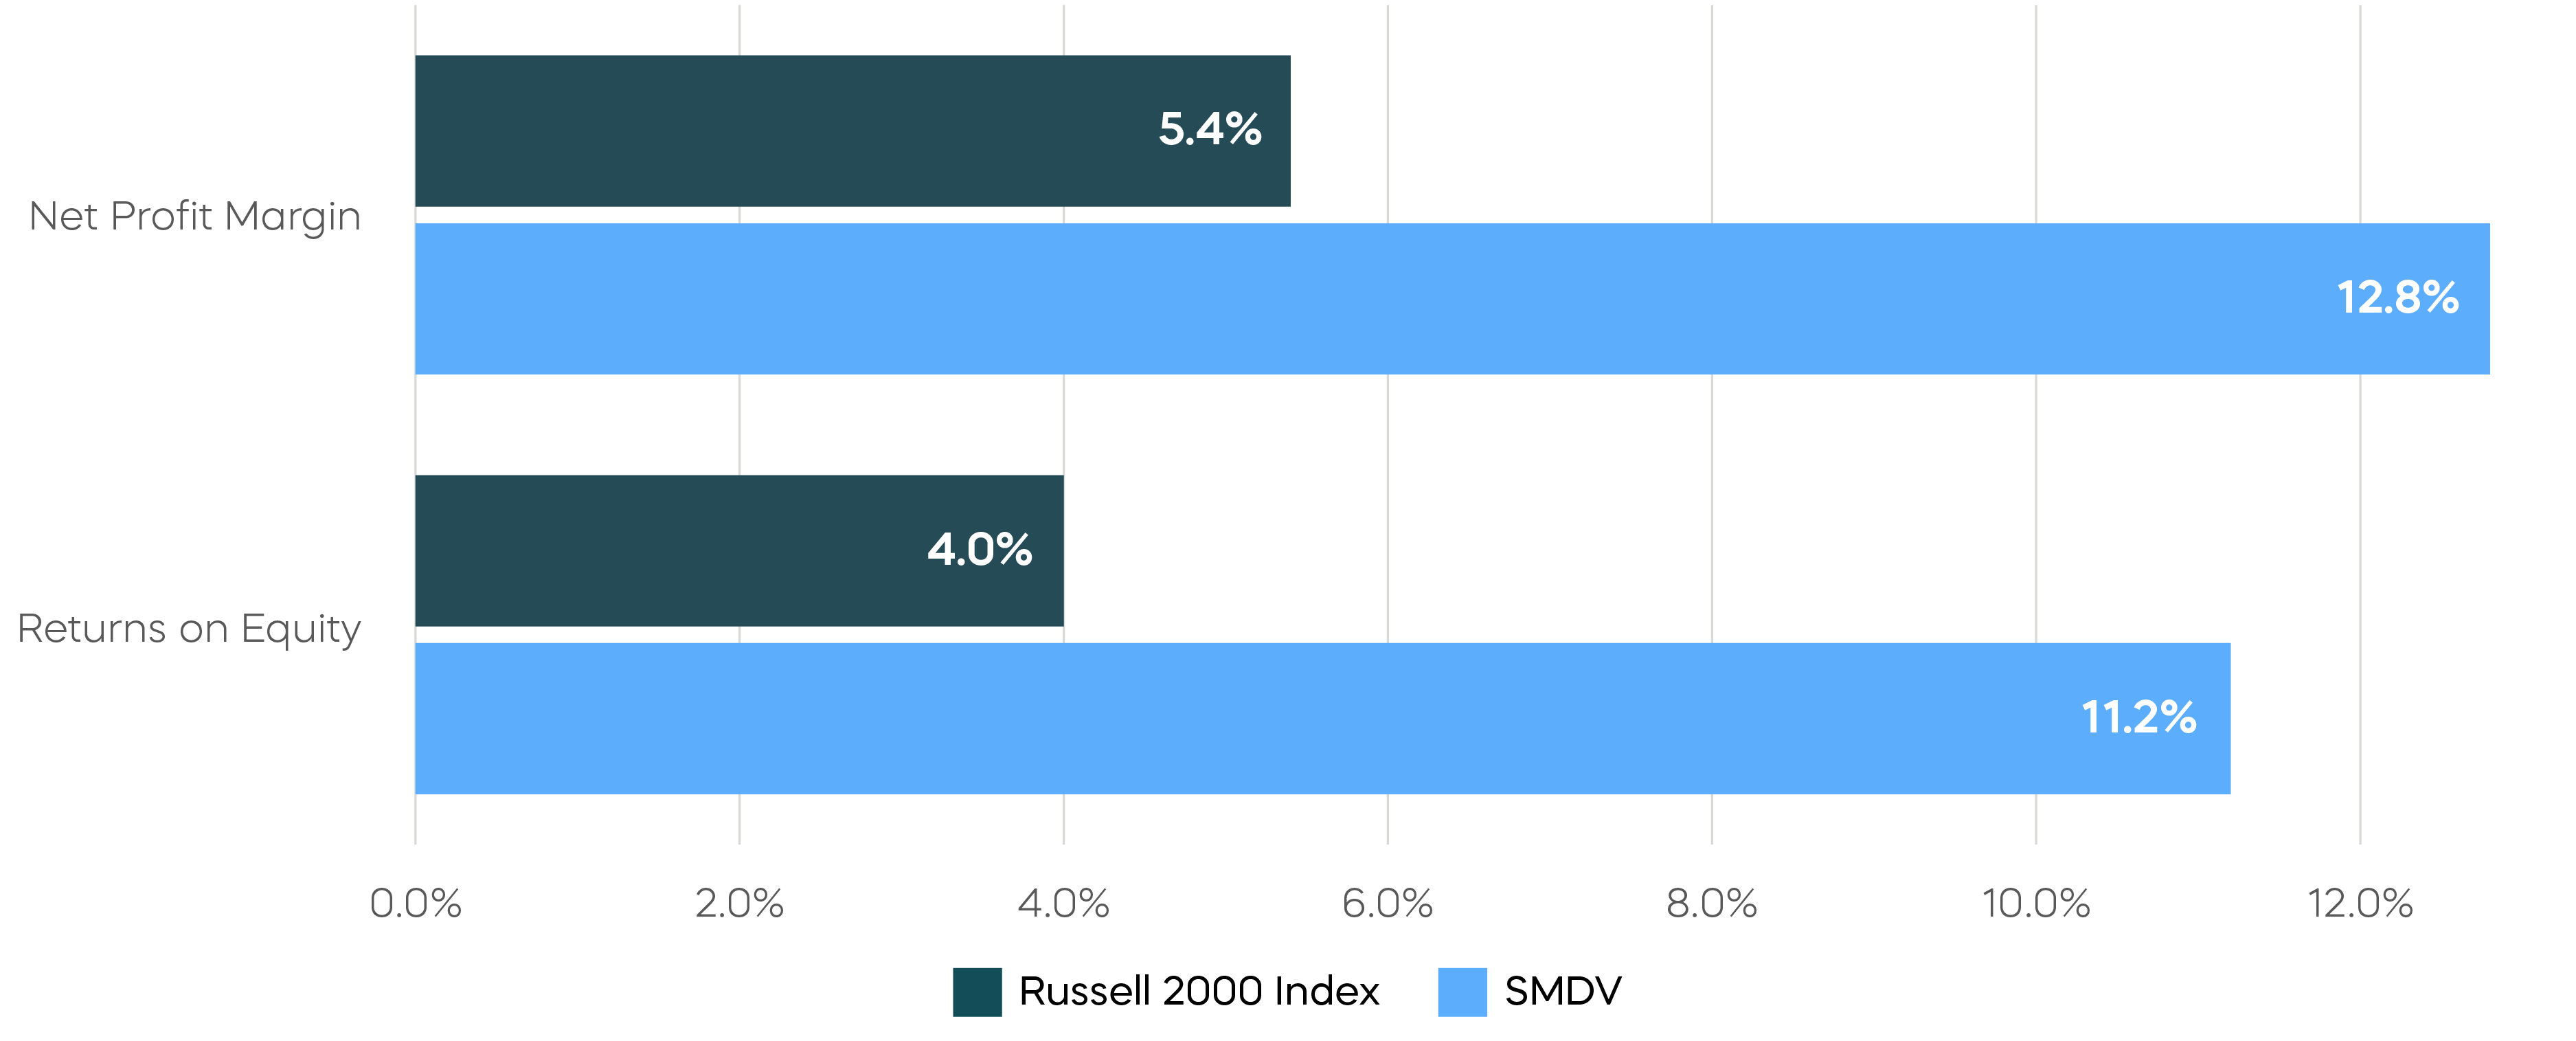
Small-cap dividend growers have produced almost 3x the return on equity compared to the Russell 2000 Index, and profit margins more than twice as high.
SMDV tracks the Russell 2000 Dividend Growers Index, which requires members to have grown their dividends for at least 10 consecutive years.[5] Small-cap dividend growers have produced almost three times the return on equity compared to the Russell 2000 Index, and profit margins more than twice as high (see chart). Since its inception, SMDV’s index has rewarded investors by delivering higher risk-adjusted returns compared to the Russell 2000 Index.
Small Cap Dividend Growth Stocks Have Been High Quality
The Takeaway
With improving economic growth, additional rate cuts from the Fed, and improving earnings, small-cap stocks could continue their rally relative to large caps. Innovative, index-based strategies like the ProShares Russell 2000 High Income ETF (ITWO) and the ProShares Russell 2000 Dividend Growers ETF (SMDV) can provide investors the opportunity to earn high levels of income and focus on high quality stocks.
[1] Source: Morningstar.com, “3 Ways Private Companies Are Reshaping Public Markets,” 9/24/25.
[2] Source: Bloomberg, data as of 8/31/25, based on average 1-, 2-, and 3-year performance subsequent to the final rate cut of the prior five Fed rate cut cycles.
[3] ITWO gains exposure to the sale of daily call options using swap agreements and does not trade options.
[4] Source: Bloomberg, data as of 9/29/25.
[5] If fewer than 40 stocks meet criteria, the index may include companies with shorter dividend growth histories. Special dividend payments are not taken into consideration. There is no guarantee dividends will be paid. Companies may reduce or eliminate dividends at any time, and those that do will be dropped from the index at reconstitution.
Learn More
ITWO
Russell 2000 High Income ETF
ProShares Russell 2000 High Income ETF seeks investment results, before fees and expenses, that track the performance of the Cboe Russell 2000 Daily Covered Call Index.
SMDV
Russell 2000 Dividend Growers ETF
Seeks investment results, before fees and expenses, that track the performance of the Russell 2000® Dividend Growth Index.