Key Observations
Making the case for potential rate cuts in his recent speech at Jackson Hole, Fed Chair Powell noted that policy is presently in restrictive territory. The current combination of a weakening labor market and inflation stubbornly above the Fed’s 2% target could suggest that the Fed wants to move from restrictive territory to neutral territory.
- Estimates point to a real Fed Funds rate (the Fed Funds rate, minus inflation) of 0.5–1% as being neutral.
- If inflation reaches the Fed’s target of 2%, a neutral Fed Funds rate would be in the 2.5–3% range.
- With current inflation just below 3%, a neutral Fed Funds rate would be in the 3.5–4% range.
- Taking even the high end of this estimate suggests that the Fed could cut 50 basis points and not go past neutral.
This is important because a decision to take the Fed Funds rate below neutral and into stimulative territory could stoke expectations for longer-term inflation and drive longer-term interest rates higher. A move to neutral territory, however, carries less of this risk, meaning that the Fed probably has some room.
While many eyes have been focused on the labor market, Capacity utilization—a key measure of the U.S. economy’s manufacturing state of play—seems to suggest there is slack in the economy. That also gives the Fed room to ease monetary policy with limited risk of stoking inflation expectations.
Chart of the Month
Quarterly Capacity Utilization 1967-2025
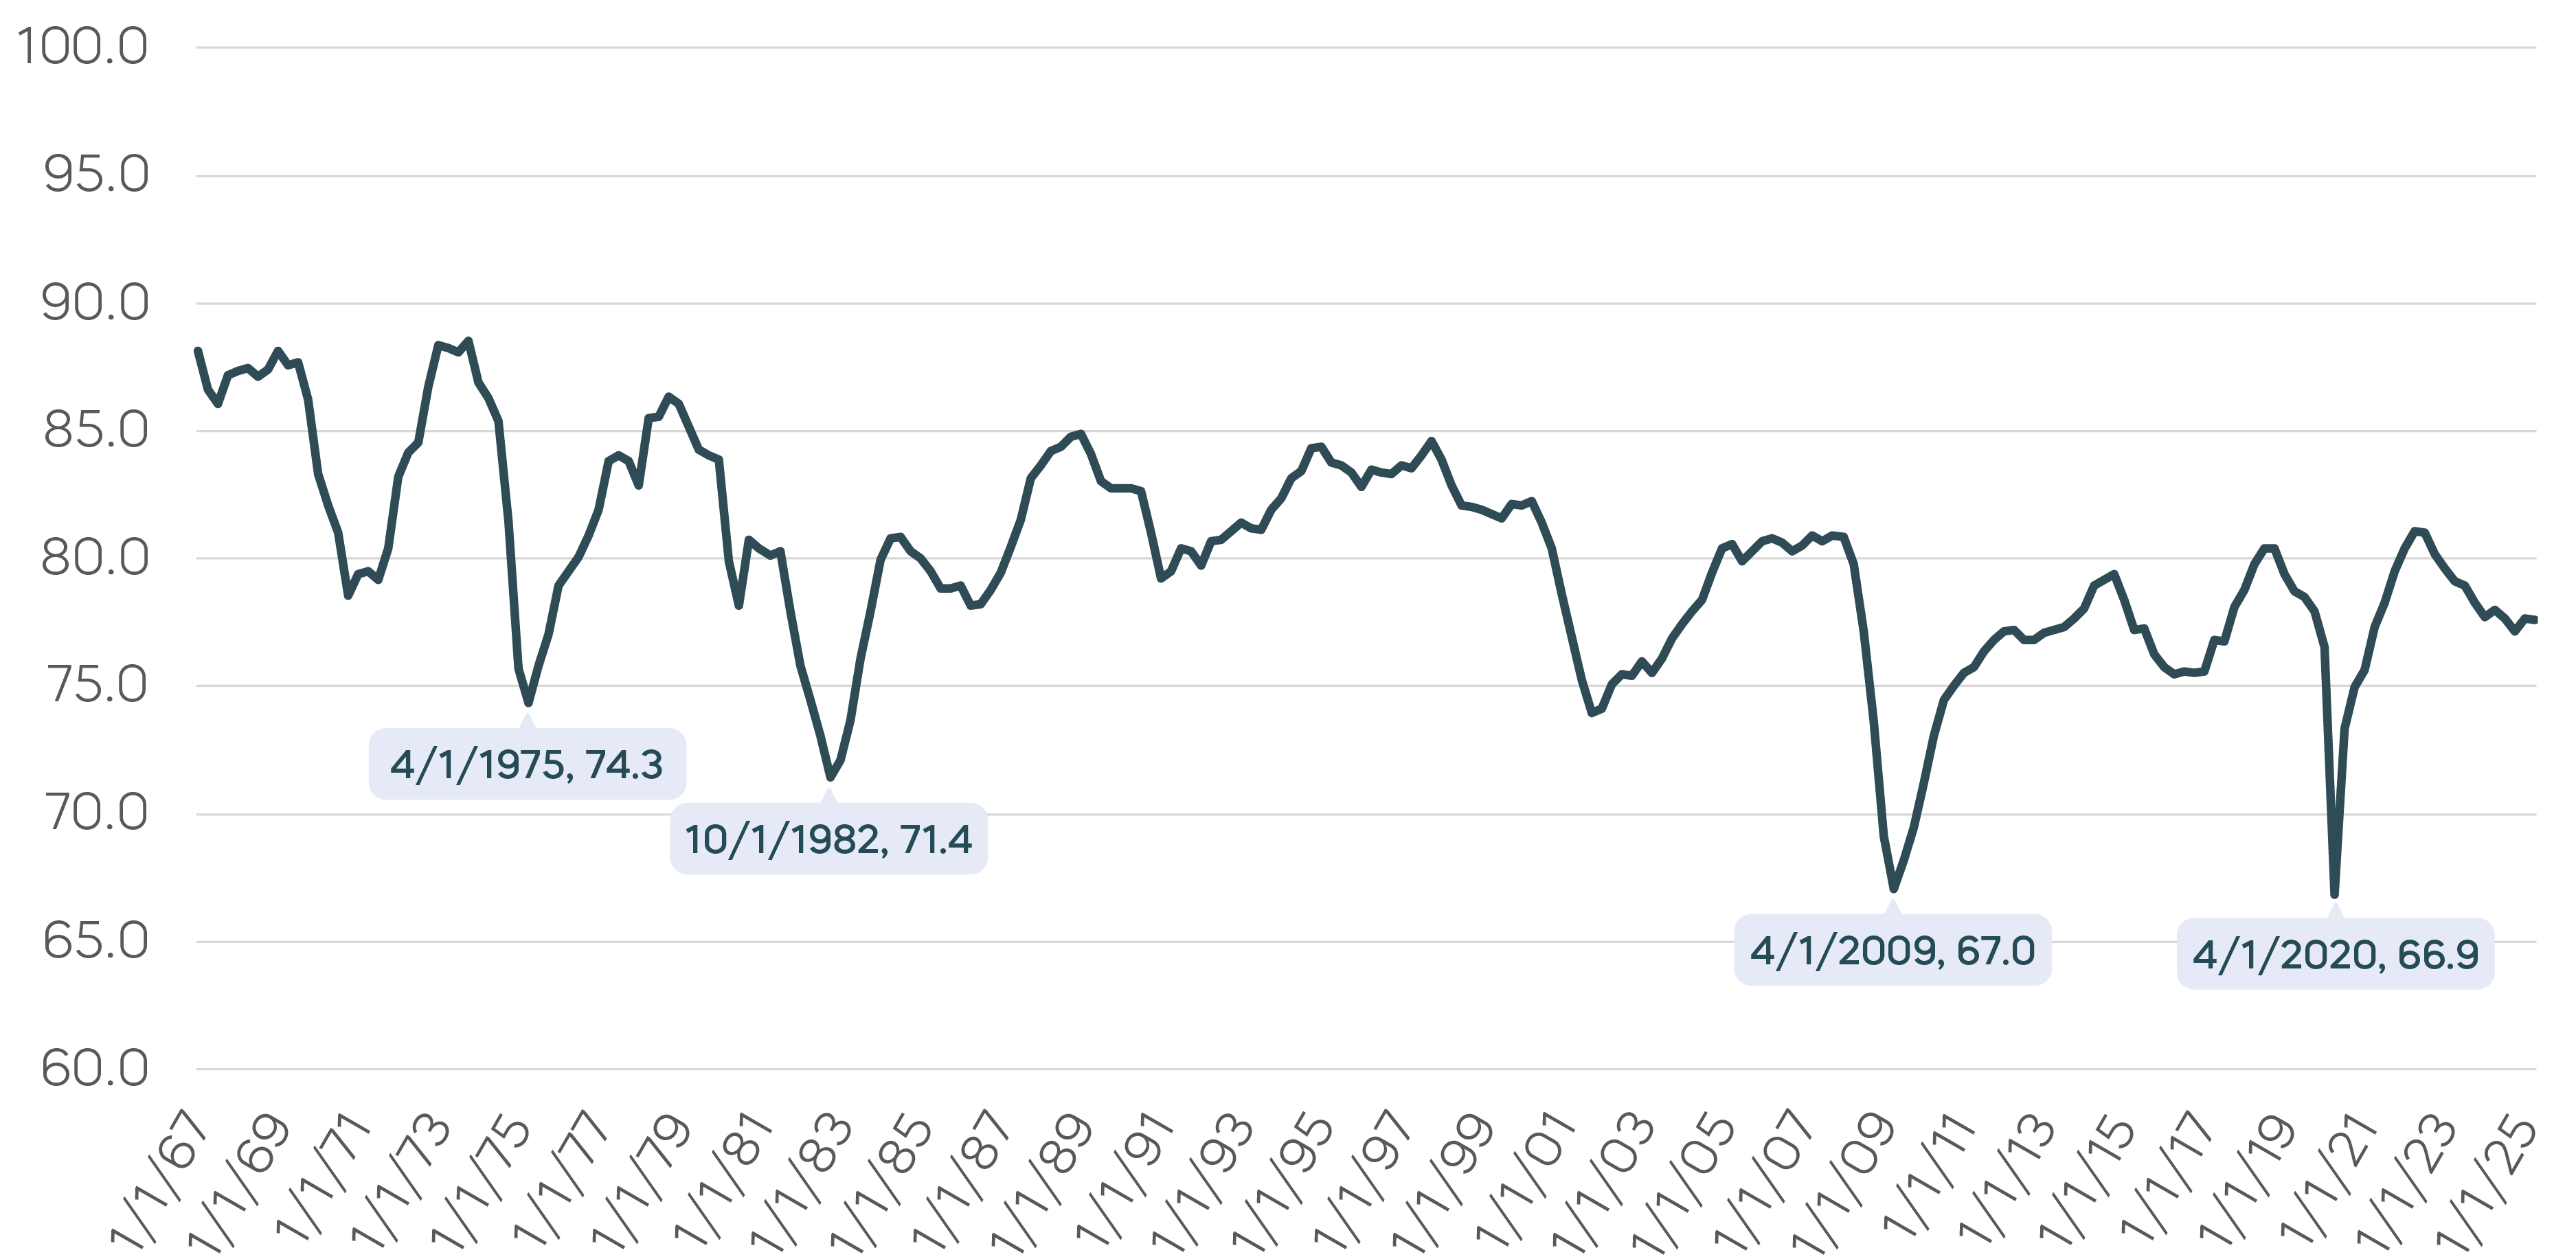
Source: Federal Reserve Economic Data, Federal Reserve Bank of St. Louis, Capacity Utilization: Total Index, Percent, Quarterly, Seasonally Adjusted. Data as of 8/15/25.
Capacity utilization stands at 77.5% today, which is in line with its 15–20 year average, leading many to see the economy operating at a neutral capacity—neither indicating slack nor overheating.
But this perception may be skewed by two key events of the past 20 years: the Great Financial Crisis and the COVID pandemic. During each instance, Capacity utilization dropped into the 60% range. In the 40 years prior to the GFC, the average was 81.4%, and its low was 71.4% during the recession of the early 80’s. Even the challenging economy of the 70’s saw a low of just 74.4%. This is why the rule of thumb is that any reading below 80% indicates slack capacity and little inflationary pressure.
Returning to today, while a 50 bps reduction in the Fed Funds rate may not increase inflation expectations, don’t expect much of a reduction in longer-term interest rates either. And if those 10- and 30-year Treasury rates remain stable, the benefits to stocks could be limited.
One exception could be small-cap stocks. Their typically weaker balance sheets and often shorter-term debt maturities are usually seen as a weakness, but small-caps may be outsized beneficiaries of Fed Rate cuts.
Asset Class Perspectives
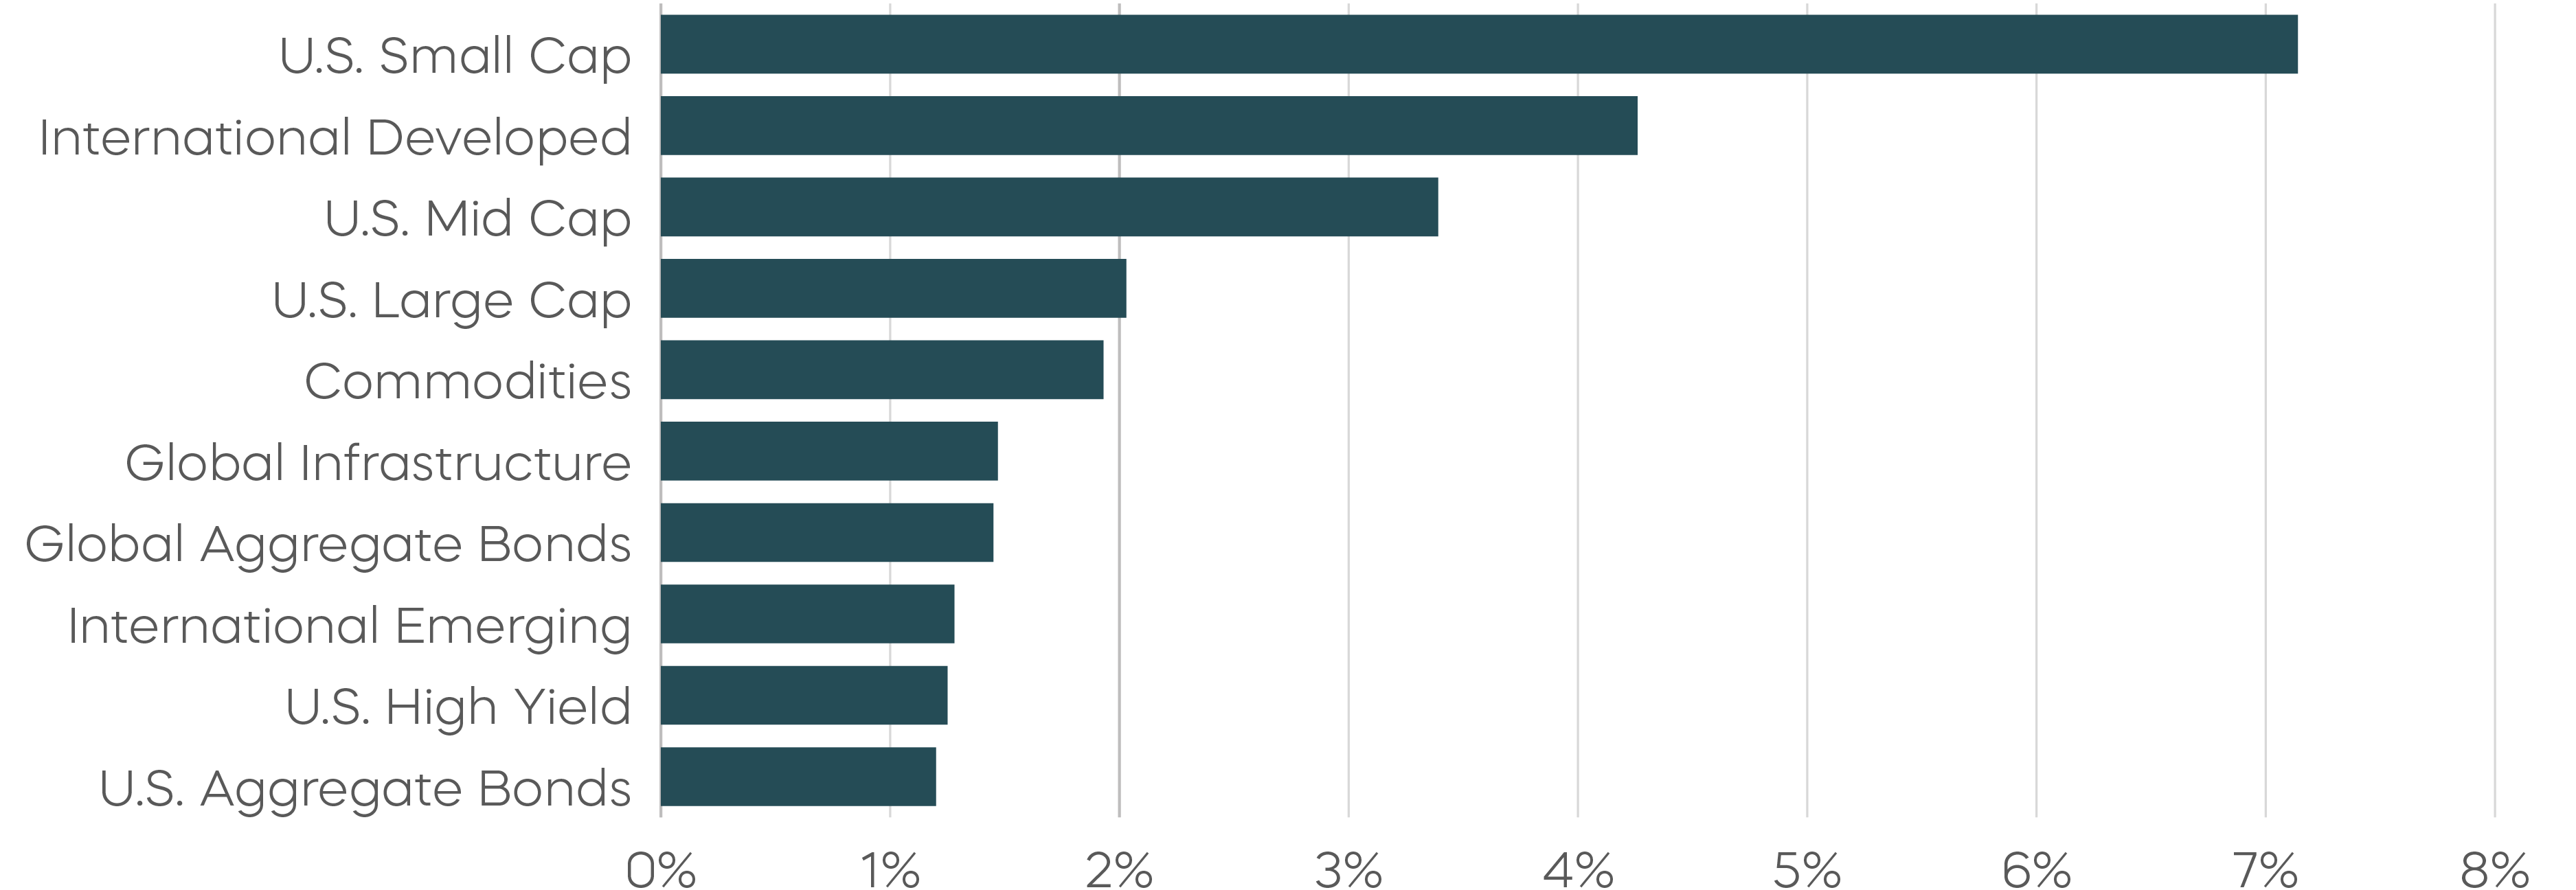
Asset Class Returns—August 2025
Asset Class Returns—Year-to-Date
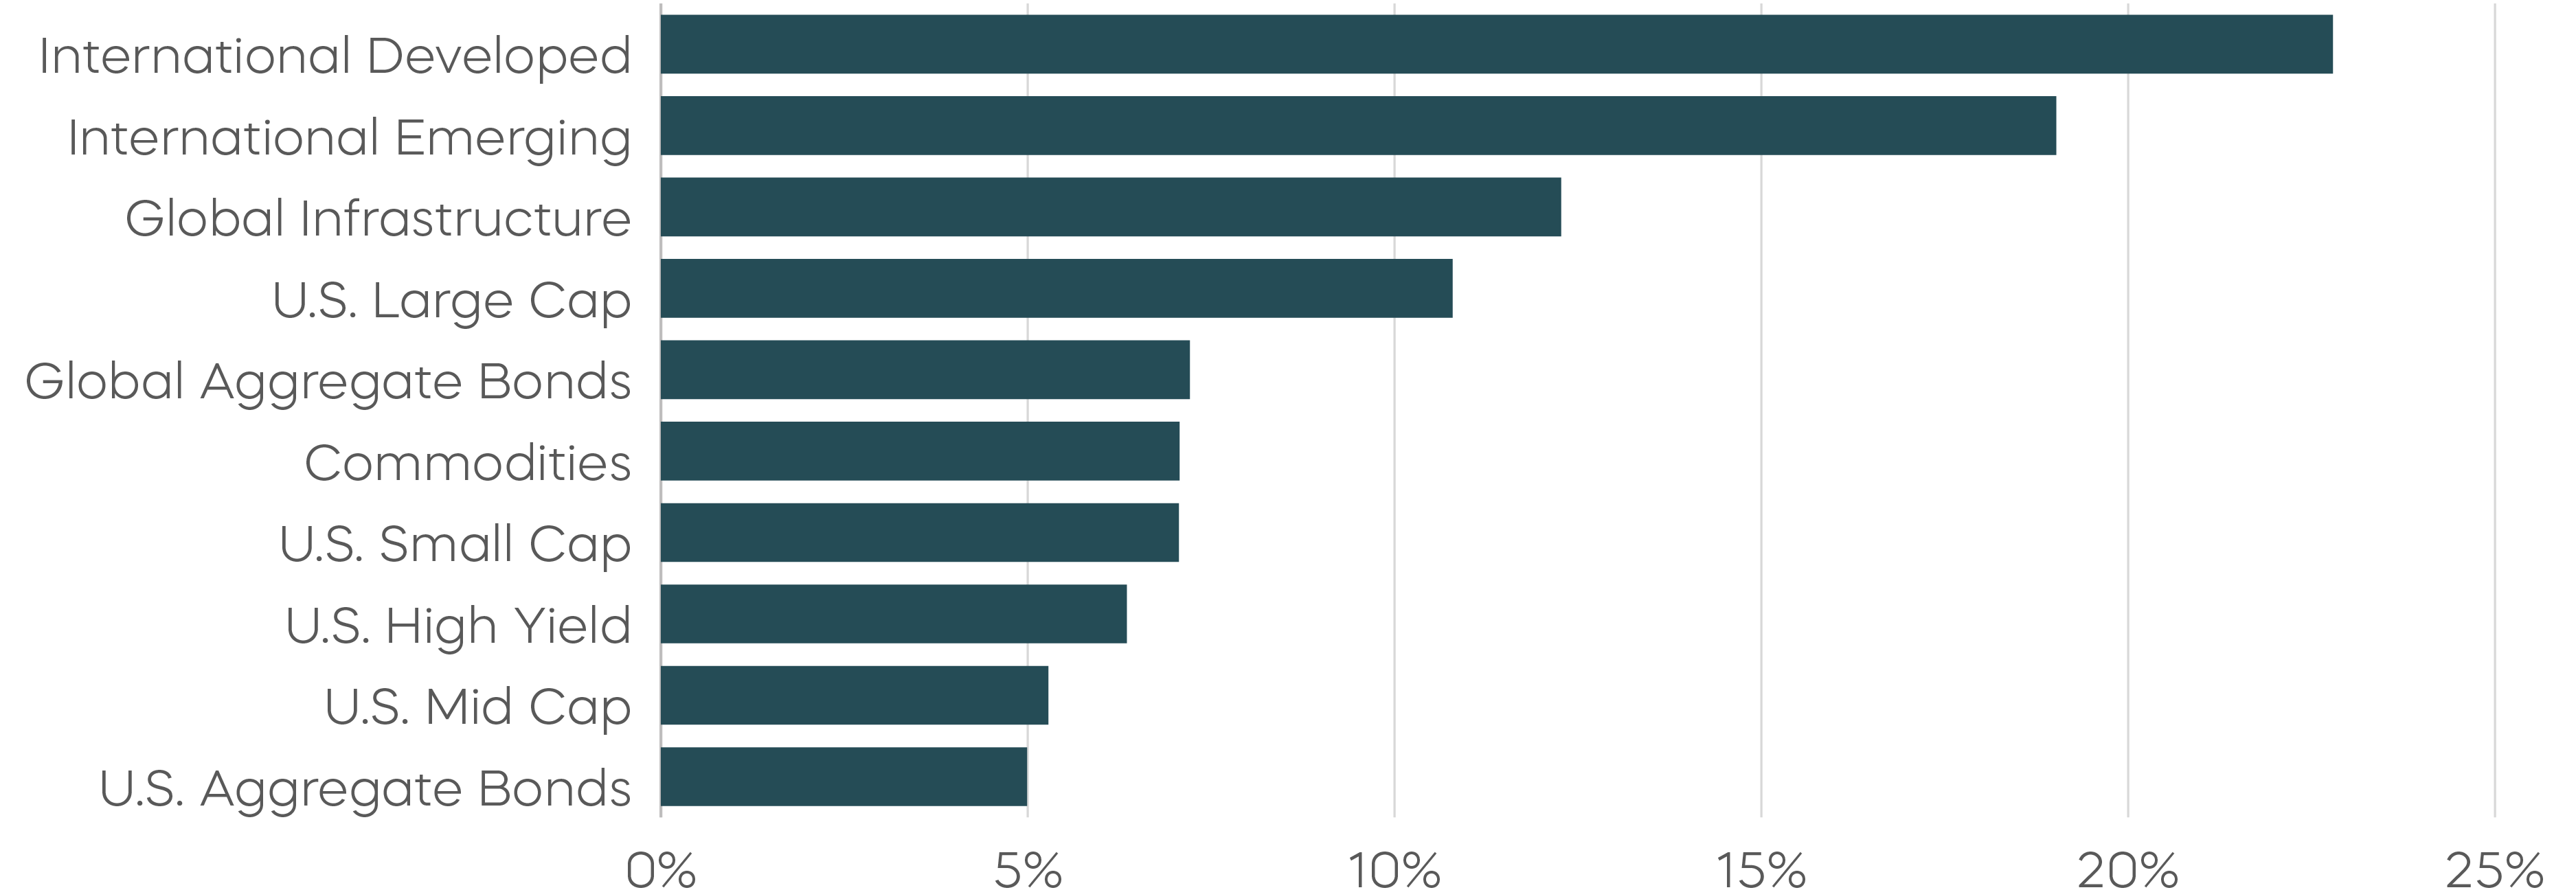
Source: Bloomberg. August returns 8/1/25–8/31/25; year-to-date returns 1/1/25‒8/31/25. Index returns are for illustrative purposes only and do not reflect any management fees, transaction costs or expenses. Indexes are unmanaged, and one cannot invest directly in an index. Past performance does not guarantee future results.
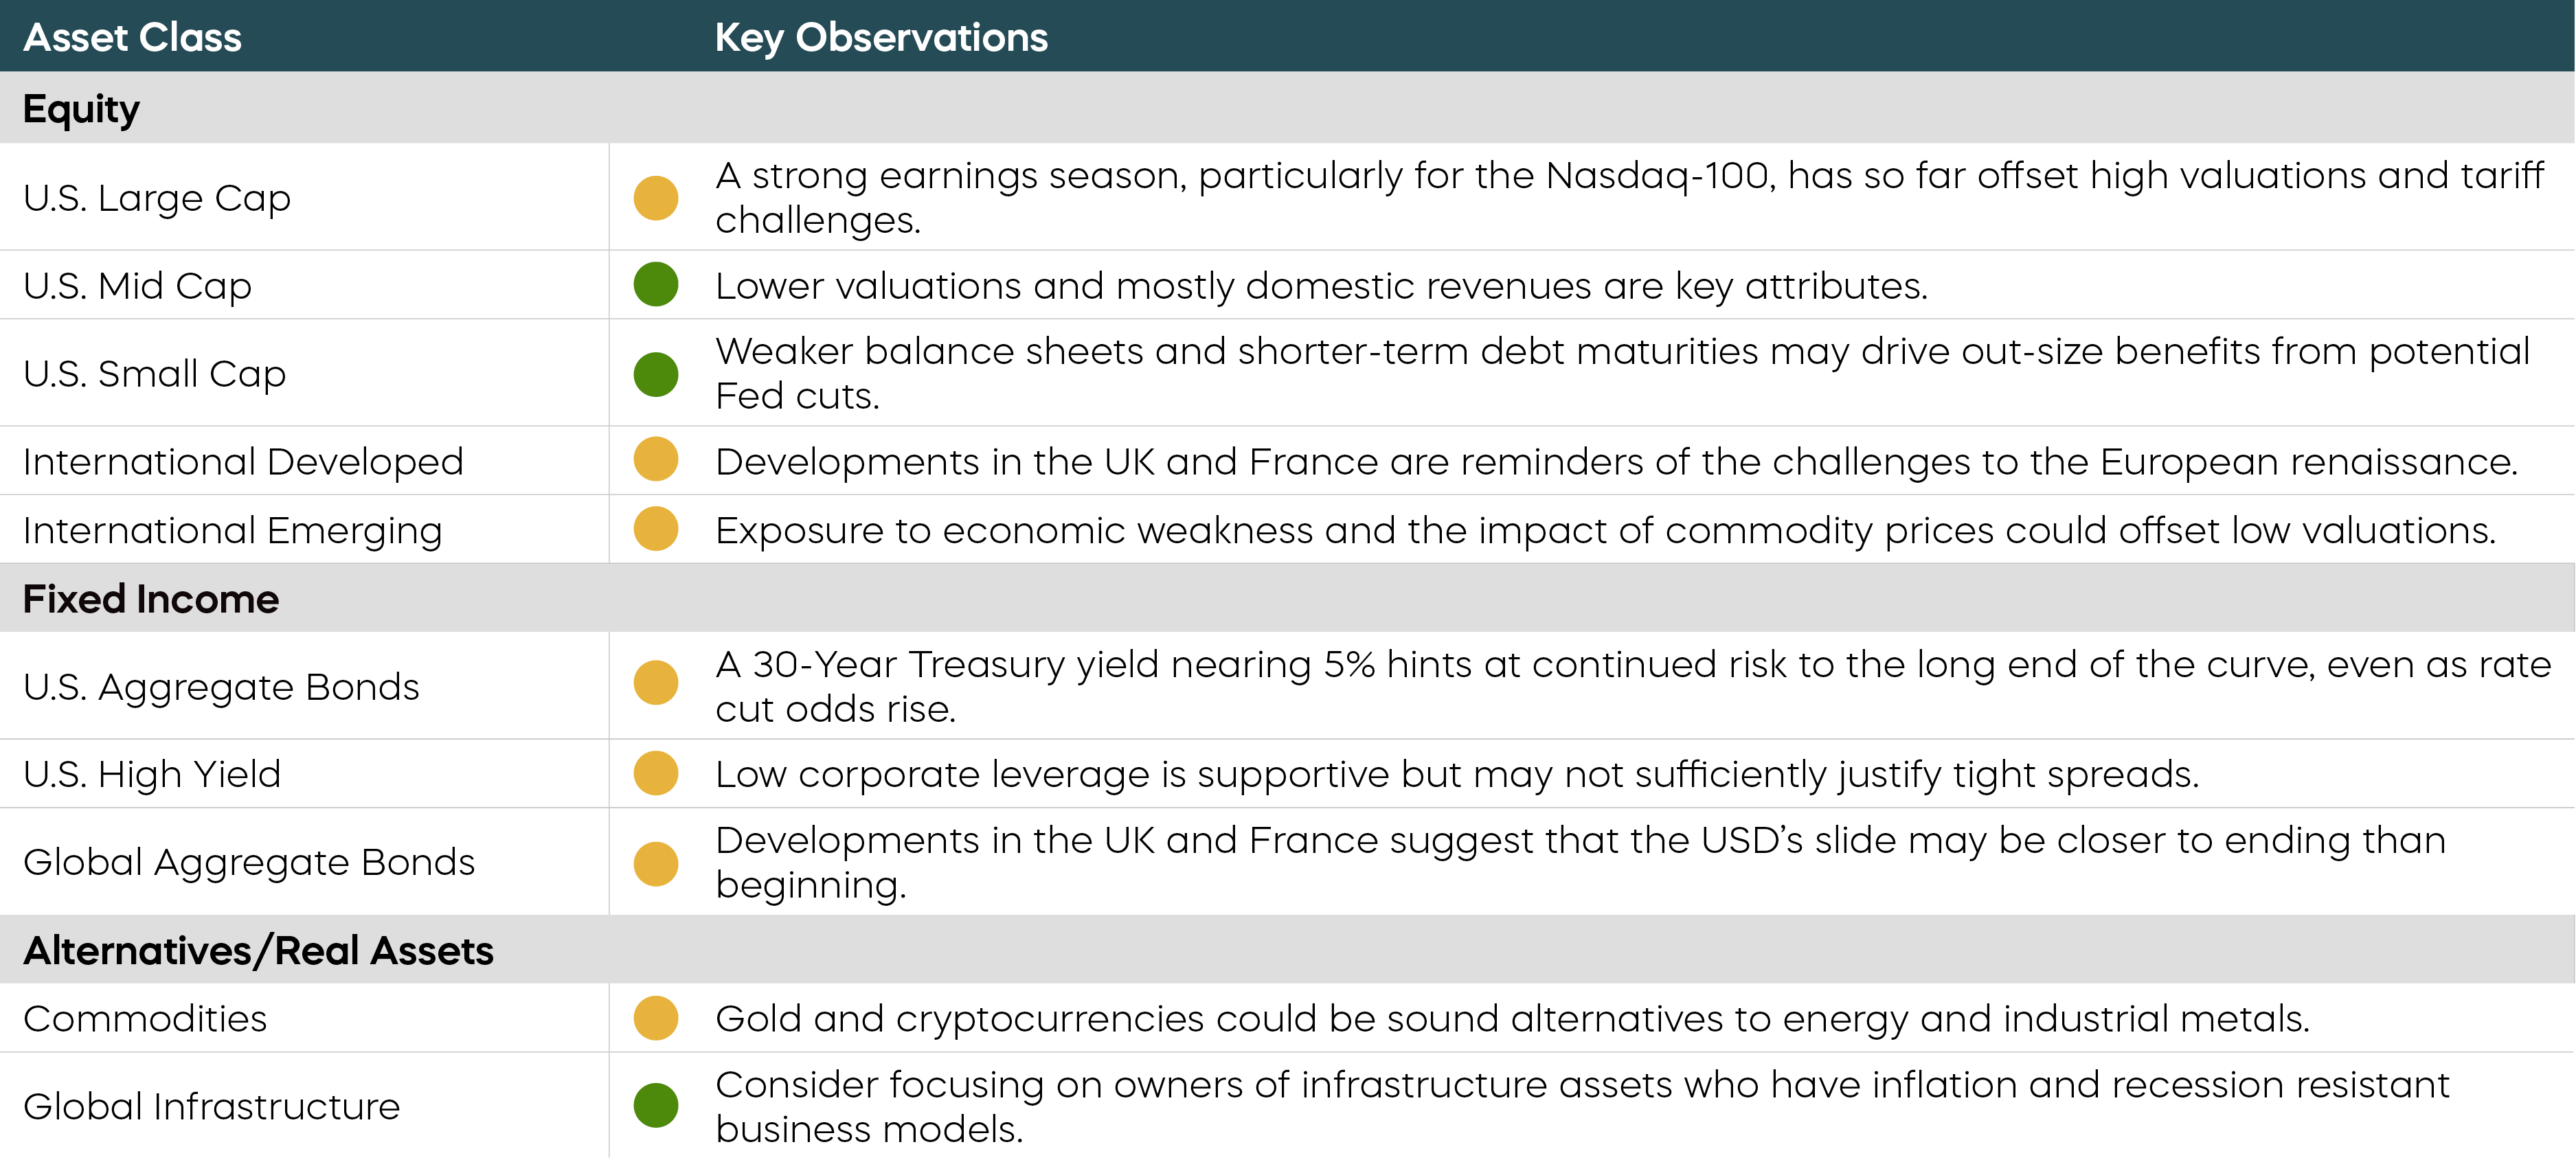
The following are observations on a range of asset classes. For each, green indicates a constructive backdrop, yellow indicates a neutral environment, and red would indicate a challenging backdrop.
Economic Calendar
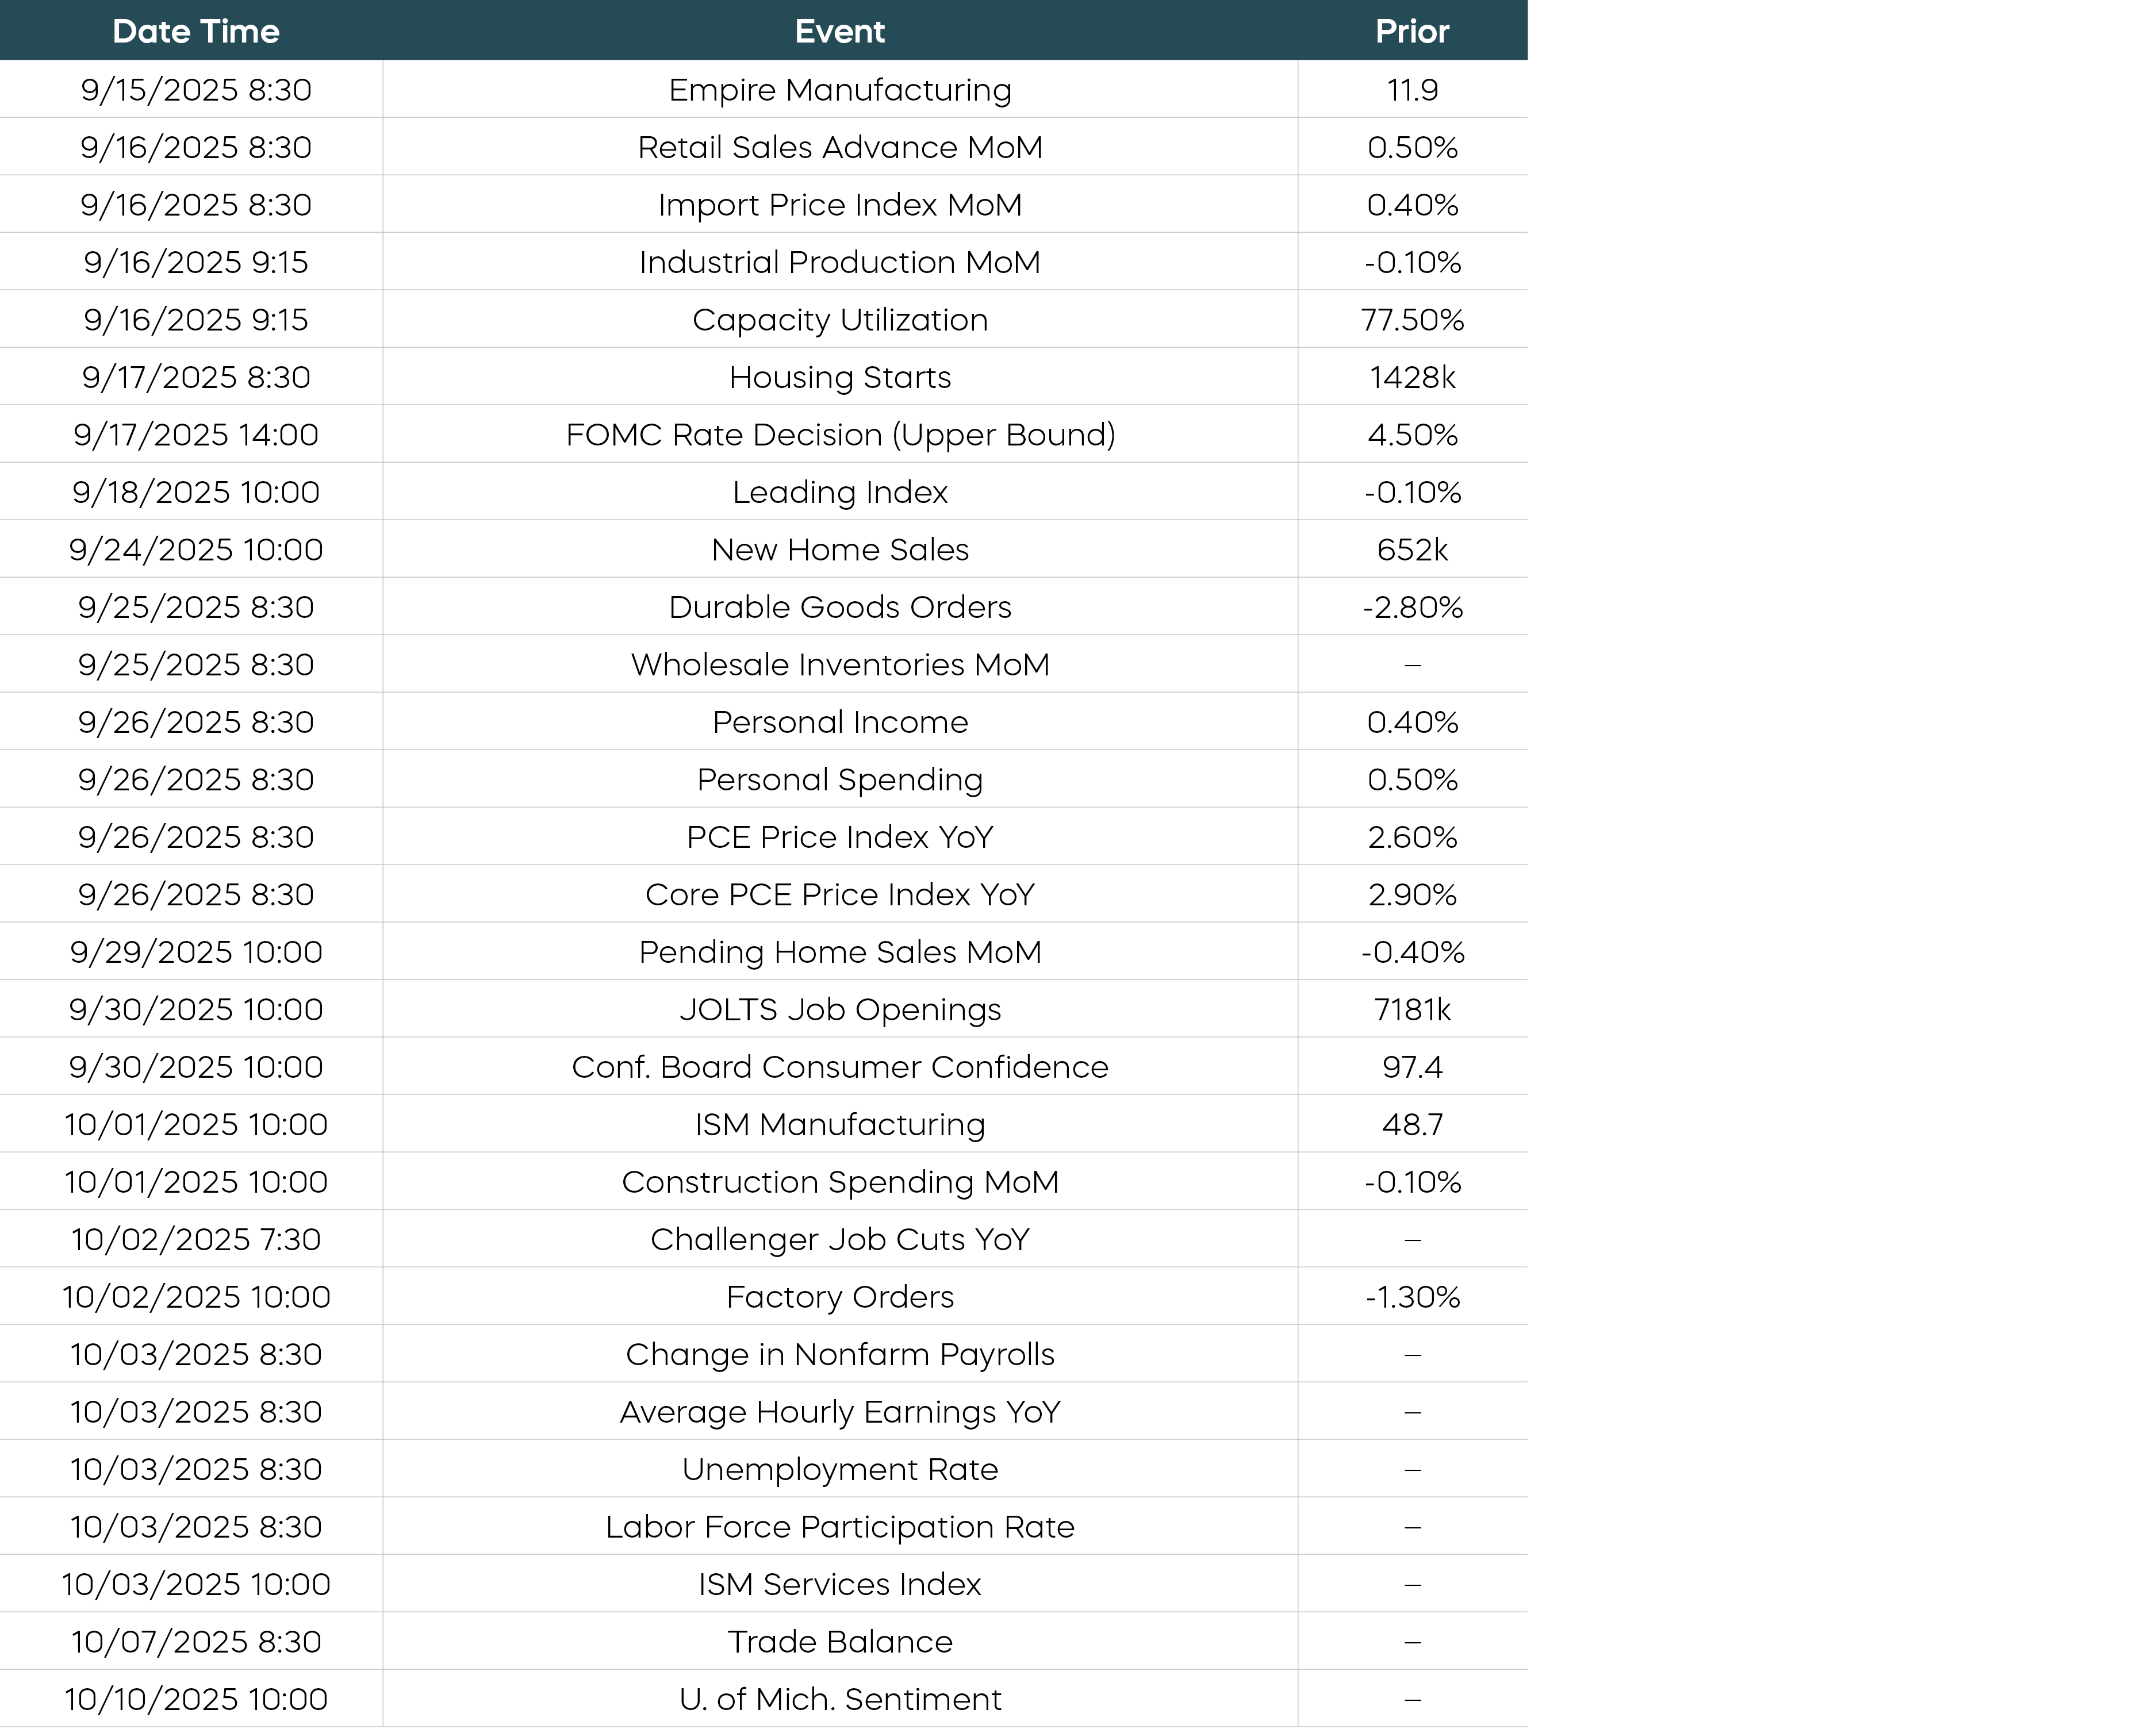
Source: Bloomberg. Data as of 8/4/25.
Equity Perspectives
Small-Caps Take the Lead—Is It Sustainable?
Despite August ending on a down note, the S&P 500 delivered its fourth consecutive month of positive returns, with gains of just over 2%. A stellar earnings season has been driving markets, with Q2 earnings marking the third consecutive quarter of double-digit earnings growth for the S&P, according to FactSet. And Fed Chair Powell’s speech at Jackson Hole signaling potential rate cuts on the horizon delivered more fuel for the rally.
Notably, despite recent large cap dominance, smaller company stocks led the market for August. The S&P MidCap 400 Index (up 3.4%) and the S&P SmallCap 600 Index (up 7.1%) both outperformed large caps.
Smaller company outperformance following Fed easing cycles is nothing new though. As we approach the one-year anniversary of the first cut in this current cycle, it’s worth reviewing the performance over the prior five cycles. On average, both small- and mid-cap stocks have meaningfully outperformed large caps in both the two- and three-year periods following the end of the rate cut cycles.
Mid- and Small-Cap Stocks Have Outperformed After Prior Rate-Cut Cycles
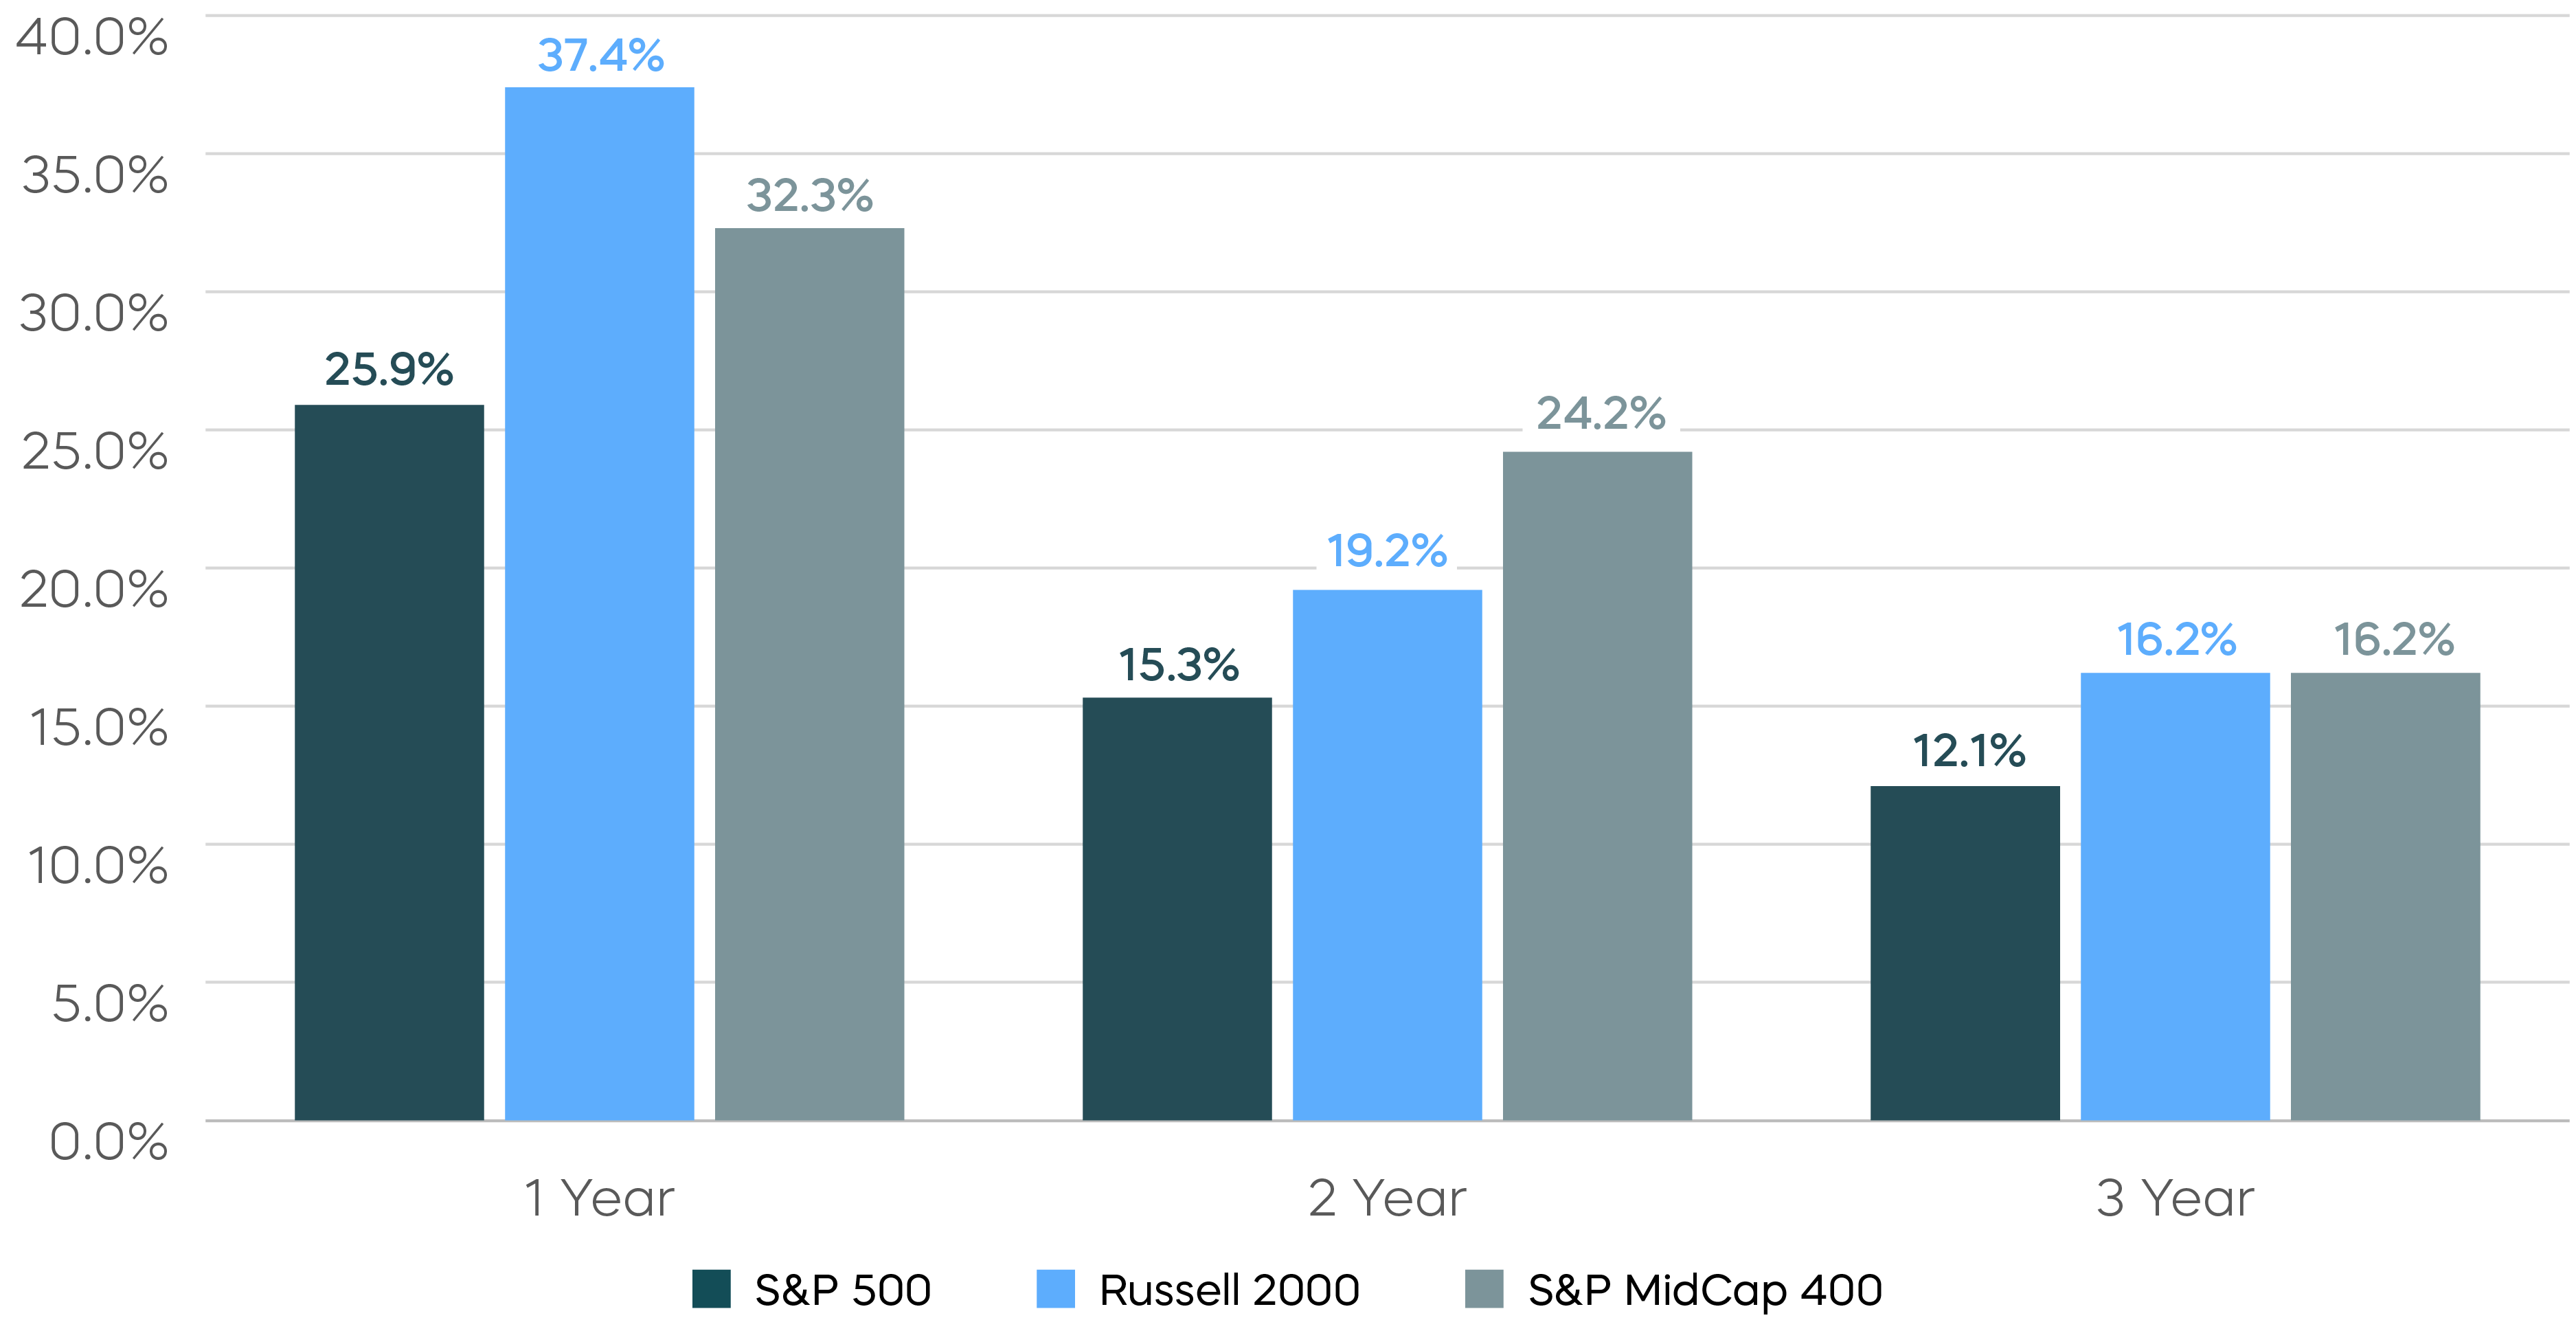
Source: Bloomberg, data as of 8/31/25. Data shows the average 1-, 2-, and 3-year performance subsequent to the final rate cut of the prior five Fed rate cut cycles. Index returns are for illustrative purposes only and do not reflect any management fees, transaction costs or expenses. Indexes are unmanaged, and one cannot invest directly in an index. Past performance does not guarantee future results.
Time will tell if more rate cuts will be a catalyst for continued outperformance, or just another head-fake in what has been a frustrating run of underperformance for small-cap investors. But one factor that has seemed to hold smaller companies back of late has been earnings.
We entered 2025 with expectations of double-digit earnings growth for large-, mid- and small-cap stocks. Only large caps have delivered thus far. Earnings for both mid-caps and small-caps have disappointed, and the full year 2025 estimates have been revised down as the year has progressed.
On the bright side, the technical set-up for small-caps appears favorable. The Russell 2000 Index’s 50-day moving average recently passed its 200-day moving average—a pattern known as a “golden cross.” According to Bespoke Investment Group, this pattern has historically been followed by better-than-average forward returns. Expectations for earnings growth for the remainder of 2025 and into 2026 are also robust. And more rate cuts will undoubtedly help, as the average mid- and small-cap stock remains more leveraged than their larger-cap peers. There, lower debt-servicing costs could prove to be the earnings jolt small-caps need.
A Next-Generation Small-Cap Strategy with High Income Potential
With rate cuts on the horizon, it’s important to remember that income investors have choices beyond bonds. Small-cap stocks may not be top of mind, but investors seeking to capture upside along with a high level of monthly income have a compelling opportunity.
Covered call strategies focused on small-cap stocks have the potential to harvest higher levels of implied volatility into greater levels of income than strategies focused on S&P 500 stocks. But there’s a catch: Traditional covered call strategies use monthly options. By doing so, they tend to sacrifice significant returns in their quest for high levels of income.
The Cboe Russell 2000 Daily Covered Call Index offers something different. Powered by a daily options strategy instead of the traditional monthly approach, investors can seek high levels of income, target the returns of the Russell 2000, and potentially capture total returns that traditional covered call strategies have sacrificed.
Fixed Income Perspectives
Is 3% the Market’s North Star?
At this year’s Jackson Hole symposium, Fed Chair Powell offered remarks that set the stage for a potential September rate cut. His message carried a dovish tone, with two key takeaways related to unemployment and tariffs.
First, Powell underscored that while unemployment remains low, the balance between labor supply and demand is potentially fragile. Both have slowed, suggesting that a negative shock could cause unemployment to rise quickly. And while tariffs are expected to lift consumer prices in the coming months, the Fed has said they view them as a one-time shock, not the start of an inflation spiral. This perspective strengthens the Fed’s bias toward protecting labor market health over inflation risks.
Markets responded to Powell’s remarks as most would expect. Short-term Treasury yields fell, while long-term yields rose, widening the 2-year/30-year spread by 36 basis points in August. This move reflects how different forces drive short- and long-term rates:
- The near-term rate path depends heavily on Fed policy.
- The rates of longer maturities typically hinge on structural drivers, such as demographics, productivity, and fiscal conditions.
If the Fed shifts its currently restrictive policy to a neutral stance, that would typically have the strongest impact on short-term interest rates. A useful gauge of expectations is the 1-month rate, two years forward. So called “forward rates” represent the interest rate implied by today’s market pricing for a future period.
Despite policy rates peaking at 5.5% in the post-COVID cycle, forward rates have remained between 3% and 4% during the past few years, suggesting that markets anticipate a return to a neutral Fed policy stance. Currently, Secured Overnight Financing Rate (SOFR) swaps seem to be pricing in that short-term interest rates could fall to 3% within the next two years, which is aligned with the FOMC’s latest estimate of the long-run policy rate.
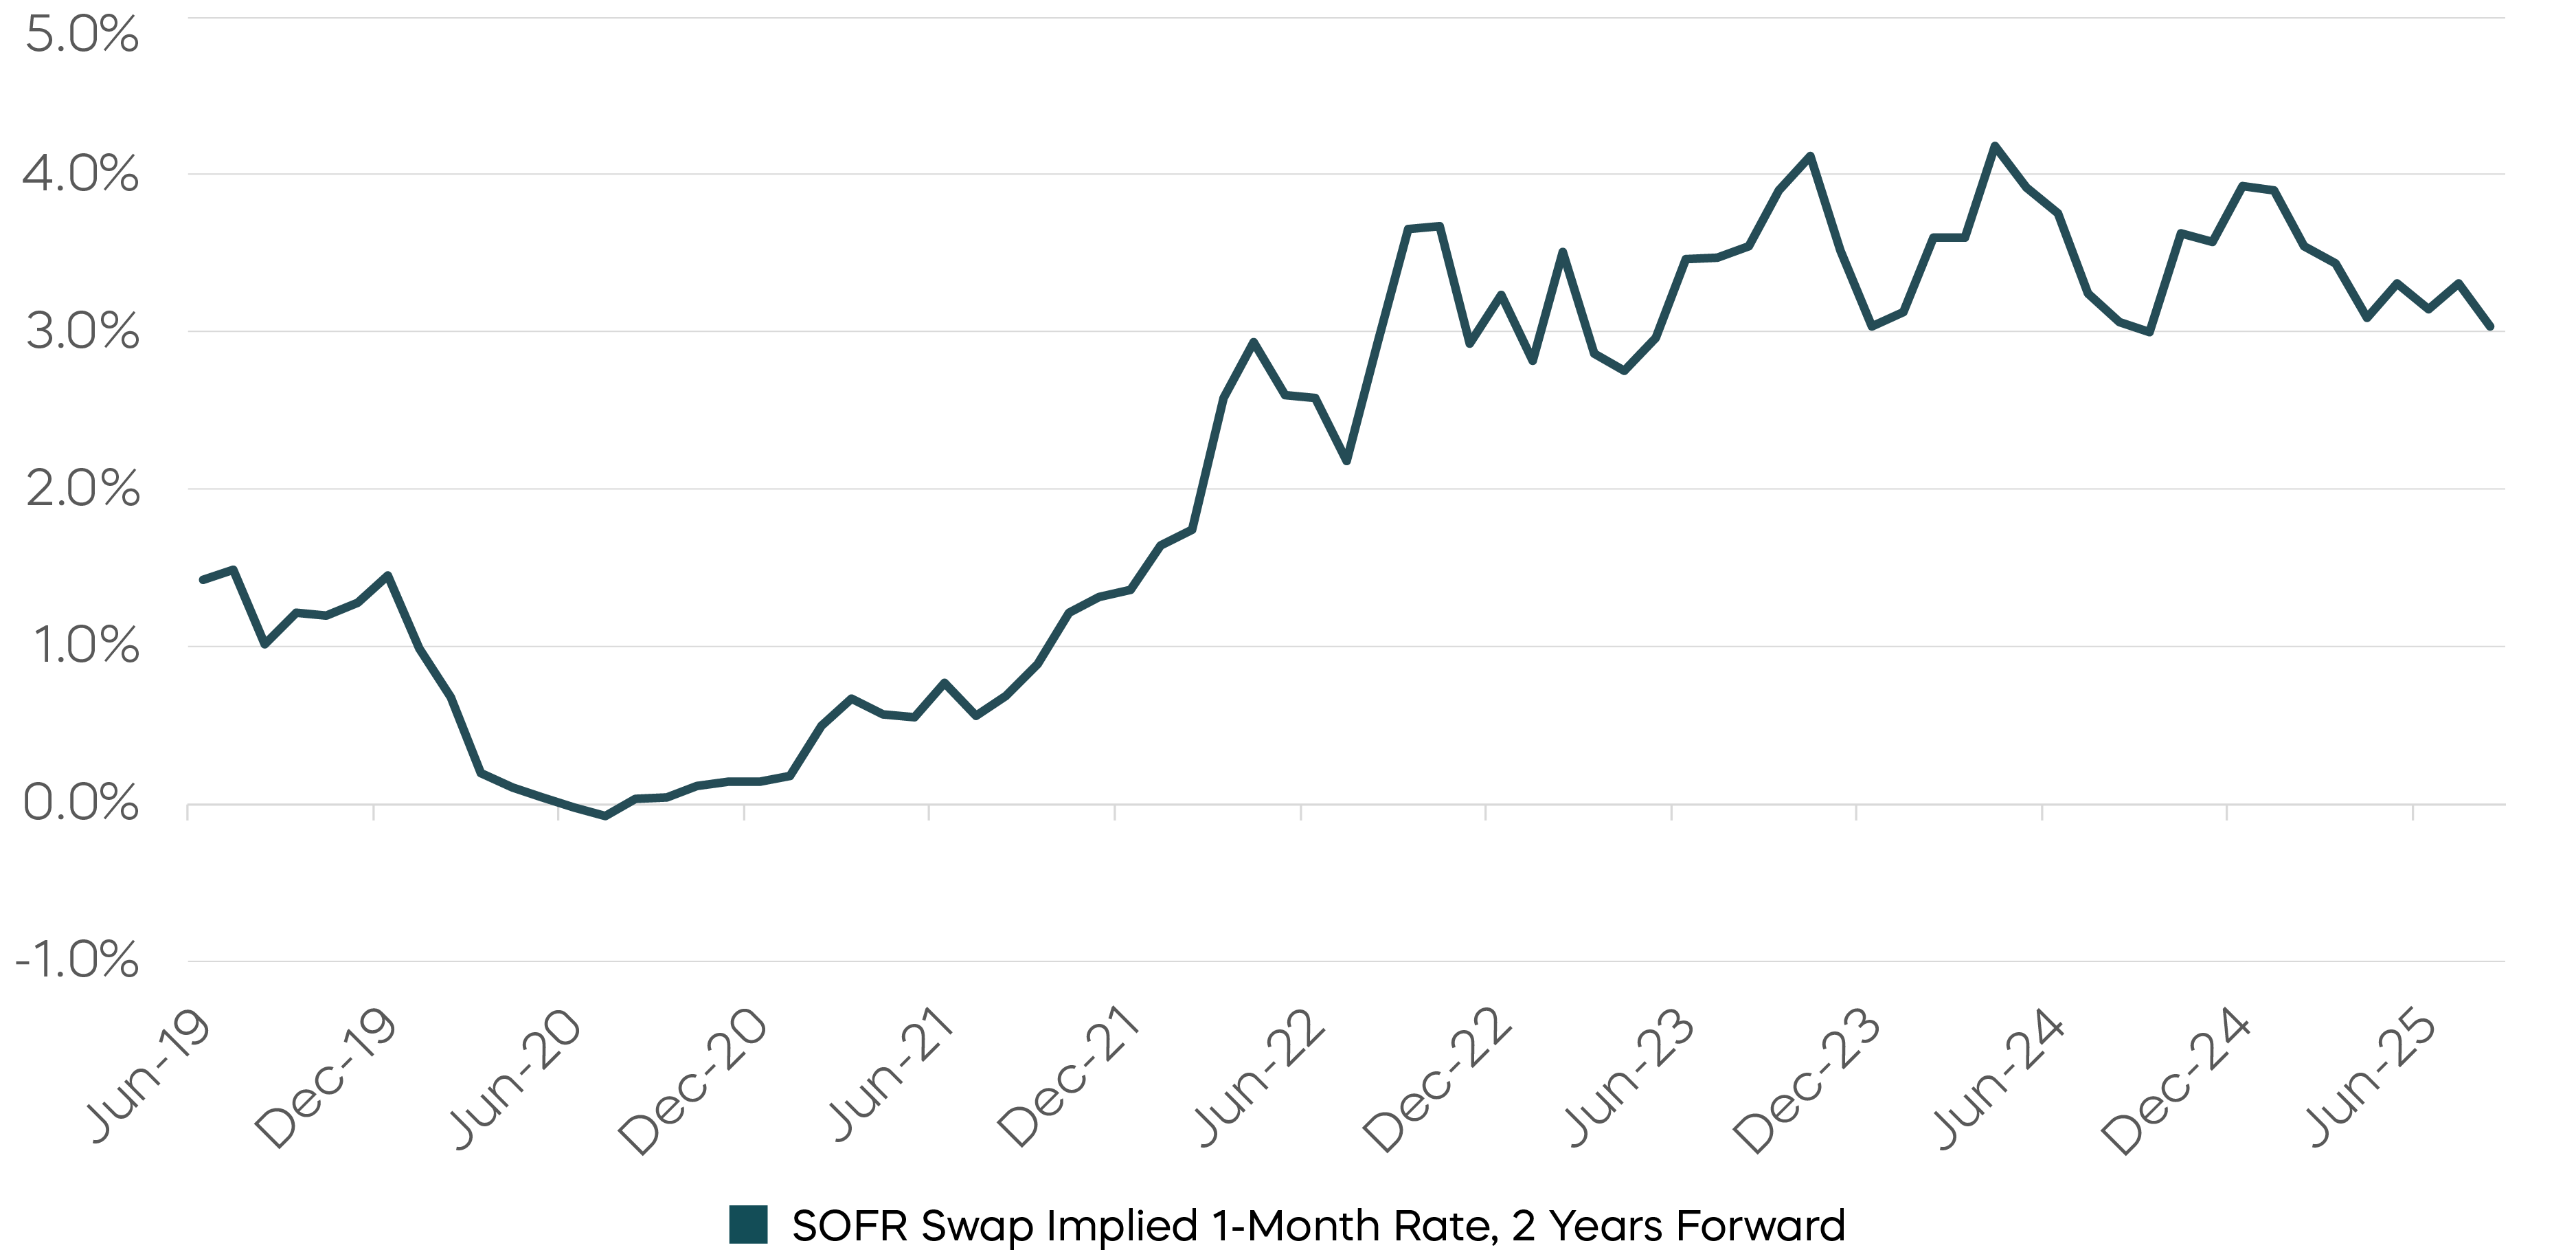
Source: Bloomberg, monthly data as of 8/29/25.
If markets are reflecting a conviction that monetary policy should normalize to neutral, as Powell hinted at Jackson Hole, the key question is whether 3% can serve as the north star for short-term rates.
To answer that, we need to look beyond market-implied pricing and examine rate expectations modeled on economic data instead. By combining long-run inflation expectations with estimates of the real short-term rate, we arrive at a rate level consistently pointed near 3% since the Great Financial Crisis. The projection hovered slightly below 3% in the pre-COVID period and has been slightly above 3% in the years since.
Comparing forward rates against our model over a longer period of time shows substantial correlation between them, reinforcing our model’s role as a potentially useful benchmark for neutral policy.
Another observation, however, is that forward rates have often signaled a more accommodative policy path than what would typically prevail at full employment and stable inflation. This pattern perhaps reflects the Fed’s tendency to cut rates aggressively in response to past economic slowdowns, leaving an imprint on market expectations in the future.
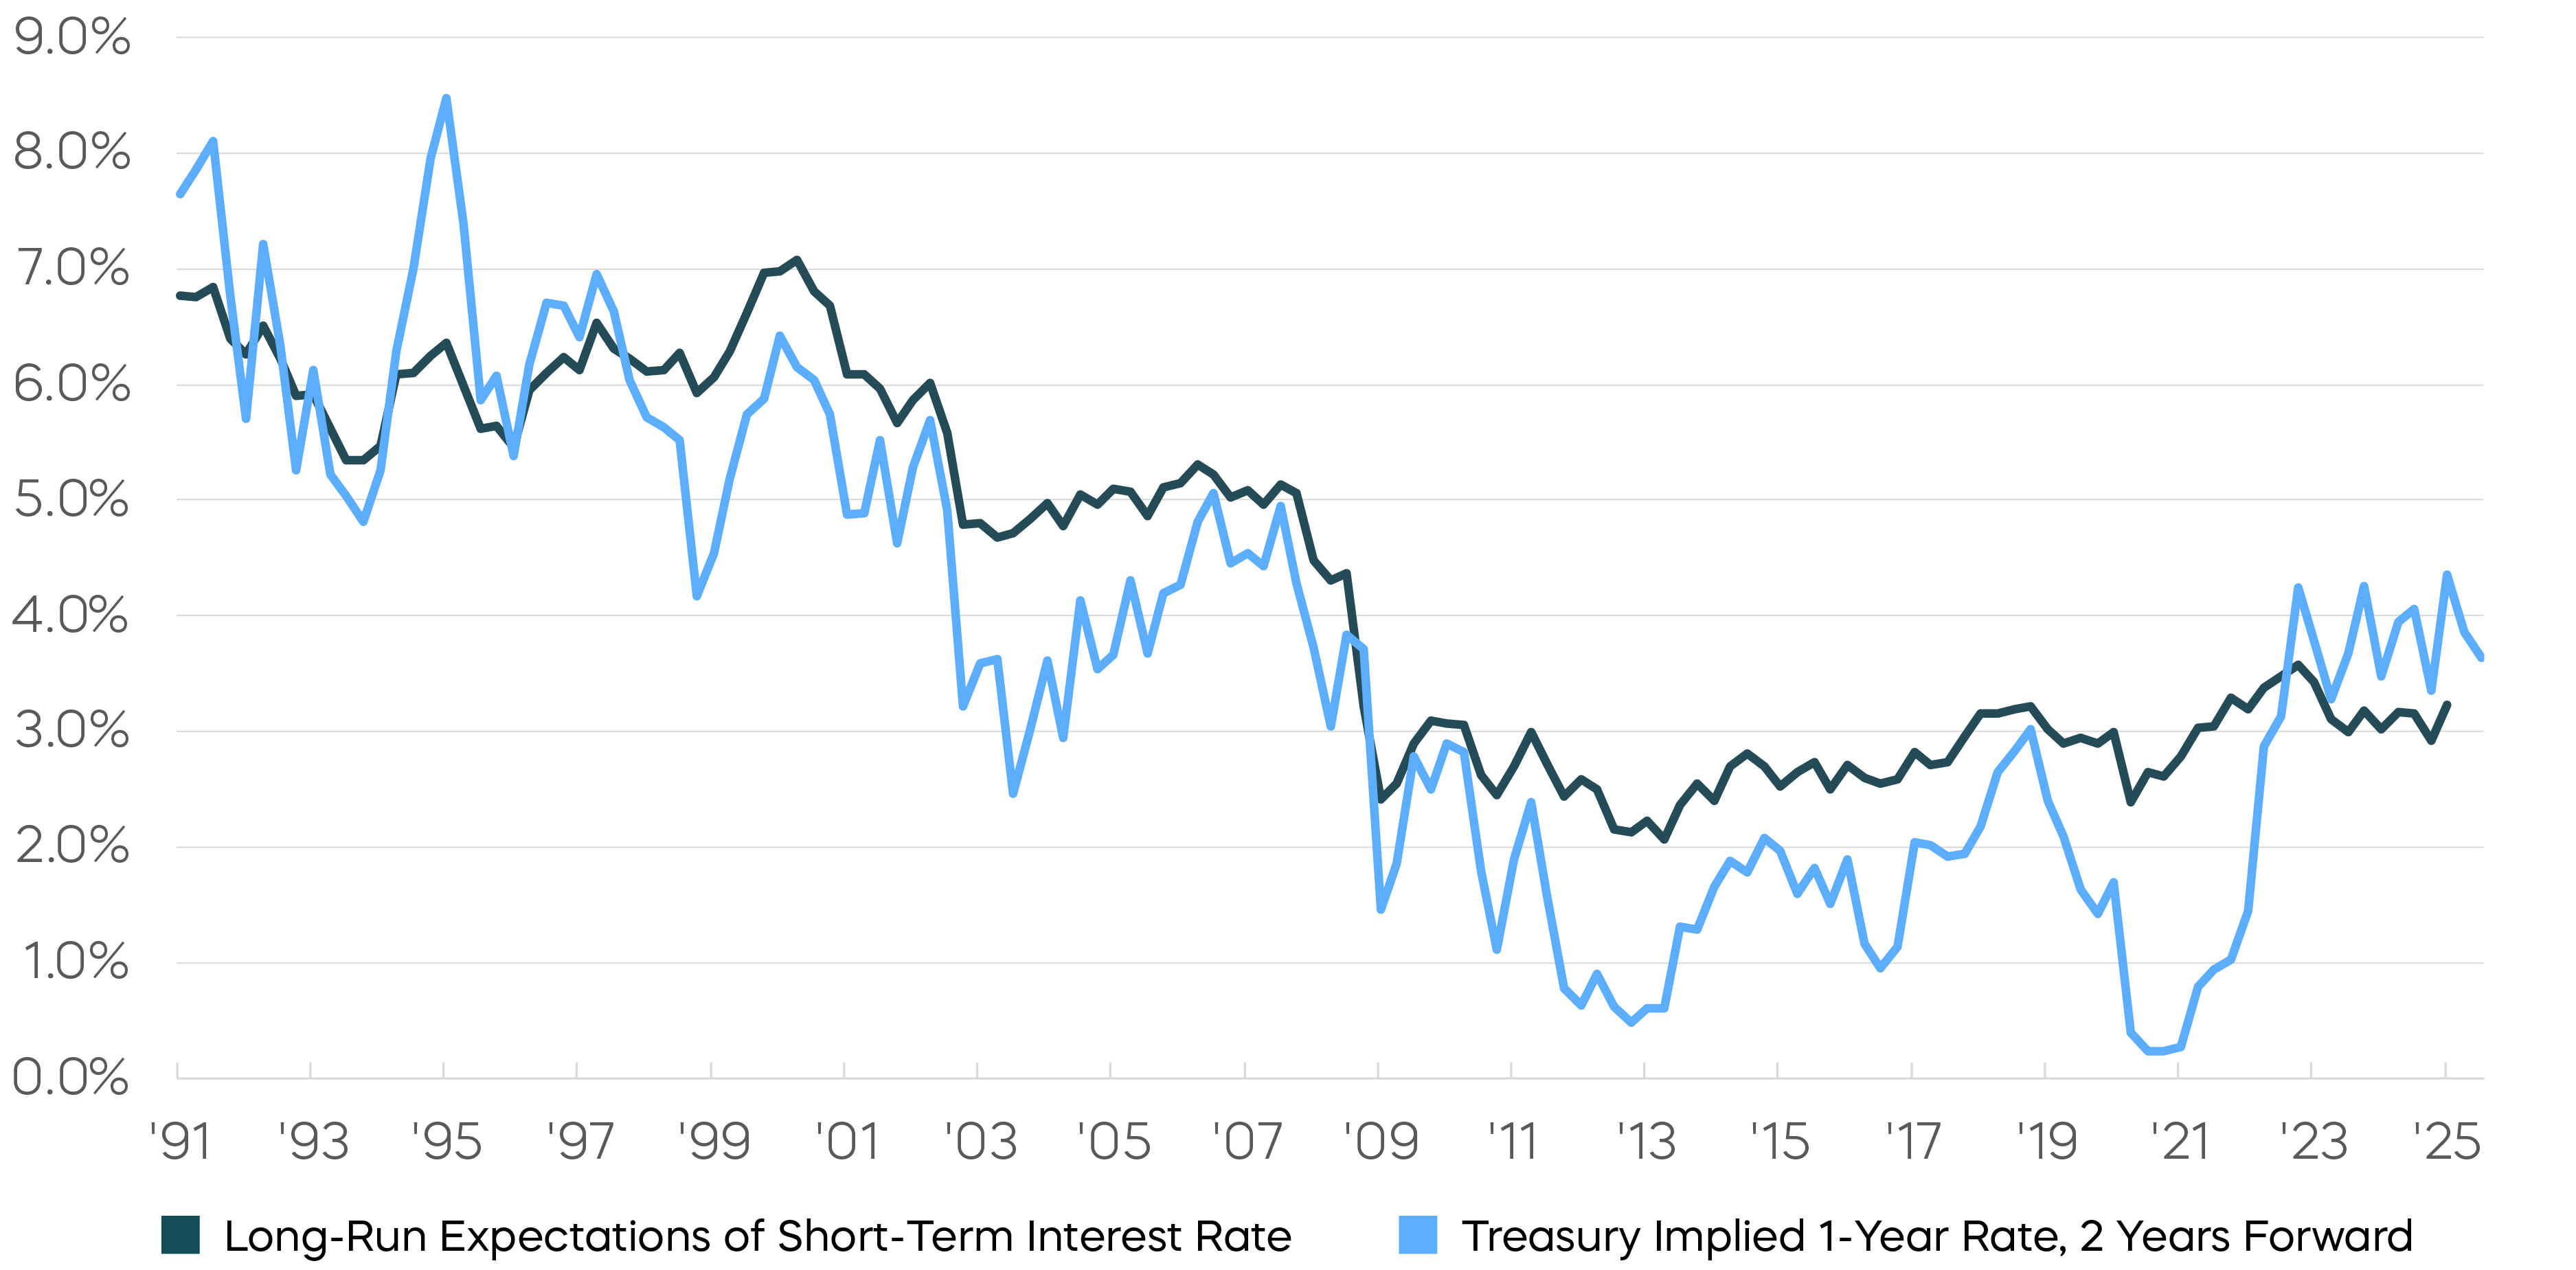
Source: Bloomberg, quarterly data as of 7/1/25. Long-run expectations of short-term interest rate is calculated as the sum of HLW model estimate of r-star and the average 10-year inflation expectations from Federal Reserve Bank of San Francisco.
In summary, forward rates indicate the market expects the Fed Funds rate to approach 3%, with inflation expectations moving towards 2% over the next two years. As noted in our Key Observations, we think the Fed has room to cut in the immediate term to 4%. Rate cuts beyond neutral, however, would probably require clear evidence of economic deterioration, which is not our base case today. That said, it seems worthwhile to keep an eye on consumer spending trends. Meanwhile, the yield curve could continue to steepen if long-term rates reflect increased risks tied to fiscal policy, geopolitics, or inflation.
Fixed Income Returns—August 2025
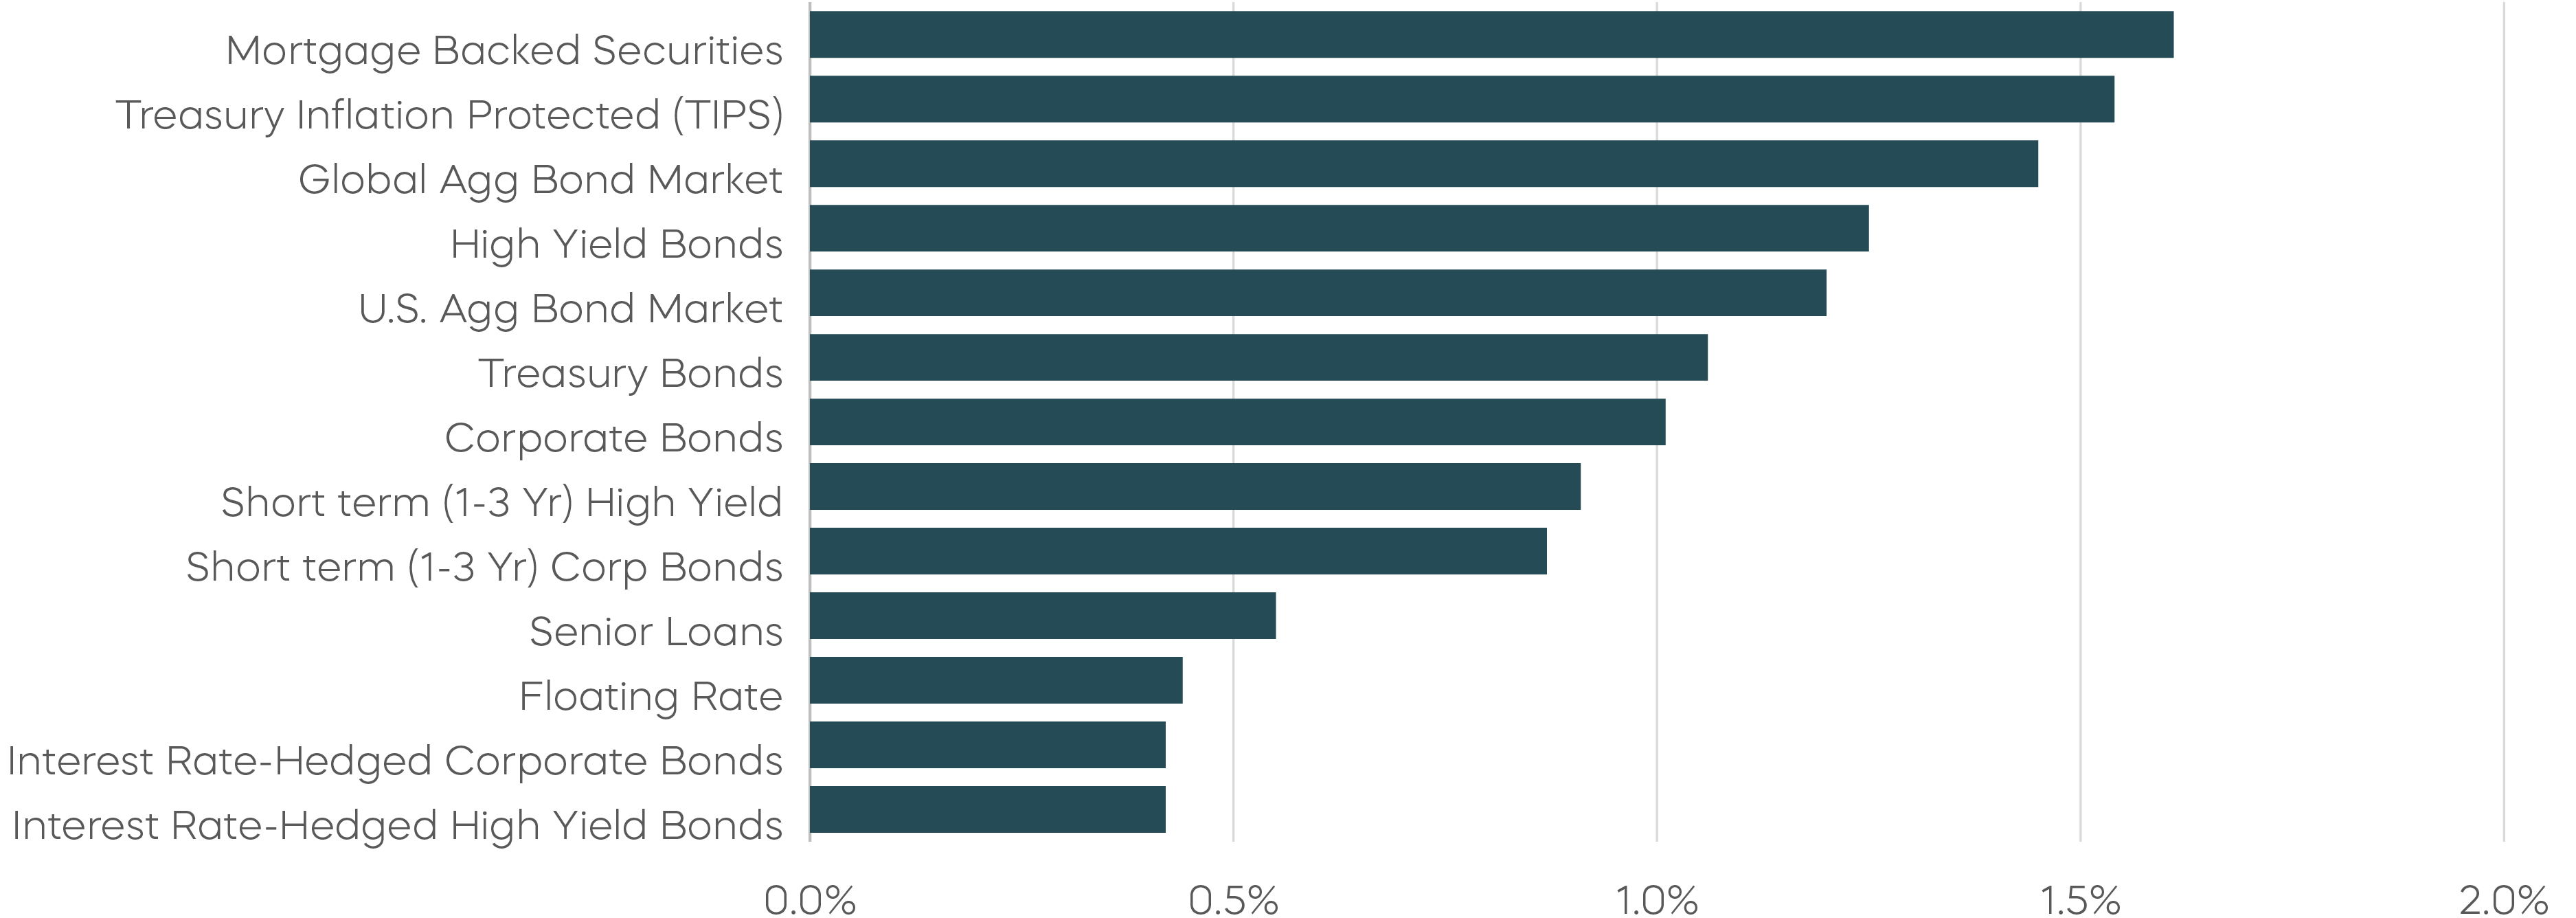
Source: Bloomberg. August returns 8/1/25–8/31/25. Index returns are for illustrative purposes only and do not reflect any management fees, transaction costs or expenses. Indexes are unmanaged, and one cannot invest directly in an index. Past performance does not guarantee future results.