Key Observations
The dot-com bubble burst in 2000. Now, 25 years later, anxiety abounds about the potential for a similar AI bubble burst and resultant crash. Are we on such a dangerous precipice? A side-by-side of prices and fundamentals in 1999 versus 2025 shows why that seems improbable.
Comparing Technology and S&P 500 Fundamentals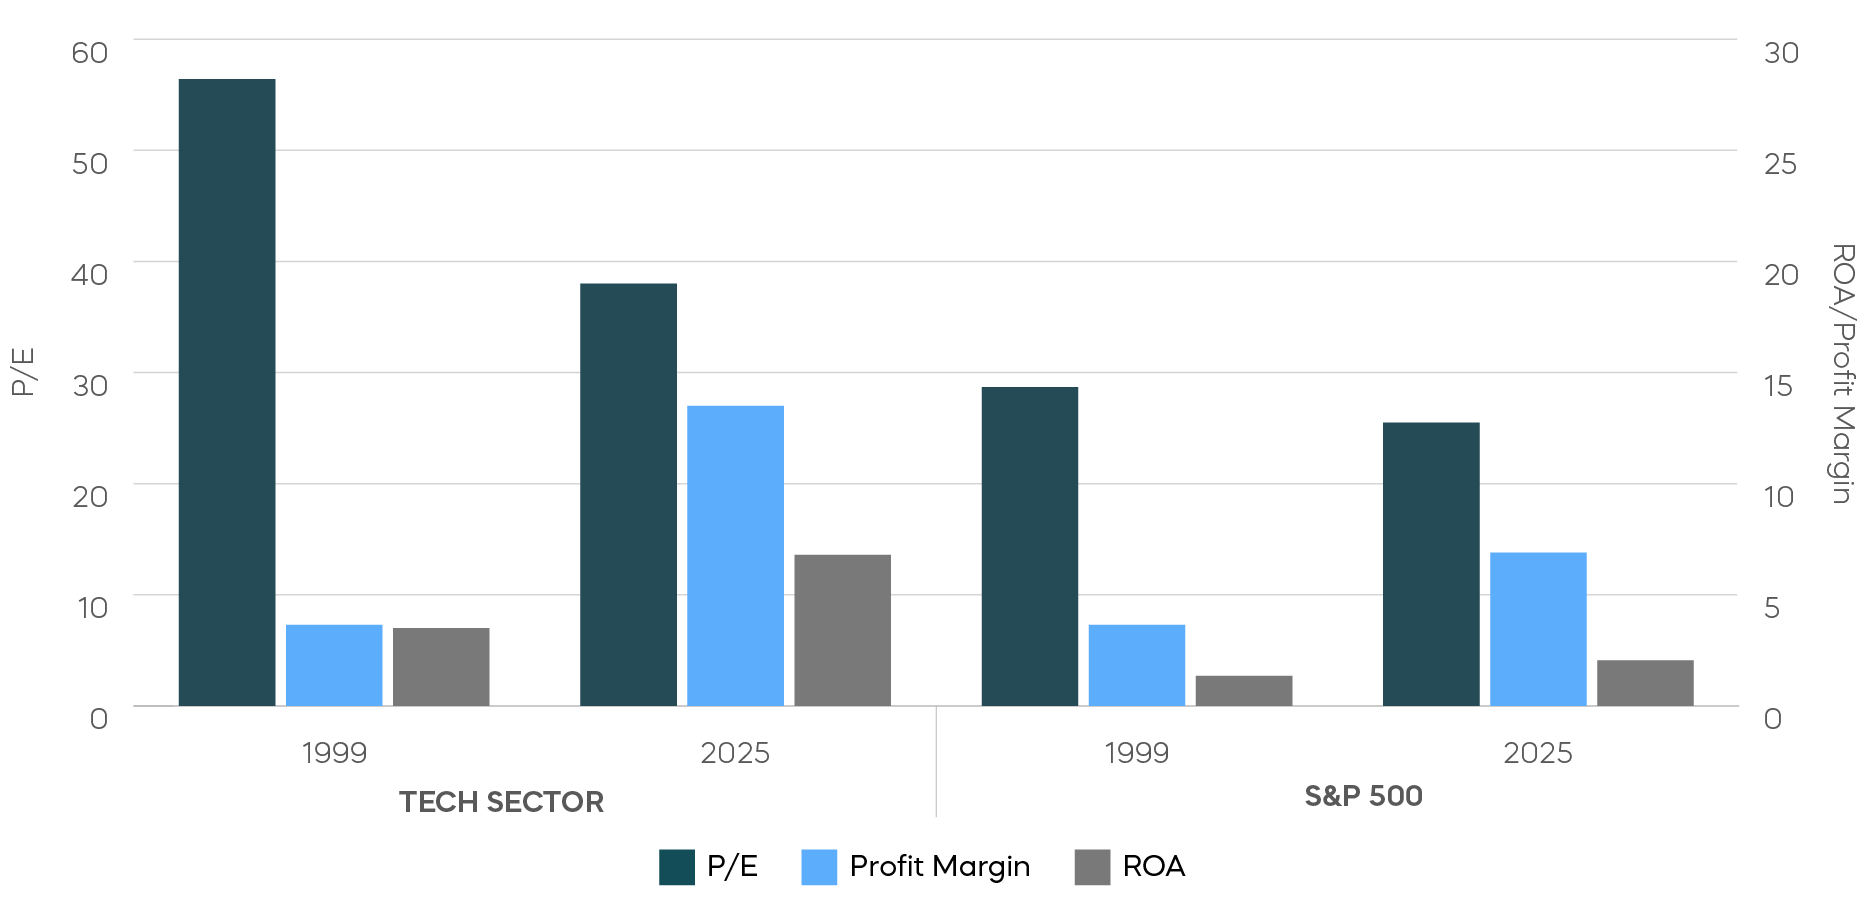
Source: Bloomberg, data as of 11/30/25. Index returns are for illustrative purposes only and do not reflect any management fees, transaction costs or expenses. Indexes are unmanaged, and one cannot invest directly in an index. Past performance does not guarantee future results.
Today, the technology sector and the S&P 500 are both cheaper and more profitable than they were in 1999, as the chart above illustrates. Then, valuations (P/E) were indeed soaring, but investors during this supposed era of irrationality were also buying into tech sector profitability that was actually higher than the rest of the market. In fact, the large-cap tech stocks of the S&P 500 made plenty of money in the late 1990s and, much like today, they had nearly triple the return on assets (ROA) of the broader S&P 500. Today, tech sector fundamentals look even better by comparison. Plus, valuations aren’t nearly as high. So why all the handwringing? And what should investors watch? This time around, the greatest risk to the tech sector (and the broader market) may not come from unsustainable valuations, but, instead, from the risk of deteriorating fundamentals—specifically declining earnings.
We acknowledge an unresolved and ongoing debate surrounding expectations of enhanced productivity and profitability from AI at the core of today’s market tension. But it could take years to play out. In the meantime, watch the nearer-term path of earnings, a key determinant for where the stock market may be headed.
Historically, falling earnings are often the result of recession. In fact, a recession and a hit to earnings were key elements of the dot-com crash. According to Bloomberg, the 2001 recession brought S&P 500 earnings down 20% year-over year, and tech sector earnings down by 68%. So, what is the risk of a recession in today’s environment?
While the labor market has lost a bit of its vitality, a real recession—not just a mild slowdown of GDP growth—is typically a reaction to an overheating economy. Here, we see a bit of an economic buffer already in place.
What About the Soft Landing?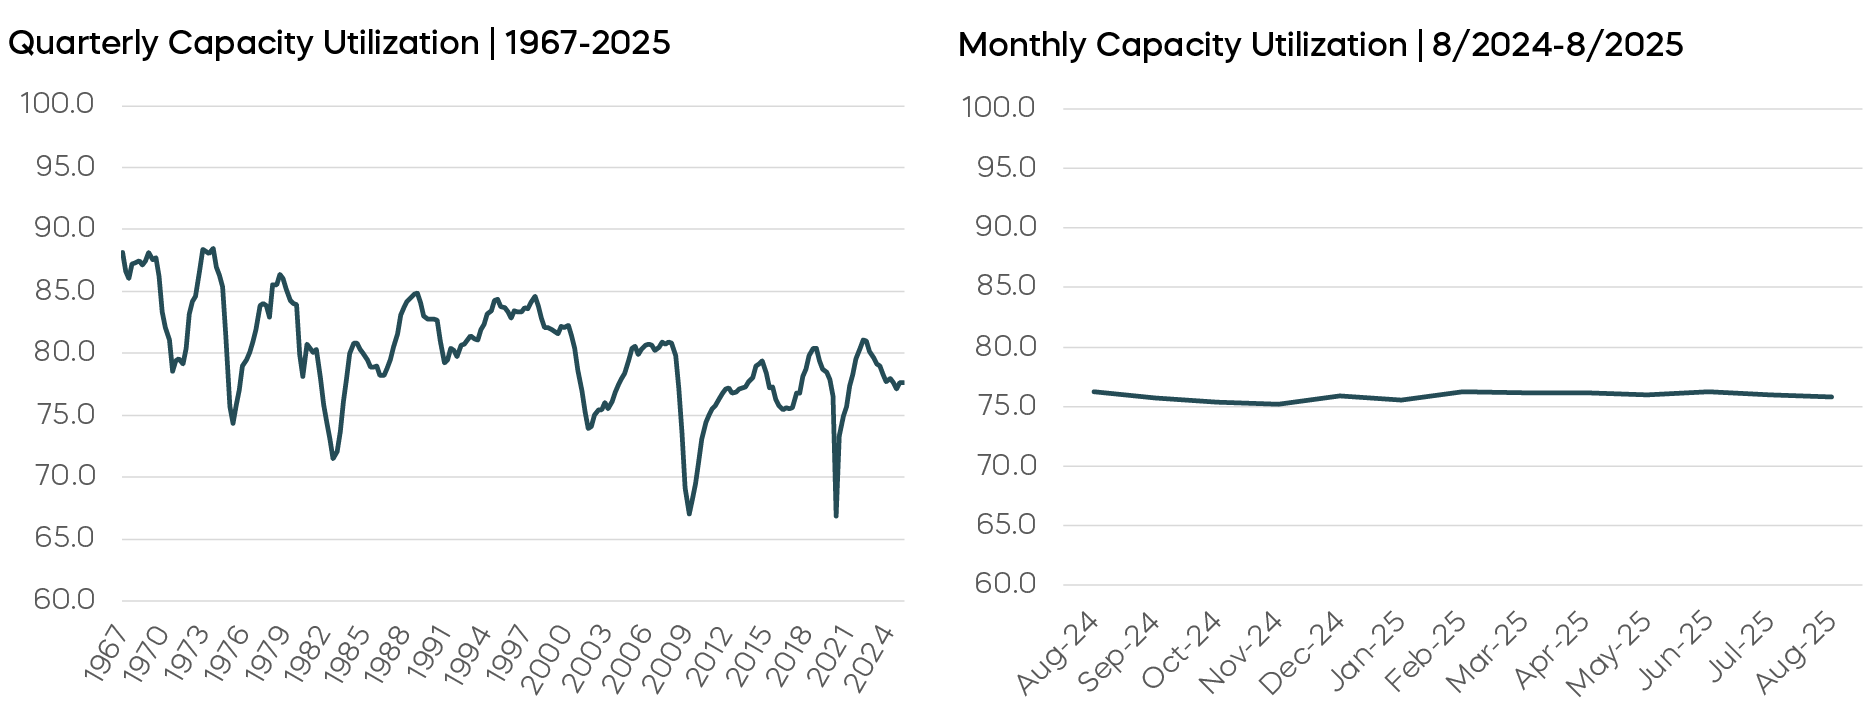 Source: Bloomberg, data as of 8/31/25.
In our September Commentary, we noted that the extremely low levels of capacity utilization experienced during the Great Financial Crisis and Covid-19 pandemic may make today’s levels appear high. However, historical levels typically precipitate a recession after utilization rates pass readings over 80%—well above current levels of 75.8%. In fact, the slack in today’s economy remains in the sweet spot of “neutral.” Nearly as important: capacity utilization has been remarkably steady all year. The level and stability of capacity utilization today—rather than warning of a potential recession—looks more like a proof point that we achieved a soft landing.
A Few Thoughts on Bitcoin
Any 2026 market outlook would be incomplete without a few words on bitcoin. As 2025 ends, there is a narrative accepted by many that bitcoin behaves just like the tech sector. A look at its correlations tells a different story.
Correlations Show Bitcoin Isn’t Just a Tech Stock Source: Bloomberg, data from 12/1/20 through 12/1/25.
Bitcoin has had low correlation to both the tech sector and the S&P 500. Its correlation with the S&P 500 has actually been more similar to that of bonds, and its correlation with both bonds and gold has been low as well. This is actually more supportive of the notion that adding bitcoin and other cryptocurrencies to a traditional asset allocation may provide some potential diversification benefits.
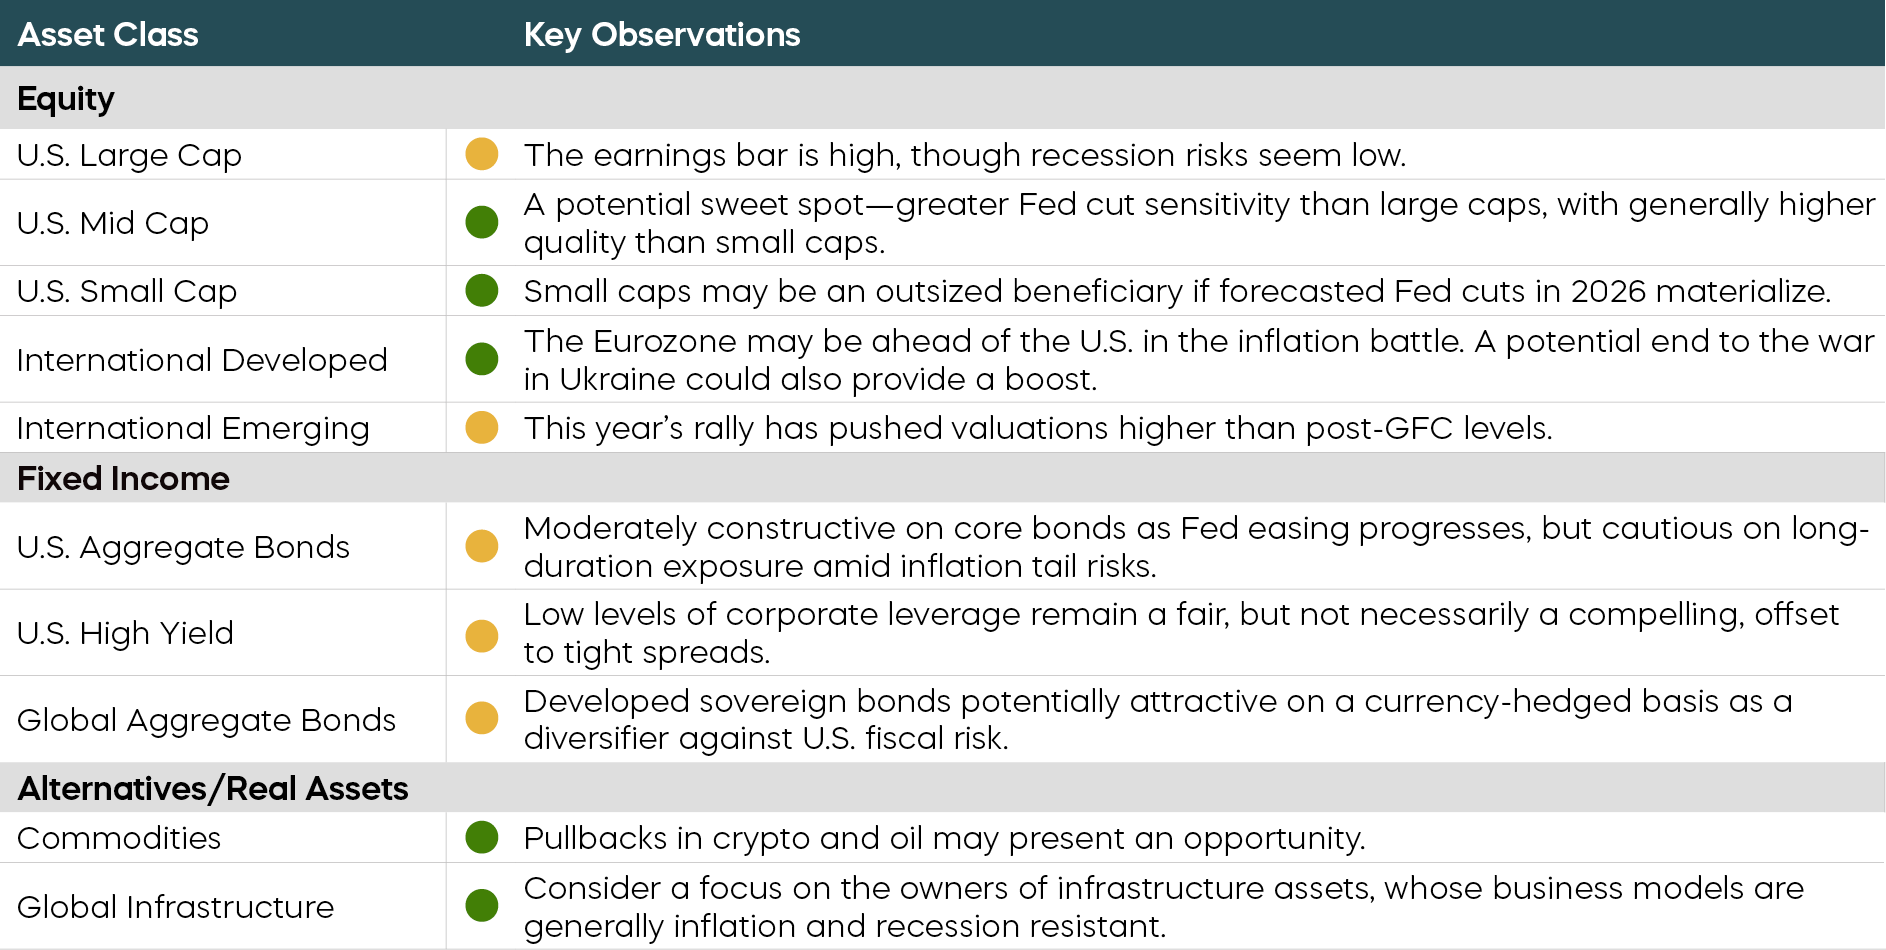
Asset Class Perspectives
Asset Class Returns—November 2025
Asset Class Returns—Year-to-Date
Source: Bloomberg. November returns 11/1/25–11/30/25; year-to-date returns 1/1/25‒11/30/25. Index returns are for illustrative purposes only and do not reflect any management fees, transaction costs or expenses. Indexes are unmanaged, and one cannot invest directly in an index. Past performance does not guarantee future results.
The following are observations on a range of asset classes. For each, green indicates a constructive backdrop, yellow indicates a neutral environment, and red would indicate a challenging backdrop.
Equity Perspectives
Equities Are Attractive Despite Poor Sentiment; Stocks Are Poised to Advance
The S&P 500 is up over 17% through November, and it’s likely 2025 will conclude a third consecutive year of strong equity market returns. Nonetheless, the current bull market (now in its fourth year) remains at odds with consumer and investor sentiment readings—both of which have been low.
- The University of Michigan Consumer Sentiment Index hit 51 in November, its lowest level since stocks cratered in mid-2022.
- The latest American Association of Individual Investors survey showed improvement, but readings have been well below its historical average for much of the year.
This relationship is unusual. Sentiment readings typically follow the direction of the market. Strong equity returns usually fuel optimism and high levels of sentiment. So, while investors may be feeling the holiday blues right now, the ingredients for equities to continue advancing in 2026—perhaps at a slower rate—appear to be in place.
The bullish case for 2026 starts with a favorable trend in economic growth. After a slight decline during the first quarter of 2025, second quarter real gross domestic product grew by a healthy 3.8%. And third quarter GDP is expected to advance at an annualized rate of 3.9%, according to the Atlanta Fed’s GDPNow estimate.
Real GDP Has Been Accelerating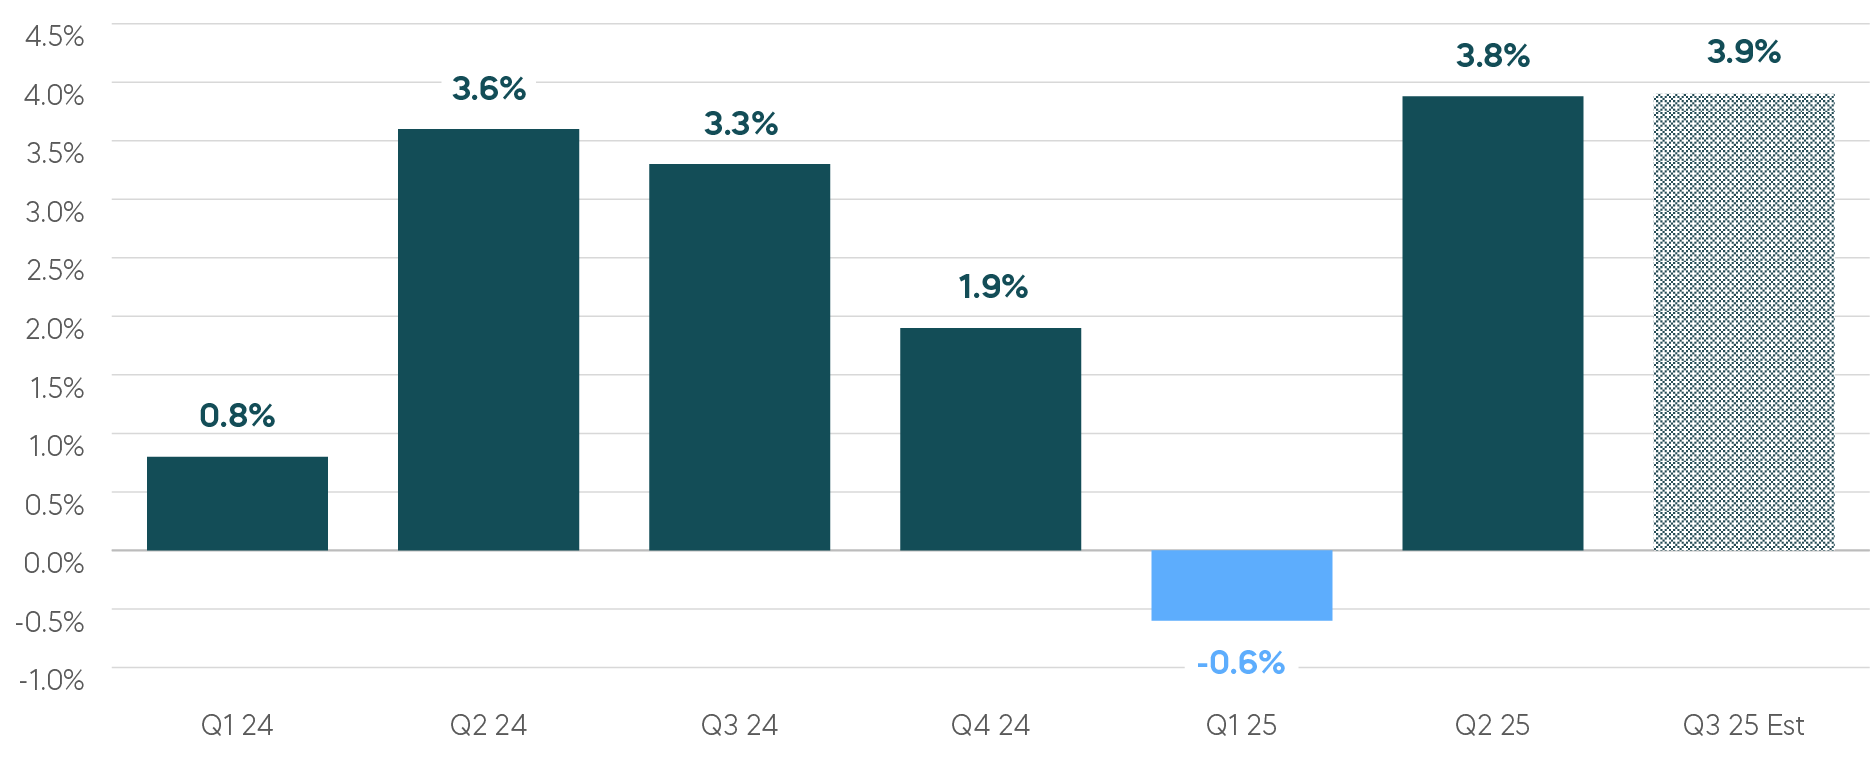 Source: U.S. Bureau of Economic Analysis, Atlanta Fed GDPNow.
Next, 2025’s better-than-expected earnings backdrop has been well documented. Analysts expect the S&P 500 to deliver growth of 11.8% this year, and for growth to expand to 14.2% in 2026. A net profit margin of 13.1% for the third quarter is also the highest reported by the S&P 500 since at least 2009, per FactSet.
Importantly, this robust performance hasn’t come from cost containment alone. Top-line revenue growth has also been strong and is accelerating according to FactSet. The third quarter’s revenue growth rate of 8.4% was the highest since 2022 and a vast increase over the June 30 projection of just 4.8%. A favorable economic backdrop and strong corporate fundamentals—taken together with policy stimulus of perhaps three further Fed rate cuts—may provide the key ingredients for the bull market to continue into 2026.
Market Rotation May Provide Additional Opportunities in 2026
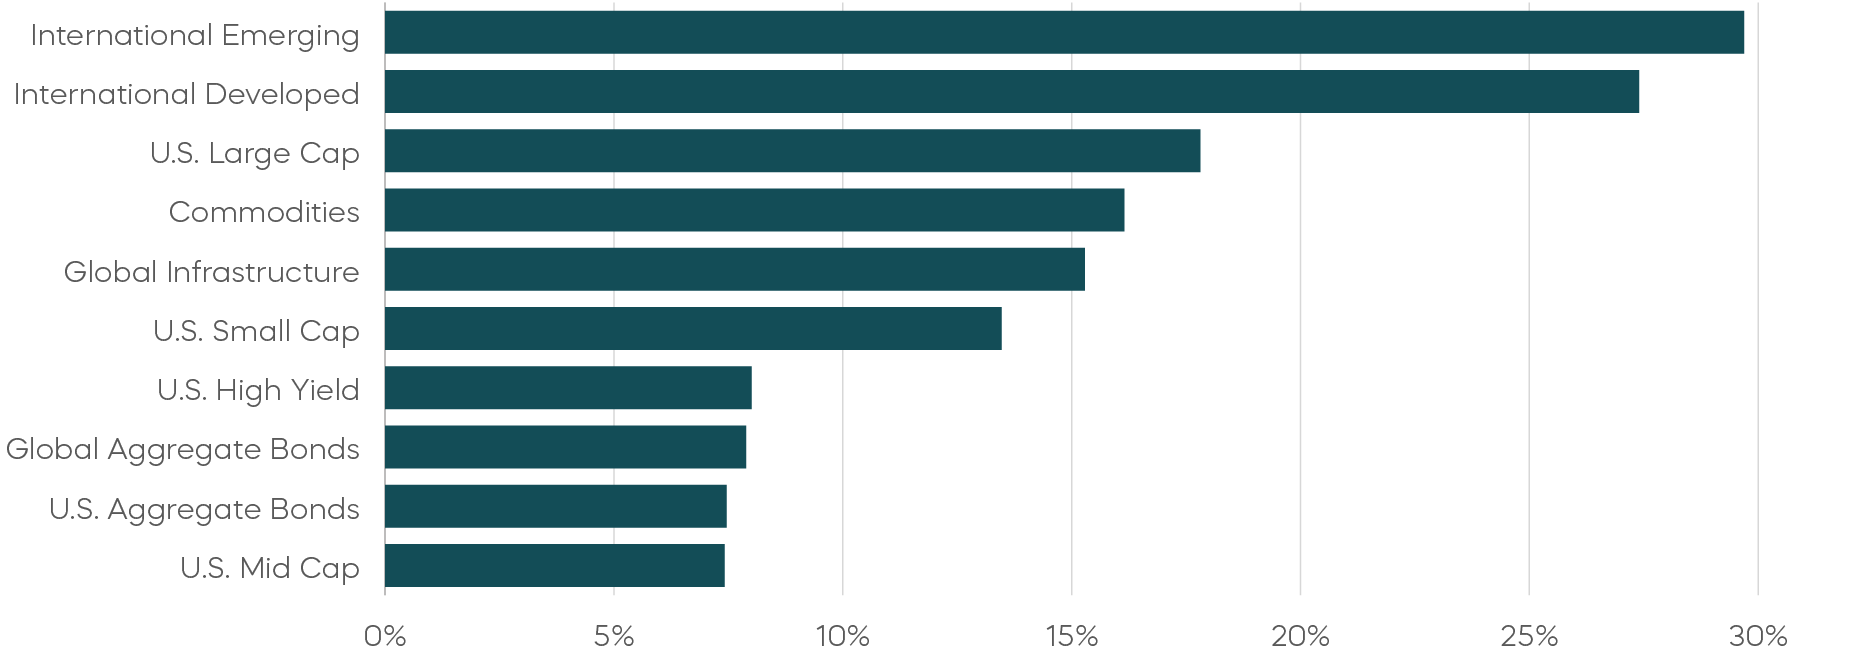
Investors looking for signs of a sustained change in market leadership away from domestic growth-oriented stocks have ample evidence to consider. After years of underperformance, both international developed (MSCI EAFE Index) and emerging markets (MSCI Emerging Markets Index) outperformed the S&P 500 in 2025. U.S. markets also show early signs of broader participation, as the Russell 2000 Index has outperformed the S&P 500 since the market lows of early April. And even within large caps there are early signs of greater participation. Health care stocks have rallied sharply over the last few months and were the market’s top-performing sector and largest contributor to November gains, according to Standard & Poor’s.
The performance of several market factors may also be pointing toward a continued rotation. Let’s look at the charts below. High-beta and momentum stocks delivered year-to-date returns approaching 30% but saw negative performance in November. Meanwhile, laggard factors like value and dividend growth (quality-oriented strategies like the Dividend Aristocrats) delivered their best monthly performance of the year. For investors growing leery that the leadership of growth and momentum oriented stocks may be running its course, typically high-quality stocks like the Dividend Aristocrats may offer something different. Historically, they have delivered strong returns following periods of growth-stock dominance. And rather quietly, they have delivered a year-to-date performance that is approaching their long-term performance average.
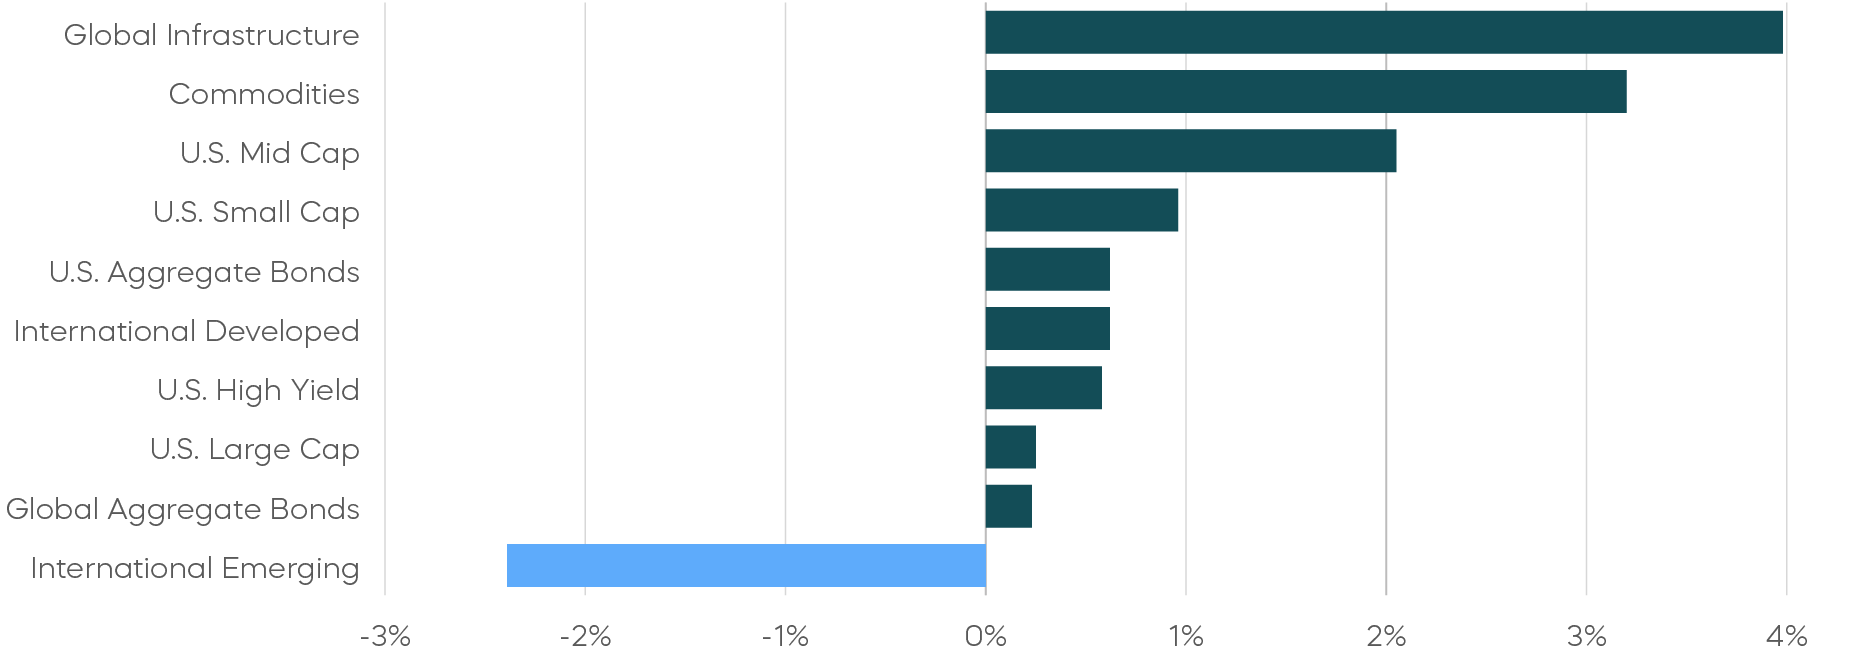
Year-to-Date Laggards Assumed Market Leadership in November
Year-to-Date 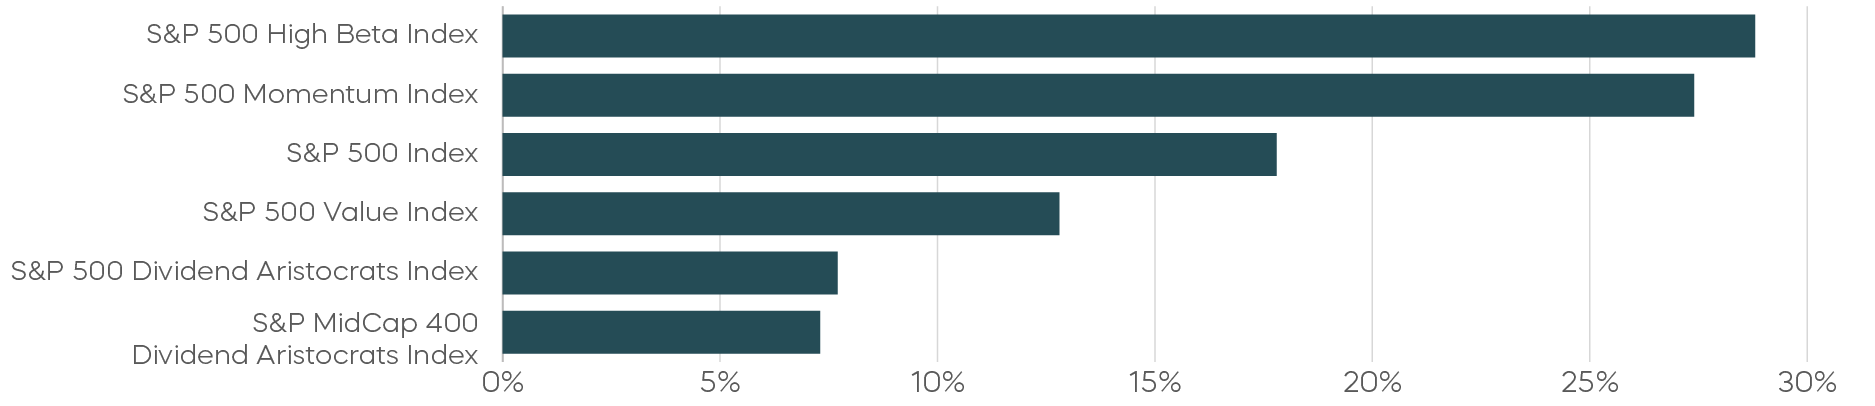
November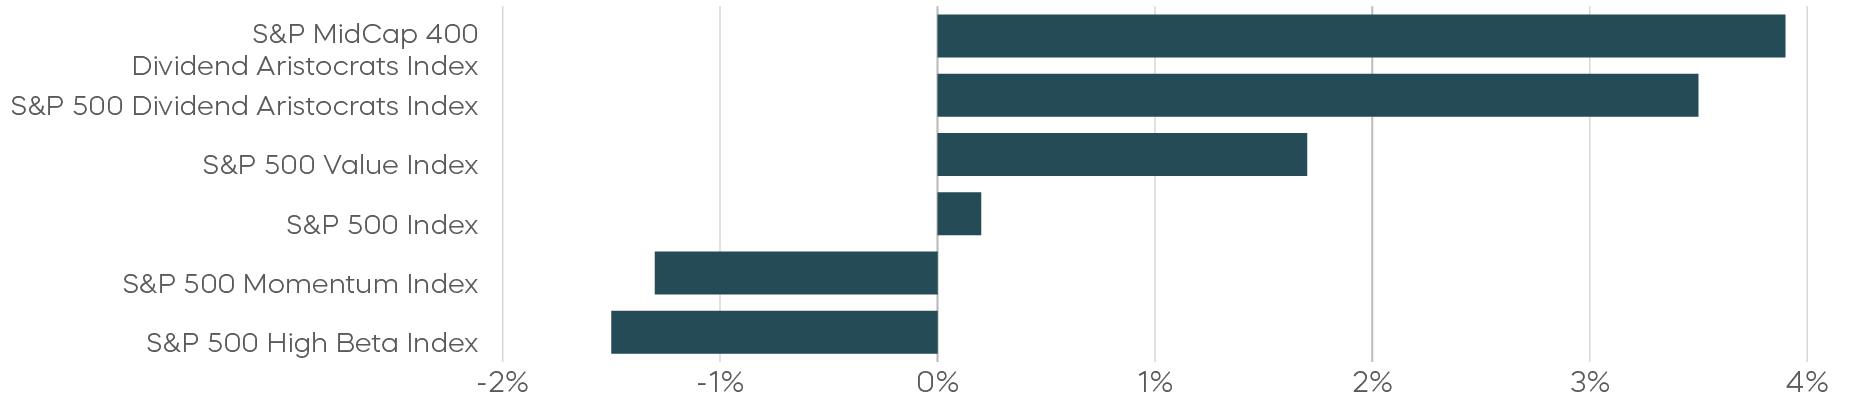
Source: Morningstar. Data from 1/1/25 through 11/30/25. Index returns are for illustrative purposes only and do not reflect any management fees, transaction costs or expenses. Indexes are unmanaged, and one cannot invest directly in an index. Past performance does not guarantee future results.
Consider Diversification to Help Manage Risk
As we noted earlier, despite concerns about another potential bubble, stocks are more profitable (and not quite as expensive) as they were 25 years ago, and valuations alone may not be the market’s greatest near-term risk. An earnings collapse, particularly among the heavyweights that have been the market’s star performers, seems to be a greater potential risk.
That risk hasn’t materialized yet, thankfully. Granted, the Magnificent-7’s earnings slowed during the latest quarter, but that comes with two important caveats, illustrated below:
- First, even at a reduced rate, third-quarter earnings growth remained robust at 18%.
- Second, that drop was largely attributable to Meta’s negative earnings surprise. Without Meta’s results, earnings growth for the remaining six companies was 30.4%, according to FactSet. Importantly, the remaining 493 stocks in the S&P 500 have seen earnings accelerate lately.
Mag-7 Earnings Growth Slowing While the Rest of the S&P 500 is Accelerating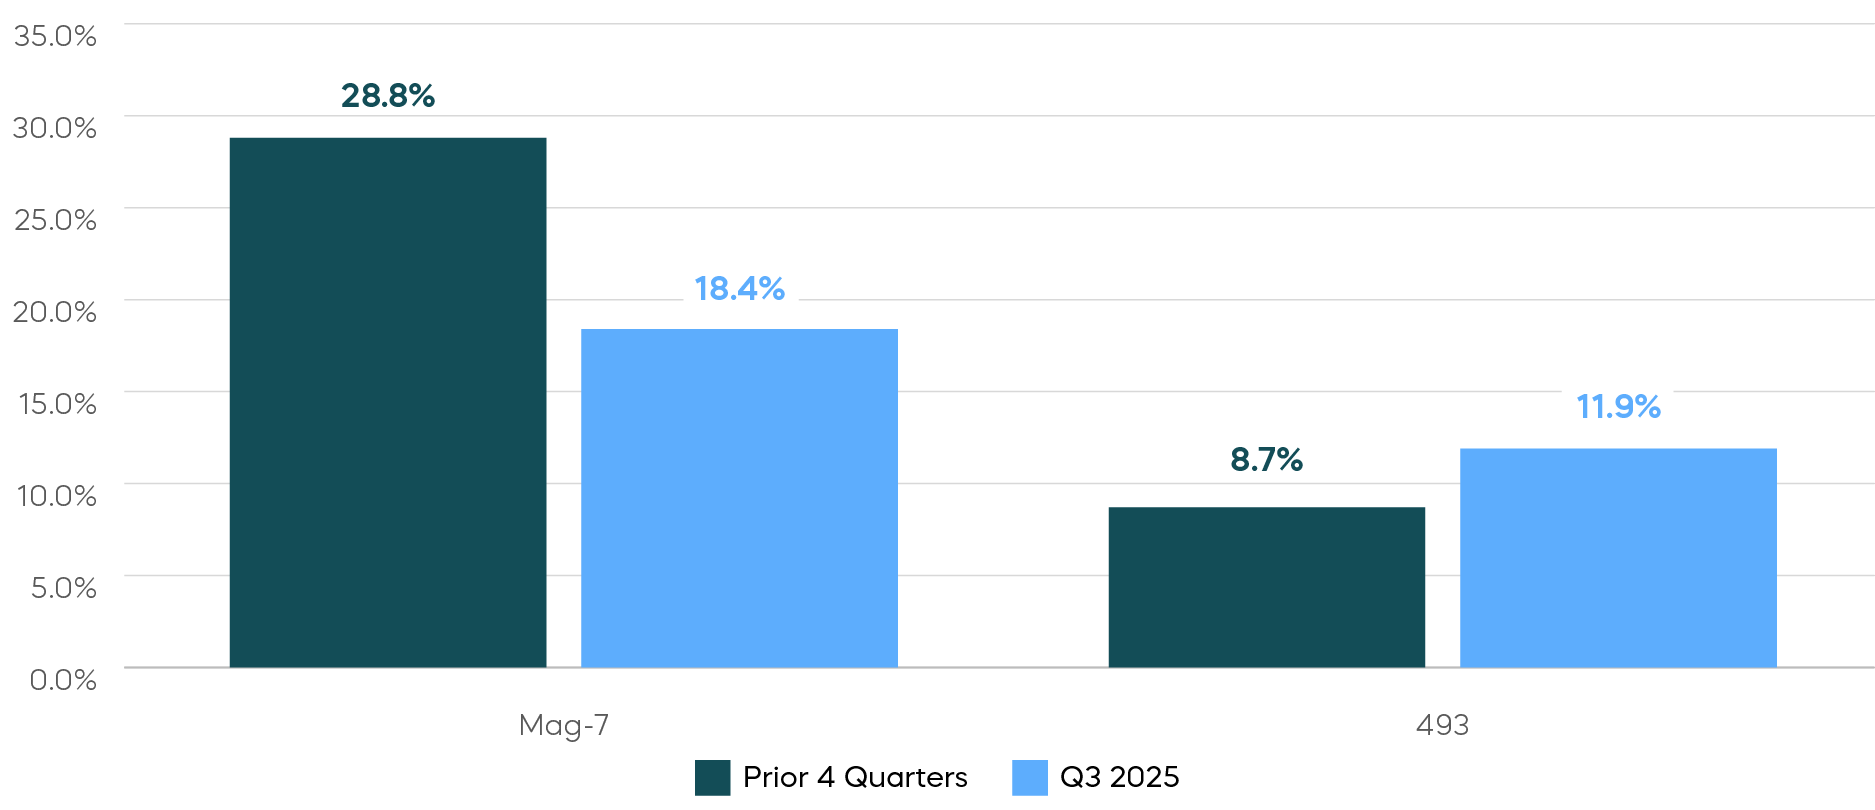 Source: FactSet, data as of 11/21/25. Index returns are for illustrative purposes only and do not reflect any management fees, transaction costs or expenses. Indexes are unmanaged, and one cannot invest directly in an index. Past performance does not guarantee future results.
Even with the still solid earnings picture, concentration risk abounds. Aside from the large relative weighting of tech stocks in most major indexes, the artificial intelligence boom has thus far been fueled by huge capital expenditures from companies like OpenAI and Anthropic. Those companies are, of course, a long way away from profitability. And any meaningful deceleration of AI spending from such companies or their competitors could dent the earnings picture for all. At this point, however, we don’t seem to be near that point.
Investments that exclude a sector (like tech) may offer a solid choice for managing the risks of a concentrated, top-heavy market reliant on just a few names for its continued performance.
Equity Market Opportunities in 2026
- Consider generating income from equity markets.
- Covered call strategies that use daily options, like the S&P 500 Daily Covered Call Index, can potentially deliver robust yields and participate in equity market rallies.
- Look toward market segments benefitting from shifting market leadership.
- Mid- and small-cap stocks have rallied, but the advance has been led by lower-quality stocks—expect higher-quality stocks to potentially follow.
- The S&P MidCap 400 Dividend Aristocrats Index and the Russell 2000 Dividend Growth Index are equally weighted strategies focused on companies that continually grow dividends.
- Think about diversifying concentrated large-cap exposure to help manage risk.
- Strategies that invest in a broad index like the S&P 500 while excluding a sector (like the S&P 500 Ex-Information Technology Index) may prove beneficial for investors who have concentrated sector positions.
Fixed Income Perspectives
A Strong Year for Bonds in the Post-QE Era
2025 has been one of the strongest years for U.S. fixed income in the post-QE era, and the best since the pandemic. While the era of QE-suppressed interest rates is behind us, 2025 has demonstrated that higher starting yields can still translate into healthy bond returns.
The year also marked a return to form for more traditional stock-bond diversification, as correlations declined and fixed income once again played its role as a potential portfolio diversifier. With inflation pressures easing, investors have been reallocating back to bonds: U.S.-listed fixed income ETFs saw year-to-date inflows roughly 50% above the 5-year average, as shown below.
Bond Returns Have Led to Strong Inflows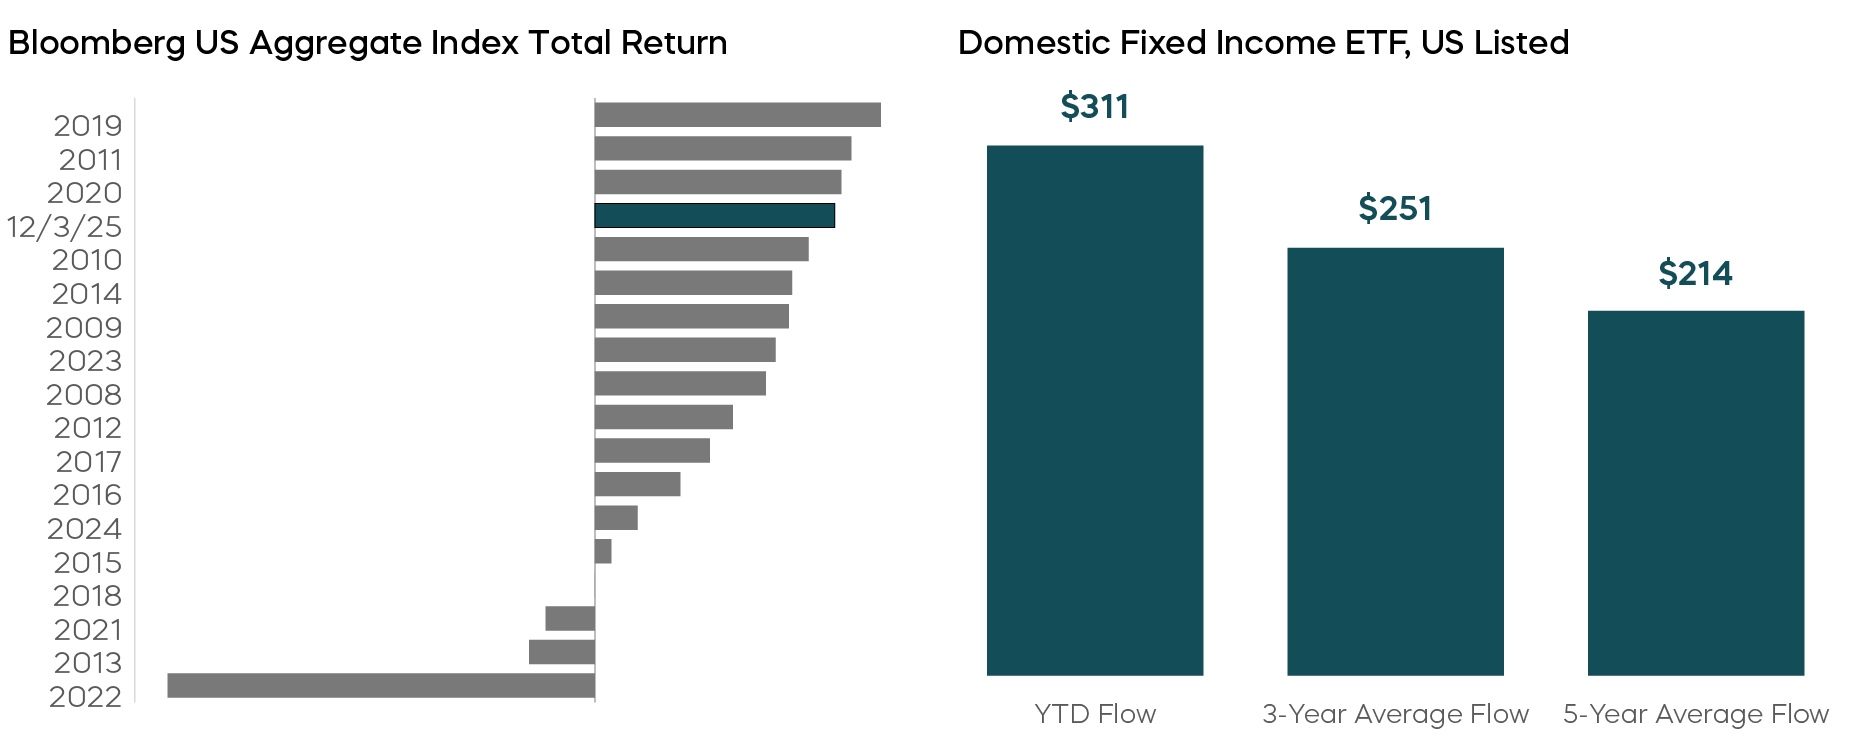 Source: Bloomberg, data as of 12/4/25. Index returns are for illustrative purposes only and do not reflect any management fees, transaction costs or expenses. Indexes are unmanaged, and one cannot invest directly in an index. Past performance does not guarantee future results.
Perhaps most impressively, this performance came despite a period of sharply positive stock-bond correlation around the tariff announcements in April, when the safe-haven status of Treasuries came into question. While such episodes raise questions around the role of sovereign debt as a defensive asset, foreign investors have largely reaffirmed their confidence in U.S. bonds. The foreign share of total marketable U.S. Treasury holdings has remained stable, with private institutions stepping up purchases. Notably, private Japanese institutions have steadily increased long-dated Treasury exposure, indicating that the risk of tariff-driven capital outflows has receded.
Foreign Investor Confidence in U.S. Treasuries Appears Resilient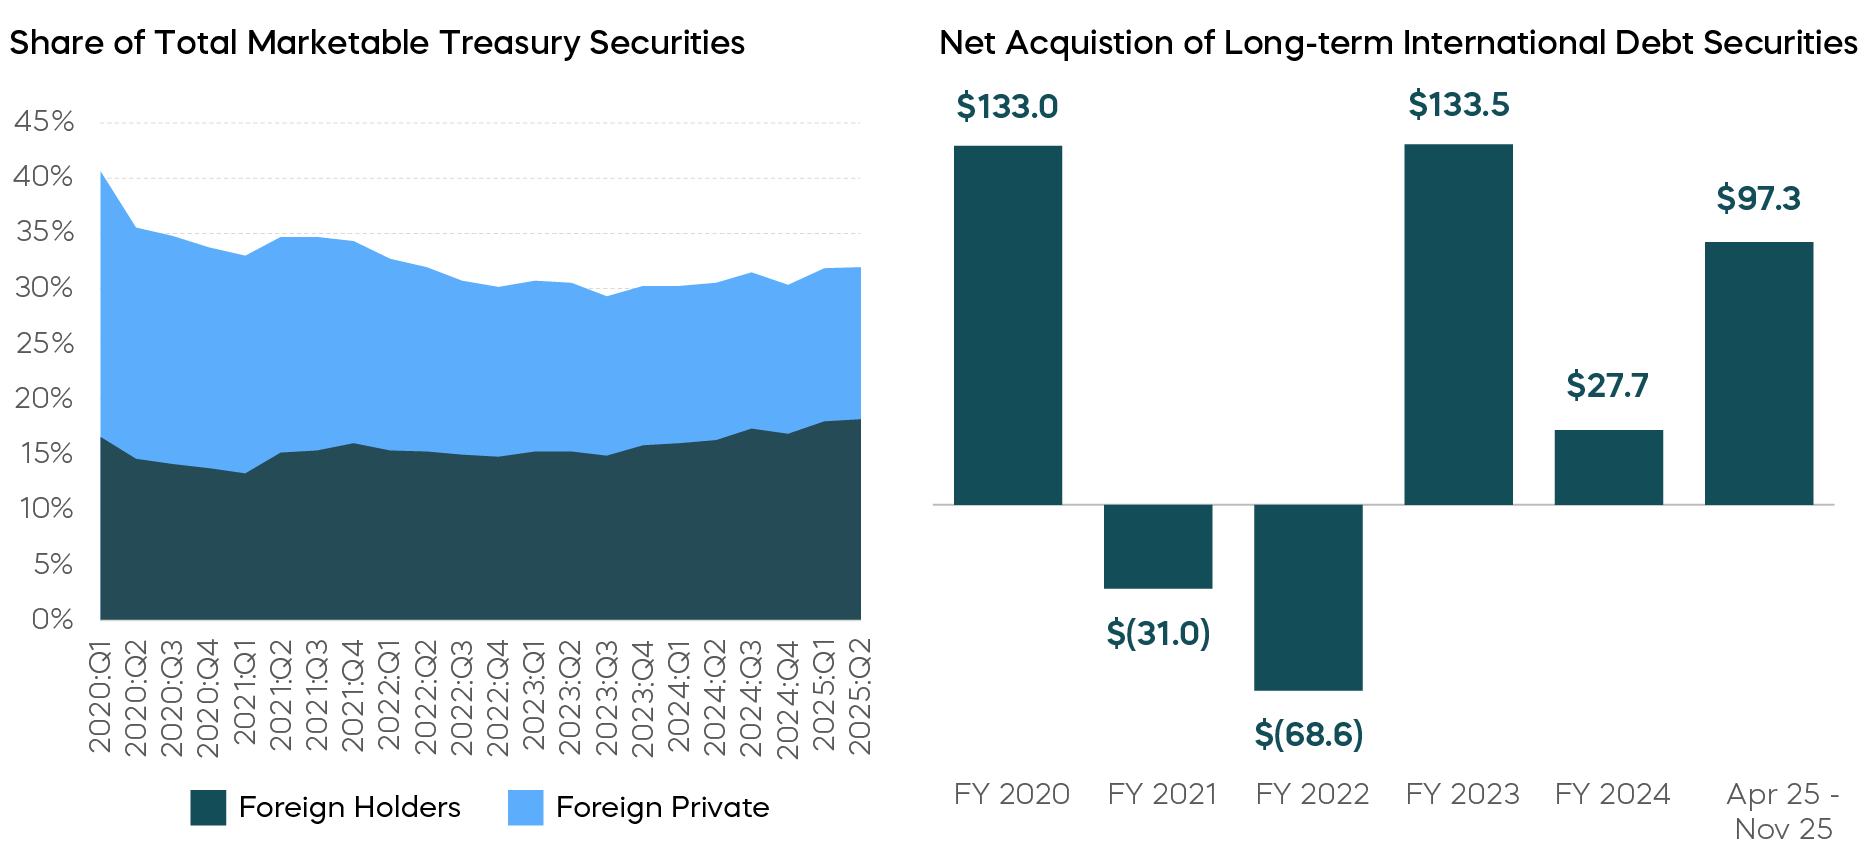 Source: The Federal Reserve, Financial Accounts of the United States, Q2 2025. U.S. Department of the Treasury, Treasury International Capital System, September 2025. And reports from designated major investors, Ministry of Finance, Japan. Data as of 12/4/25, fiscal year beginning on April 1.
As we look ahead, three macro themes dominate our 2026 outlook for fixed income:
- A slowdown in the labor market,
- Inflation as a tail risk for long-term bonds, and
- The macroeconomic implications of AI.
Labor Market Slowdown Likely to Be the Near-Term Focus
The recent government shutdown has disrupted both the release of key economic data and measurement of labor market conditions just as the Fed’s dual mandate of maximum employment and stable prices is coming into tension. The shutdown itself will also still create spillover effects that could further distort short-term readings. This uncertainty partly explains the growing divergence of views within the FOMC: policymakers won’t have a clear read on the state of the labor market until next year.
Still, the trend data tells a story. As of September, nonfarm payroll growth had slowed to an average of 58,000 jobs per month over the last six months, compared to 168,000 in 2024 and 216,000 in 2023. Some of this moderation reflects declining labor supply alongside softer demand. A San Francisco Fed study estimated the trend growth of the labor force at just 50,000 per month during the first half of 2025—close to actual job creation.
However, with unemployment drifting higher, signs point to demand-side cooling rather than supply constraints alone. If slowing job growth were purely a result of shrinking labor supply, we would expect upward pressure on wages. Instead, average hourly earnings growth has been decelerating. While reduced immigration is cited as a key factor behind this, immigrants typically occupy lower-wage positions, yet wage growth in the bottom quartile has weakened the most. Sectors with heavy immigrant employment, such as construction and hospitality, also show no wage acceleration.
Median Hourly Wage Growth Has Been Decelerating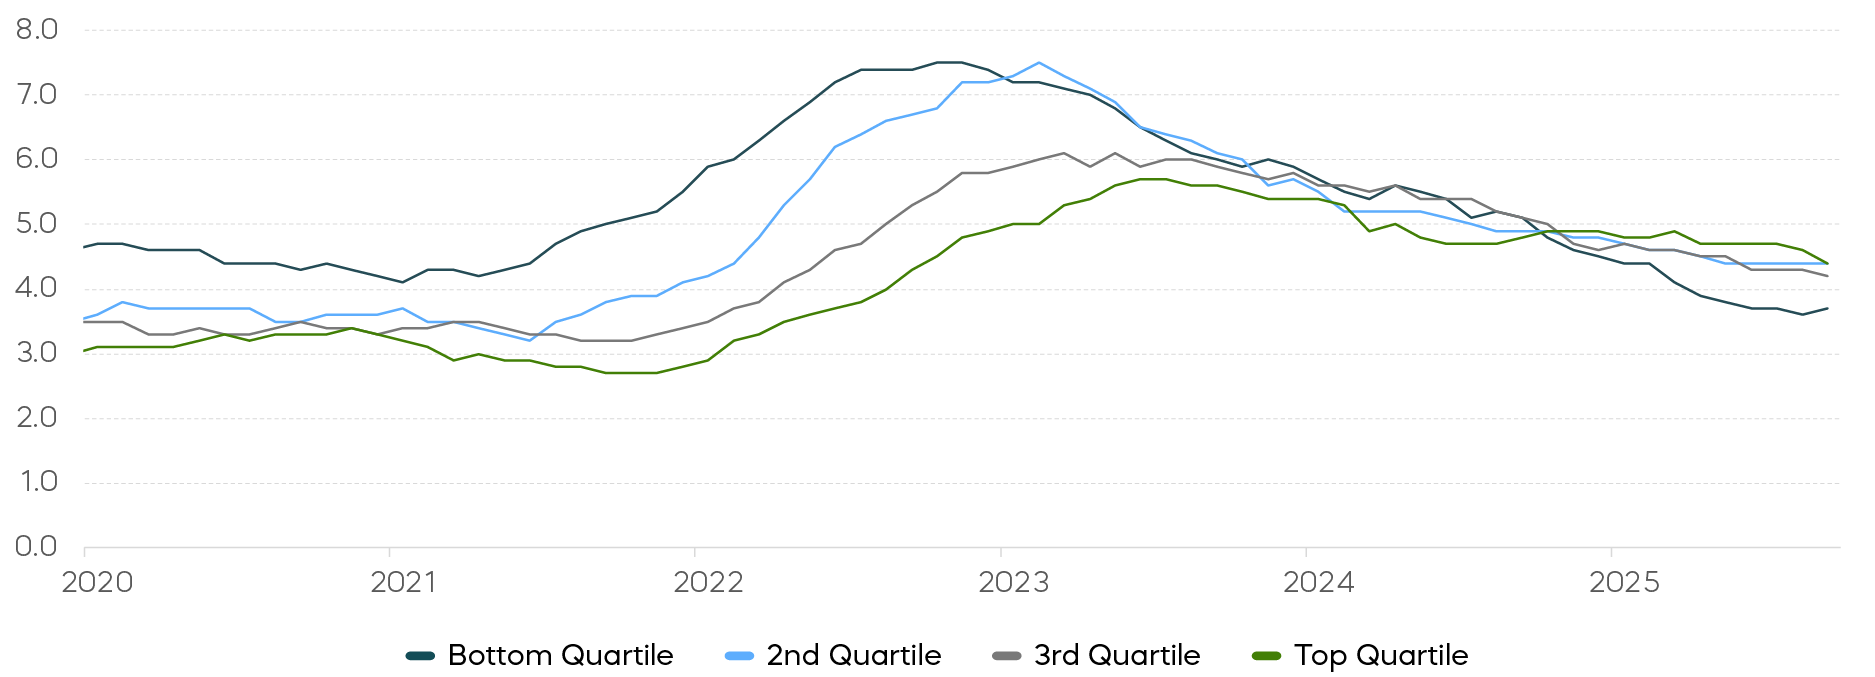
Sources: Federal Reserve Bank of Atlanta Wage Tracker, September 2025.
Moreover, softening of employment figures has been broad-based, across not just marginal and part-time workers, but tenures and industries too. If you look at the following chart, the U-6 unemployment rate is rising at roughly the same pace as U-3 and faster than U-1/U-2, a pattern consistent with demand-driven slowdowns that have preceded past recessions. Many firms are also trimming costs to offset tariff-related price pressures, another sign of weakening demand.
Rise In Unemployment (6-Month Moving Average) Has Been Broad-Based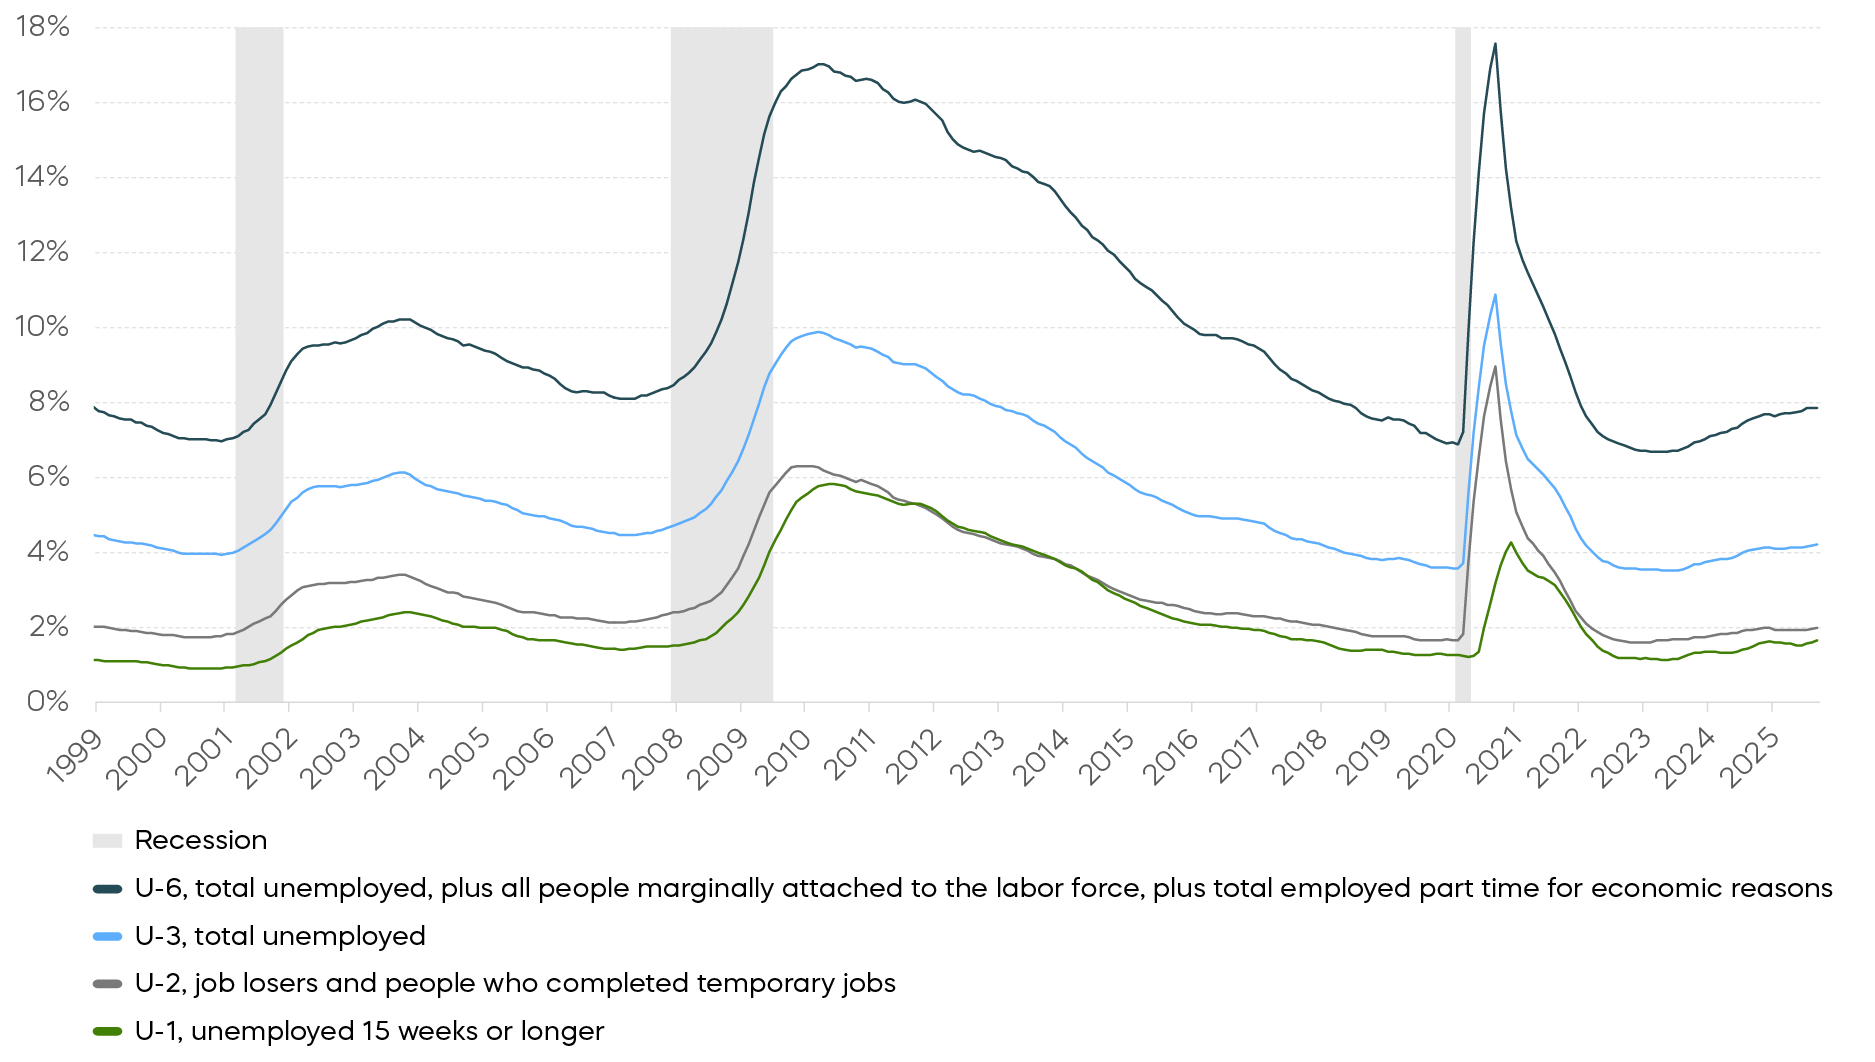
Source: Bureau of Labor Statistics, September 2025.
We believe the economy can weather this slowdown, but the data seems to support continued Fed easing toward a neutral rate through 2026.
Inflation Remains a Tail Risk for the Long End of the Yield Curve
The Fed’s rate-cutting cycle that began in late 2024 has had asymmetric effects across the yield curve. Normally, spreads between 2-year and 10-year Treasury bonds (2s10s) steepen more than 10-year and 30-year (10s30s) spreads when the Fed eases. That’s because front-end yields tend to fall in response to policy, while long-end yields reflect longer-term expectations.
This cycle has been different, however. The 10s30s curve has steepened nearly as much as the 2s10s. That pattern is unusual. It has not been seen since the Fed began publishing target-range guidance in 1990. In mid-cycle adjustments, such as those in 1995 by contrast, 10s30s were little changed.
The 10s30s Curve Has Steepened More Than Previous Rate Cut Cycles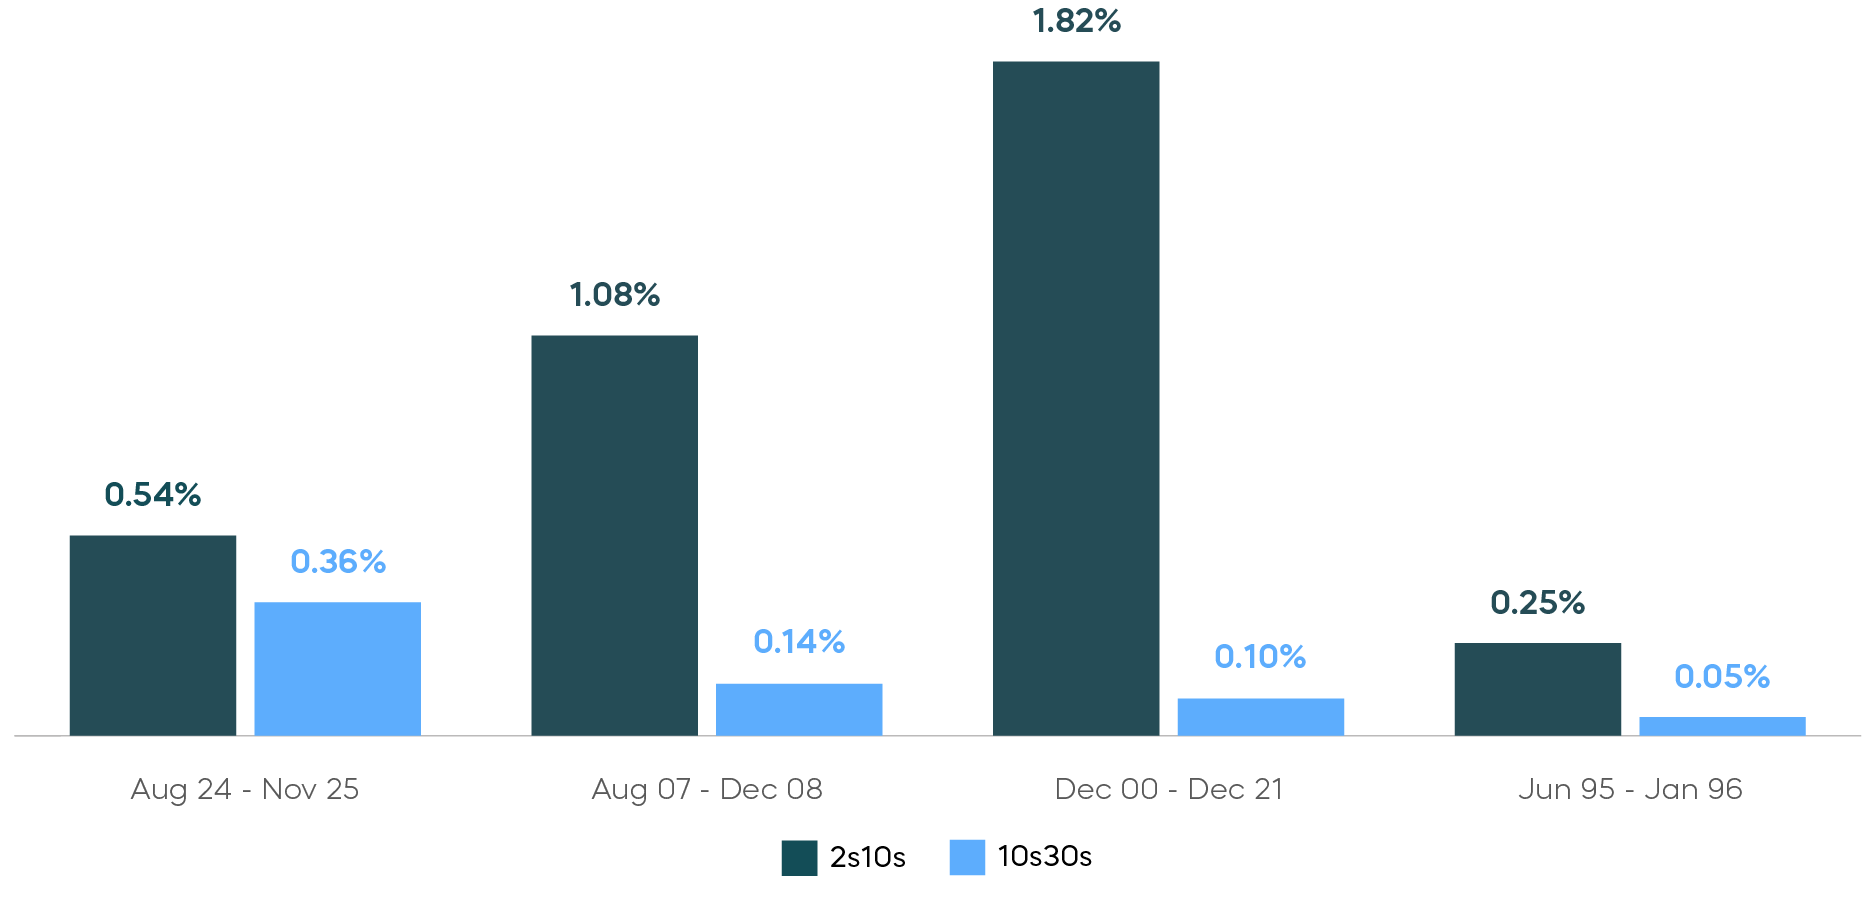 Source: Bloomberg, November 2025.
This long-end steepening suggests a rising risk premium for long-duration Treasuries. Markets are demanding compensation for inflation uncertainty. Whether that premium persists could hinge on how inflation behaves amid the cooling labor market.
After decades of dormancy, the 2020s have marked a tentative return of the Phillips Curve, a negative relationship between unemployment and inflation. The relationship first re-emerged post-pandemic, as aggressive fiscal and monetary stimulus created a powerful positive demand shock. But as that demand distortion fades, a higher unemployment rate may no longer lead to a proportionate decline in inflation.
While reflation is not our base case, sticky inflation remains a significant risk. Historically, bonds only provide diversification when inflation is contained. For example, during the inflationary regimes of the 1970s–1980s, correlations turned positive. Seeing as incremental tariff revenues have done little to offset the long-term trajectory of U.S. fiscal deficits, flare-ups in inflation expectations could sharply impact long-duration returns. Investors should, therefore, remain cautious about exposure at the very long end of the yield curve.
Bonds Typically Diversify Stocks When Inflation Risks Are Benign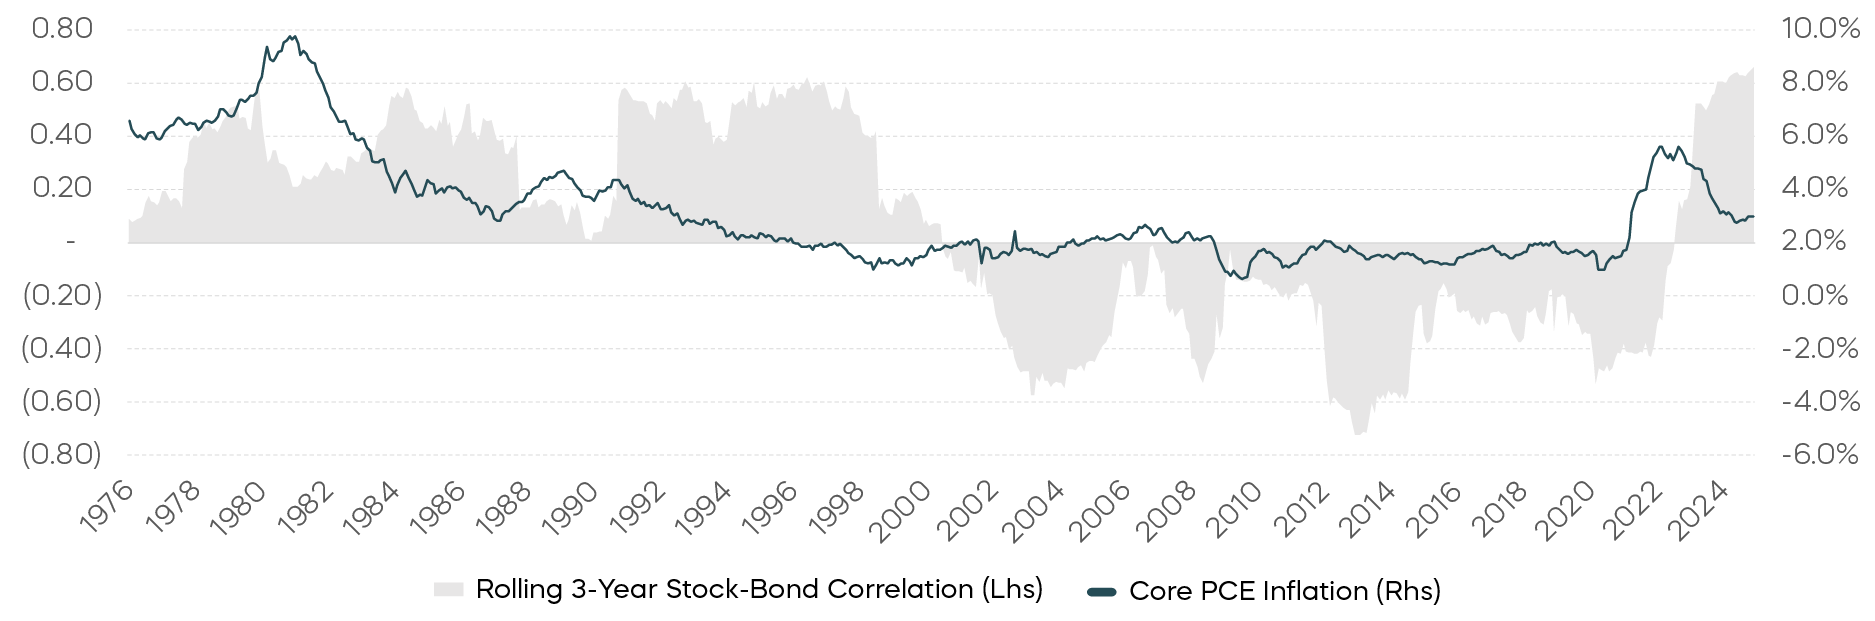
Source: Bloomberg. Data from January 1973 through December 2024.
Bond Investors Have a Lot Riding on AI
AI has been a dominant narrative in the equity market for years now, driving both market-cap leadership and historic capital expenditures. But for bond investors, AI’s role as a potential disinflationary force is becoming equally critical.
The adoption of personal computers in the 1990s may offer a useful, if imperfect, precedent for us to consider. The productivity boom of that period raised real growth while reducing inflation risk premiums, supporting lower long-term yields. AI, however, differs in both scale and composition. Its rollout requires heavy upfront investment in semiconductors, data centers, and energy infrastructure, which makes it an initially inflationary force. The key question is whether resulting productivity gains will eventually outweigh those cost pressures.
We have a cautiously optimistic view. Technological innovation is generally deflationary over the long run, driven by the pursuit of efficiency. Already, an AI agent powered by GPT-4o processing 500,000 input tokens and 100,000 output tokens costs roughly $4.50, which is cheaper than an hour of human administrative labor, and the cost will continue to decline. If AI effectively substitutes for labor, it may primarily represent a positive supply shock, potentially reducing inflation in the context of persistently high long-term Treasury yields and deteriorating fiscal conditions.
AI Innovation May Be Deflationary Over the Long Term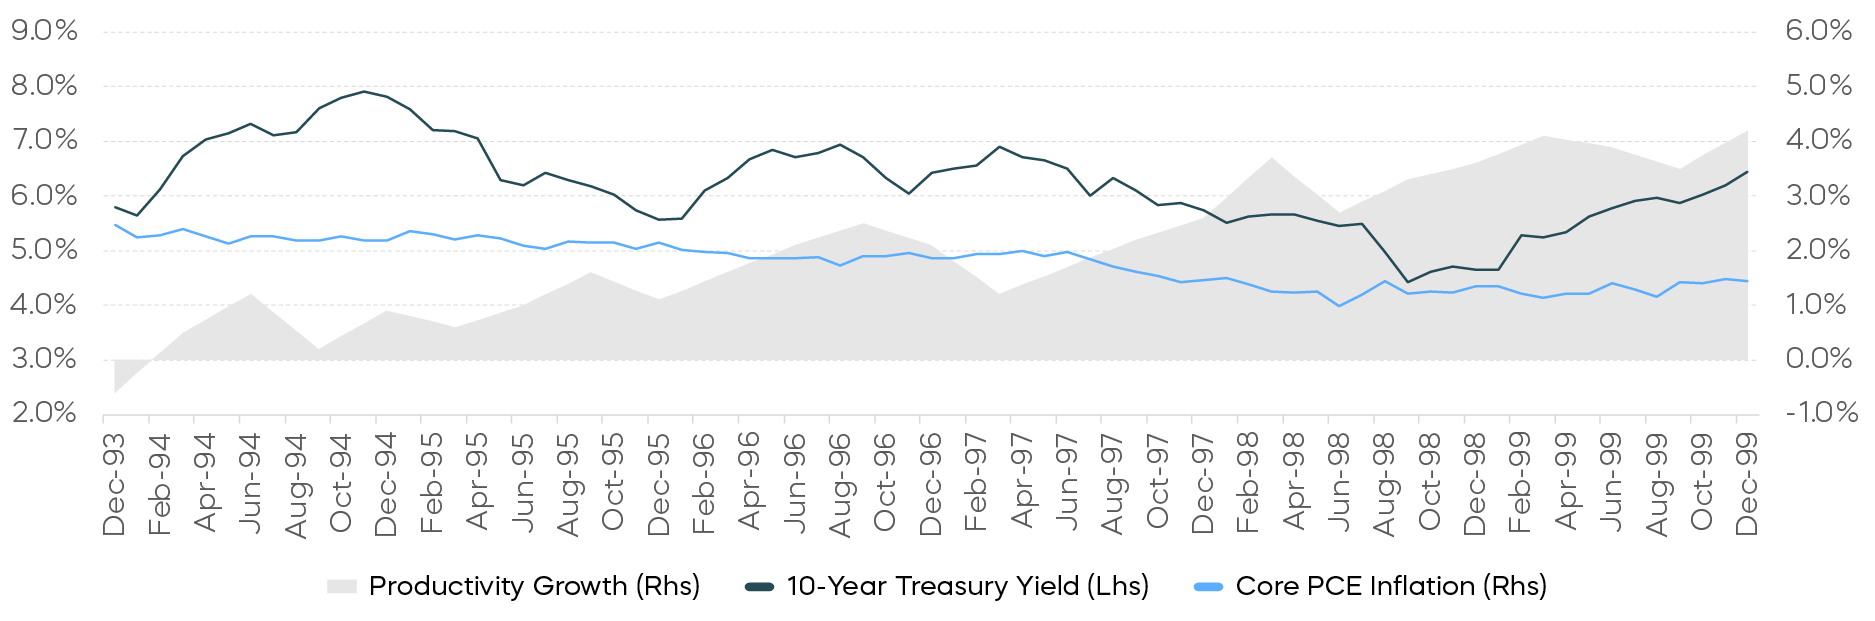 Source: Bloomberg, Bureau of Labor Statistics, Office of Productivity and Technology, data from December 1993 through December 1999.
The range of possible macro outcomes from AI remains wide, but one conclusion is clear: Bond investors, like equity investors, have a lot riding on AI.