
Resilience in a Market Downturn
Quality Drove Results

Source: Bloomberg. Index performance returns do not reflect any management fees, transaction costs or expenses. Indexes are unmanaged, and one cannot invest in an index.
Consistent Dividend Growers Have Captured More of the Market’s Gain, with Less of the Loss
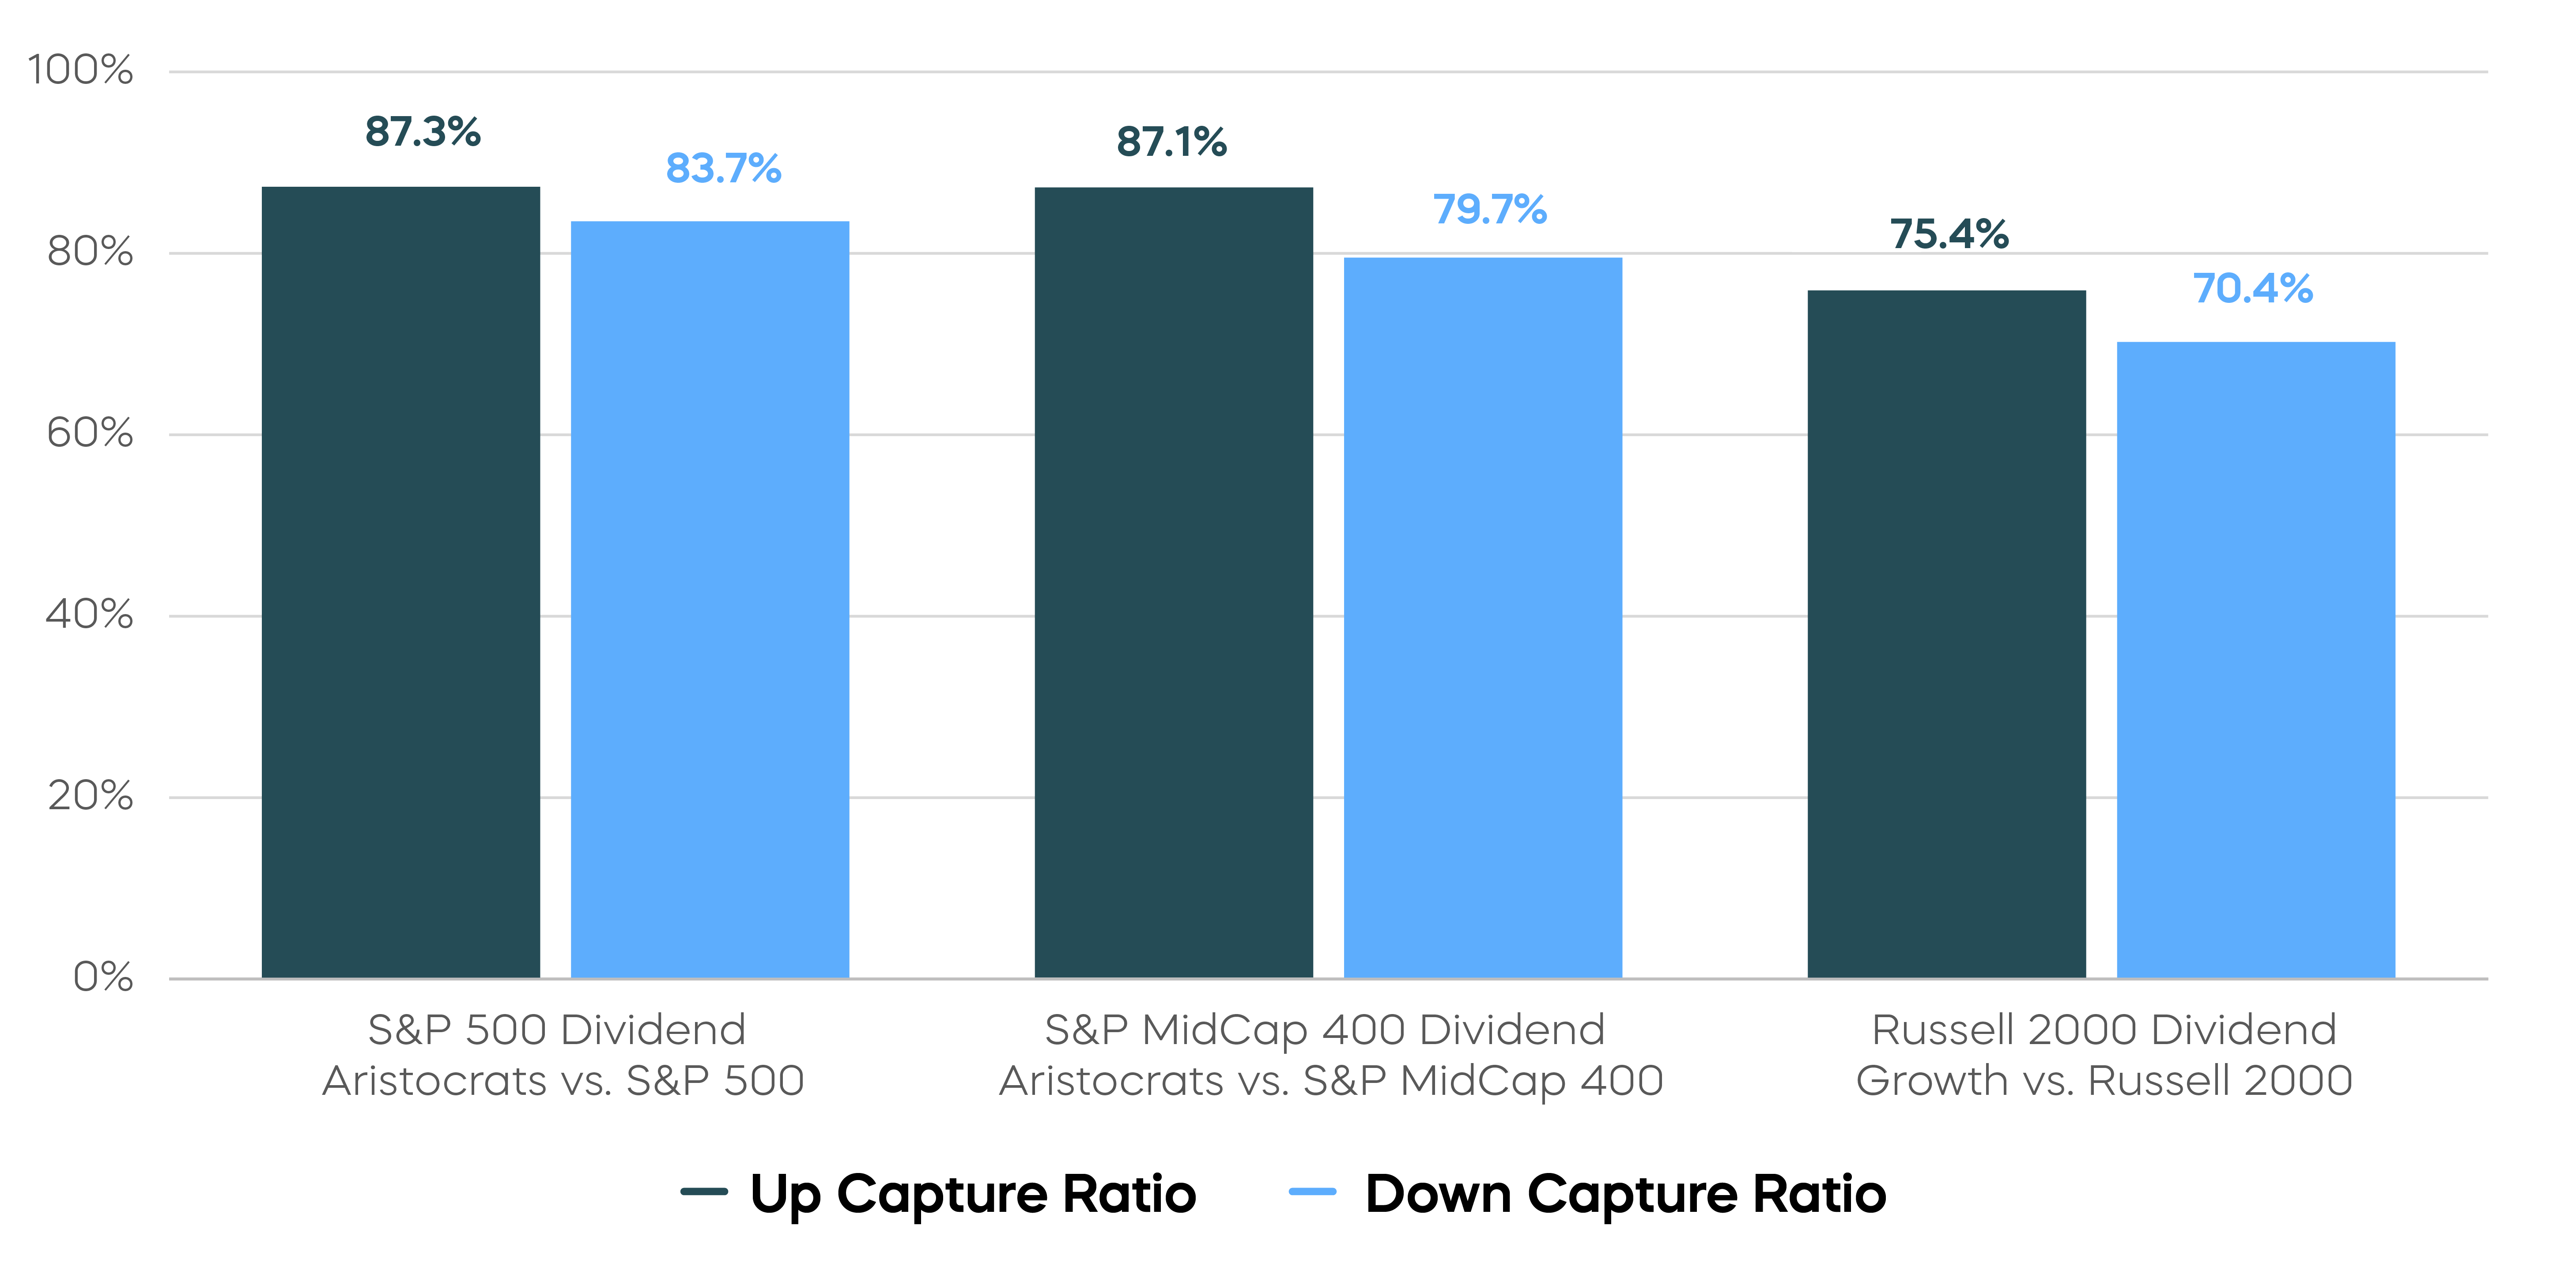
Source: Morningstar. S&P 500 Dividend Aristocrats: 5/2/05–3/31/26. S&P MidCap 400 Dividend Aristocrats: 1/5/15–3/31/26. Russell 2000 Dividend Growth: 11/11/14–3/31/26. “Up capture ratio” measures the performance of a fund or index relative to a benchmark when that benchmark has risen. Likewise, “down capture ratio” measures performance during periods when the benchmark has declined. Ratios are calculated by dividing monthly returns for the fund’s index by the monthly returns of the primary index during the stated time period and multiplying that factor by 100.
How Can This Benefit Investors?
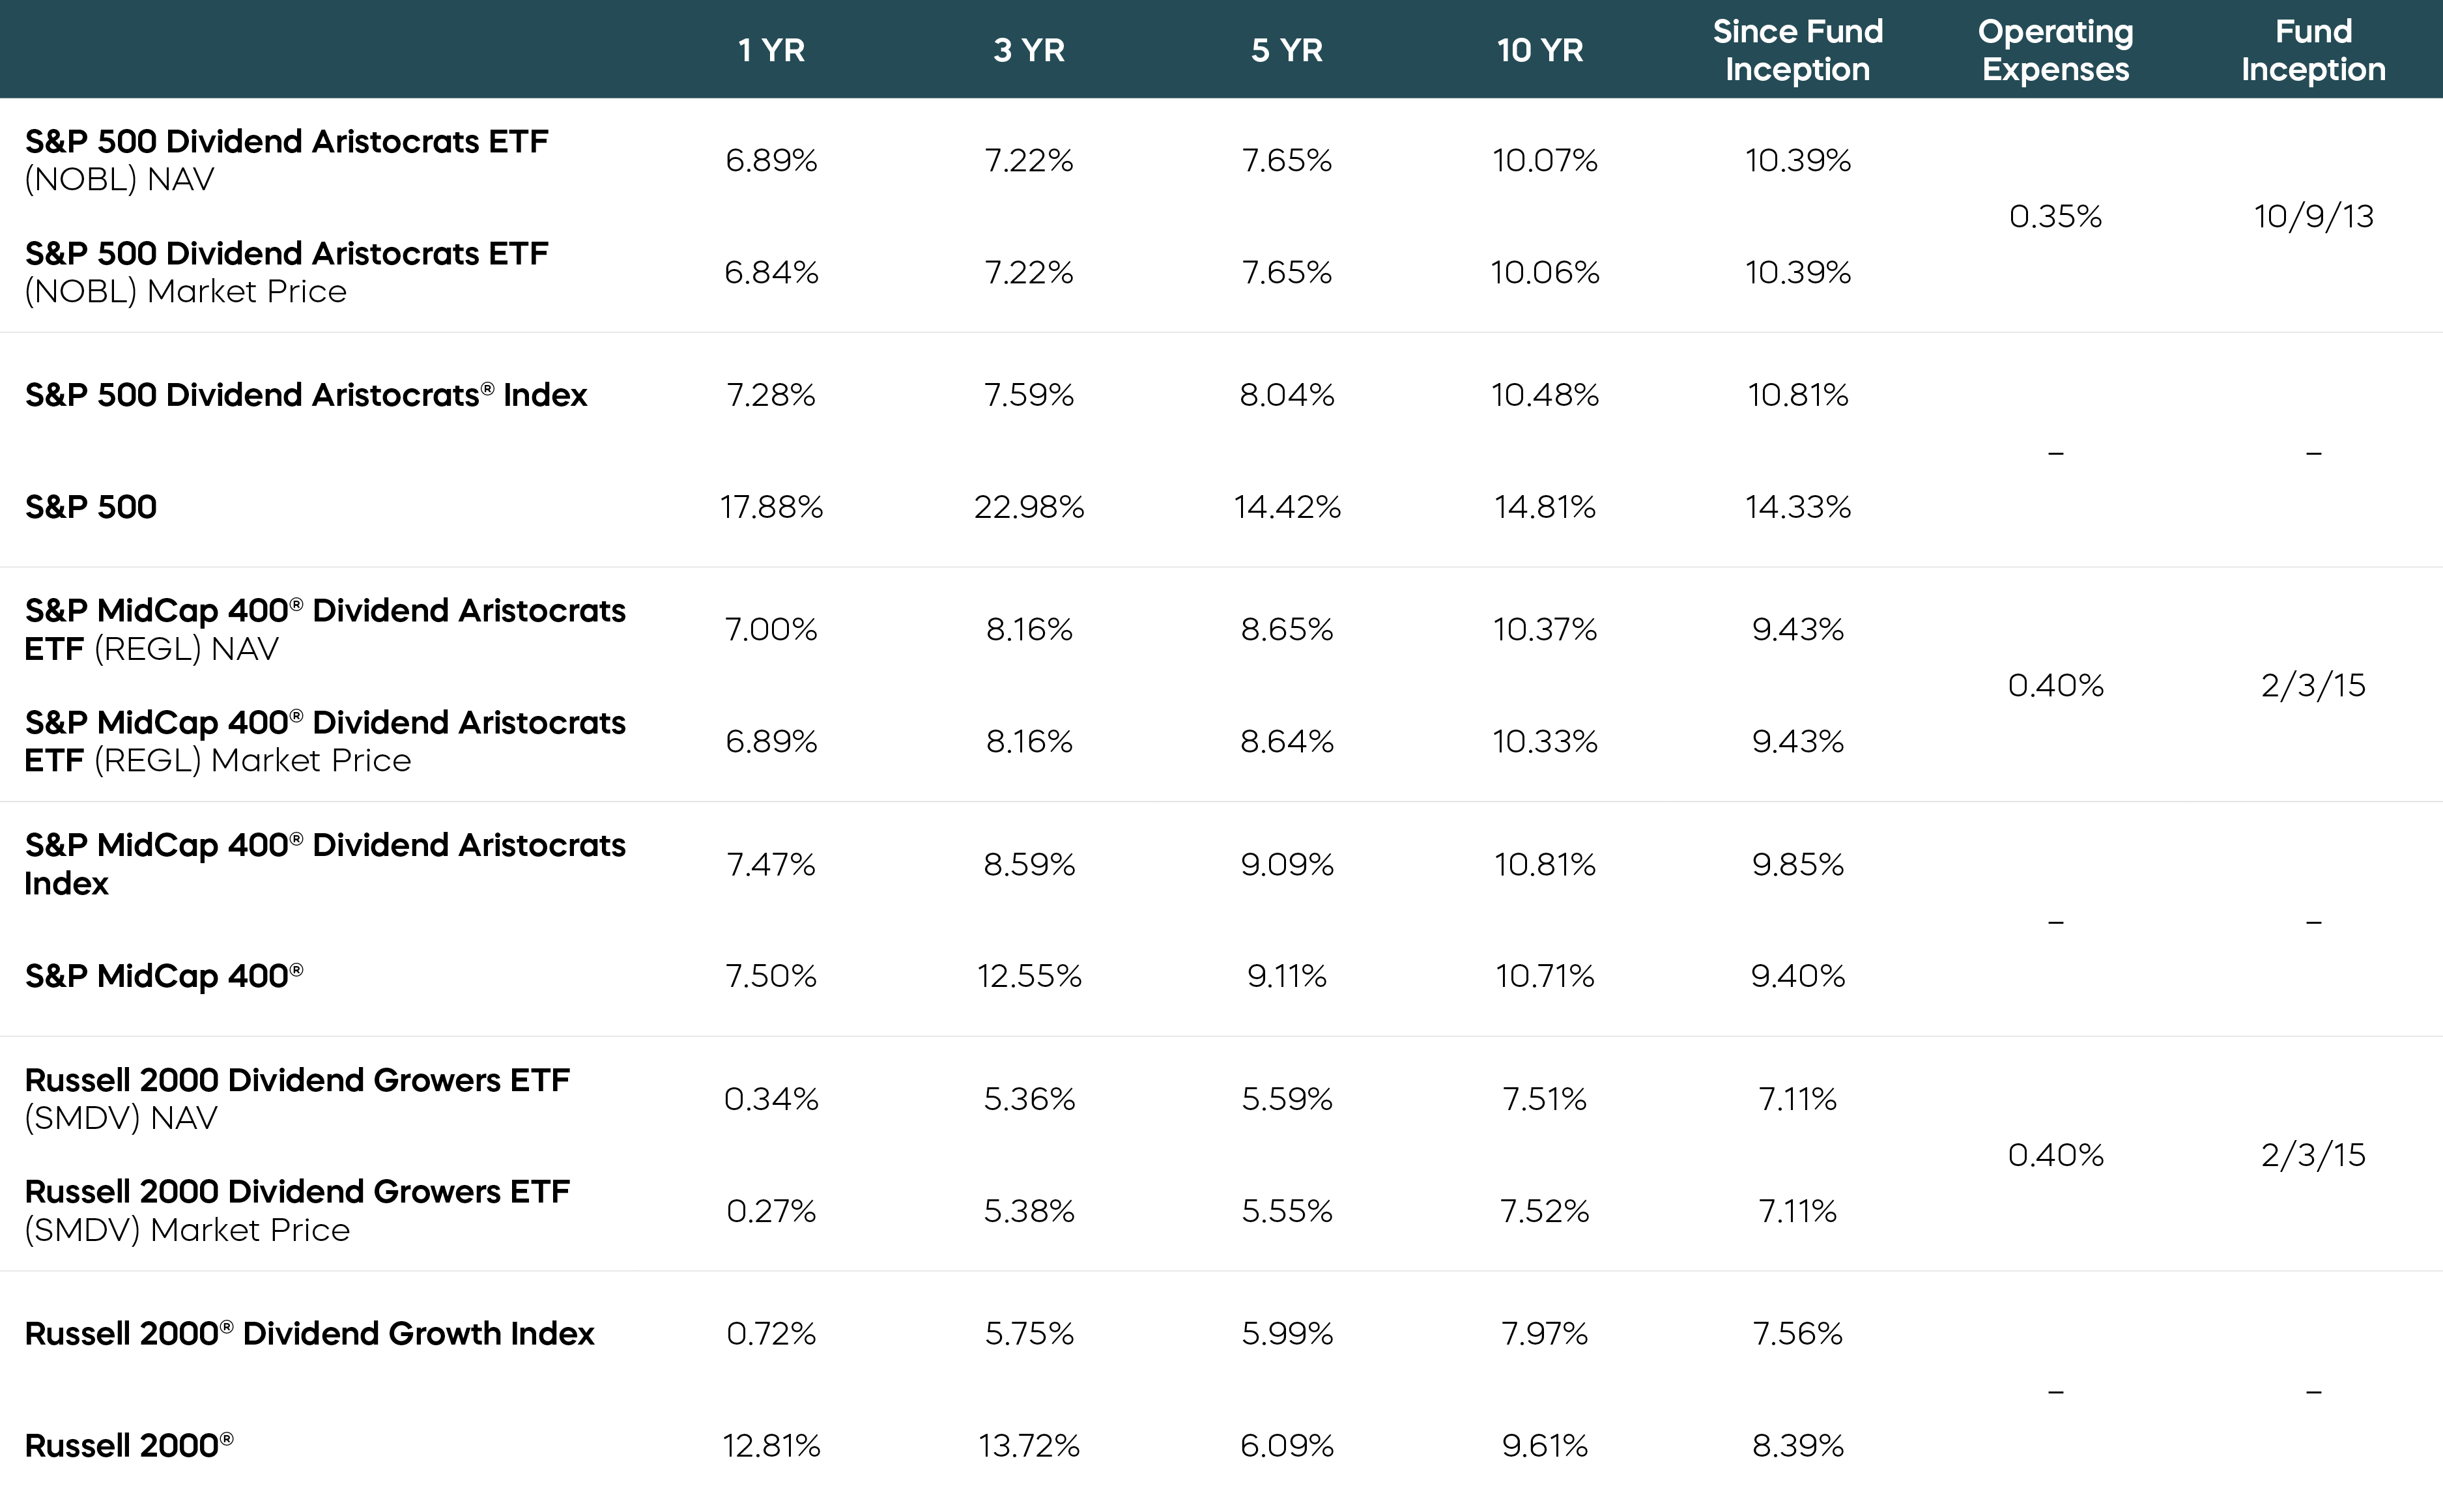
The performance quoted represents past performance and does not guarantee future results. Investment return and principal value of an investment will fluctuate so that an investor's shares, when sold or redeemed, may be worth more or less than the original cost. Shares are bought and sold at market price (not NAV) and are not individually redeemed from the fund. Market price returns are based upon the midpoint of the bid/ask spread at 4:00 p.m. ET (when NAV is normally determined for most funds) and do not represent the returns you would receive if you traded shares at other times. Your brokerage commissions will reduce returns. Current performance may be lower or higher than the performance quoted. Standardized returns and data current to the most recent month end may be obtained by visiting ProShares.com.
Learn More
NOBL
S&P 500 Dividend Aristocrats ETF
Seeks investment results, before fees and expenses, that track the performance of the S&P 500® Dividend Aristocrats® Index.
REGL
S&P MidCap 400 Dividend Aristocrats ETF
Seeks investment results, before fees and expenses, that track the performance of the S&P MidCap 400® Dividend Aristocrats® Index.
SMDV
Russell 2000 Dividend Growers ETF
Seeks investment results, before fees and expenses, that track the performance of the Russell 2000® Dividend Growth Index.