Key Observations
The Federal Reserve cut its Fed Funds rate by 25 bps, the 10-year Treasury yield went up 10 bps, and the S&P 500 ended the month of October up over 2%. Let’s unpack those results. As we pointed out in our recent post-rate cut commentary: "A 4% 10-Year Treasury yield already prices in inflation ultimately getting to 2% … If inflation gets stuck around 3%, the 10-year yield could in fact drift up." If inflation does fall to 2% and the Fed is able to further reduce the Fed Funds rate, the 10-year Treasury yield is unlikely to fall farther, and it’s those longer-term yields that have a greater impact on stock market valuations. Moreover, a stable 10-year Treasury yield is unlikely to fuel future multiple expansion in price-to-earnings (P/E) ratios.
Another factor unlikely to drive multiple expansion is relative valuations. The narrative is ubiquitous—parts of the market look relatively cheap, but only compared to large-cap stocks. As the chart below demonstrates, the price-to-book (P/B) ratio of the S&P 500 stands at 5.6, while mid-cap and small-cap stocks are less than half that. Those discounts serve as many experts’ foundational argument for the “broadening” of the current market rally. But based on valuations alone, that foundation could seem a bit shaky.
Chart of the Month
Equity Index Price-to-Book Ratio Comparison
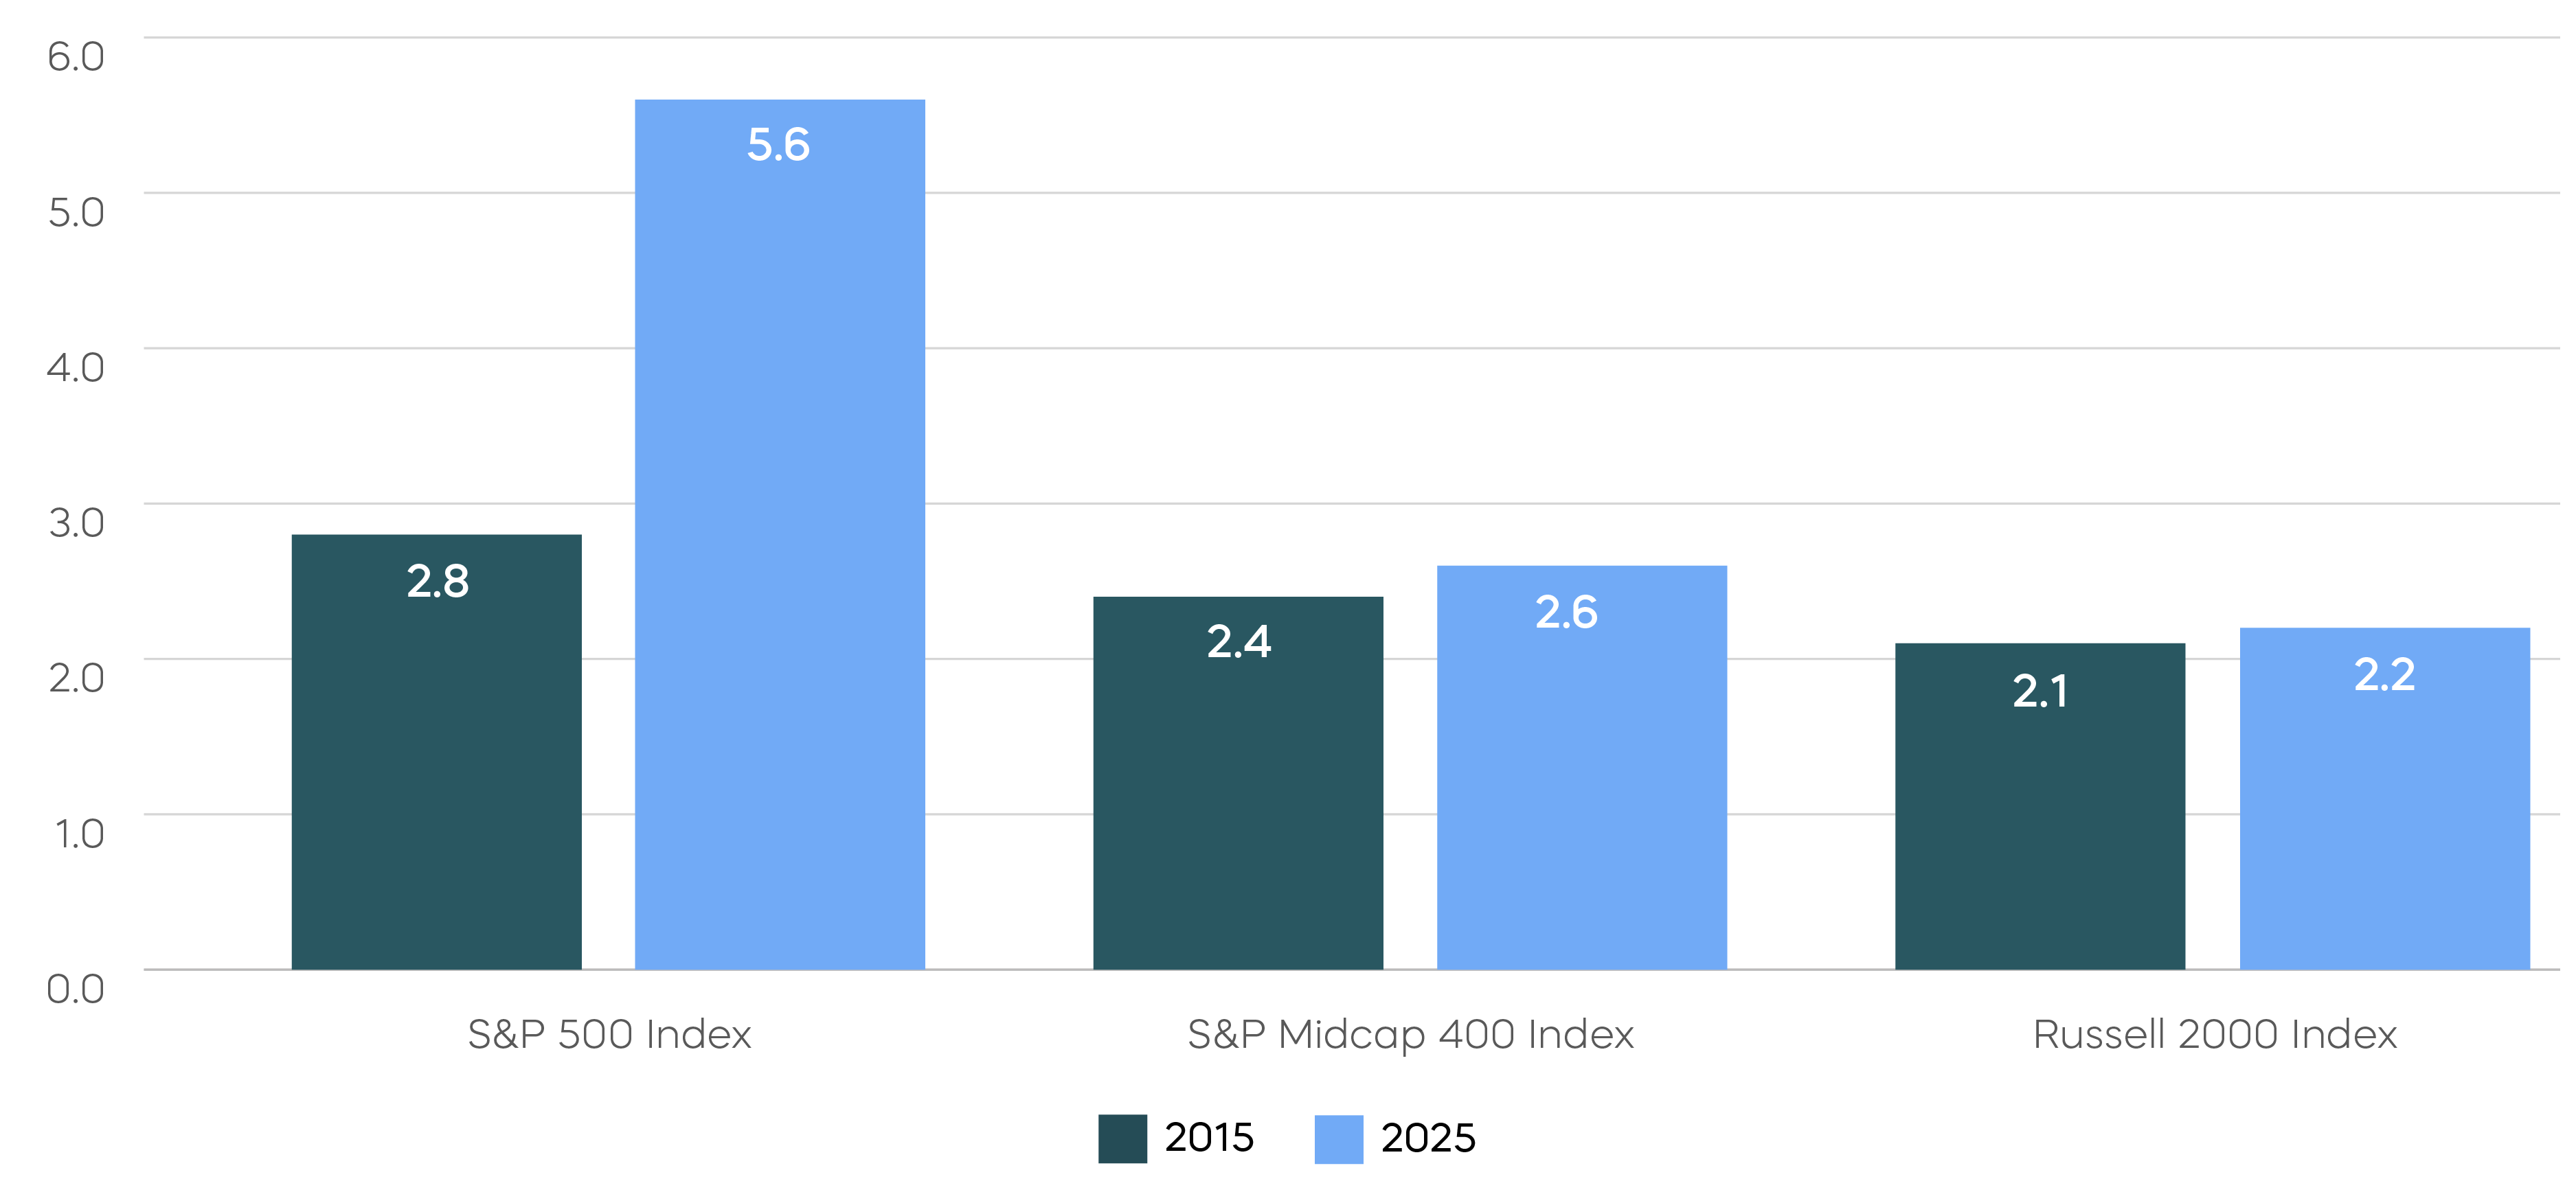 Source: Bloomberg, data as of 10/31/2015 and 10/31/2025. Index returns are for illustrative purposes only and do not reflect any management fees, transaction costs or expenses. Indexes are unmanaged, and one cannot invest directly in an index. Past performance does not guarantee future results.
The low relative valuations of mid-cap and small-cap stocks (and other asset classes) have been driven mostly by the S&P 500 getting more expensive rather than other assets getting cheaper. In reality, if you compare the 2015 and 2025 values for mid and small caps shown in the chart, they are trading today at roughly the same valuations as they were 10 years ago. Counting on multiple expansion to broaden the market rally could be a mistake.
If neither the Fed nor multiple expansion look bullish, what’s likely to drive near-term stock prices? It’s all about earnings.
Third-quarter earnings are supporting both the market’s highflyers and a broadening at the lower altitudes. With more than half of companies reporting, S&P 500 earnings have risen by over 11% year over year—the tech sector alone has earnings up over 24%. That is solid support for the highflyers. But mid-cap earnings are up nearly 12% as well, and small-cap earnings have climbed by almost 19%. If those numbers hold for the remainder of earnings season, Santa may have an easy time delivering a year-end rally.
Asset Class Perspectives
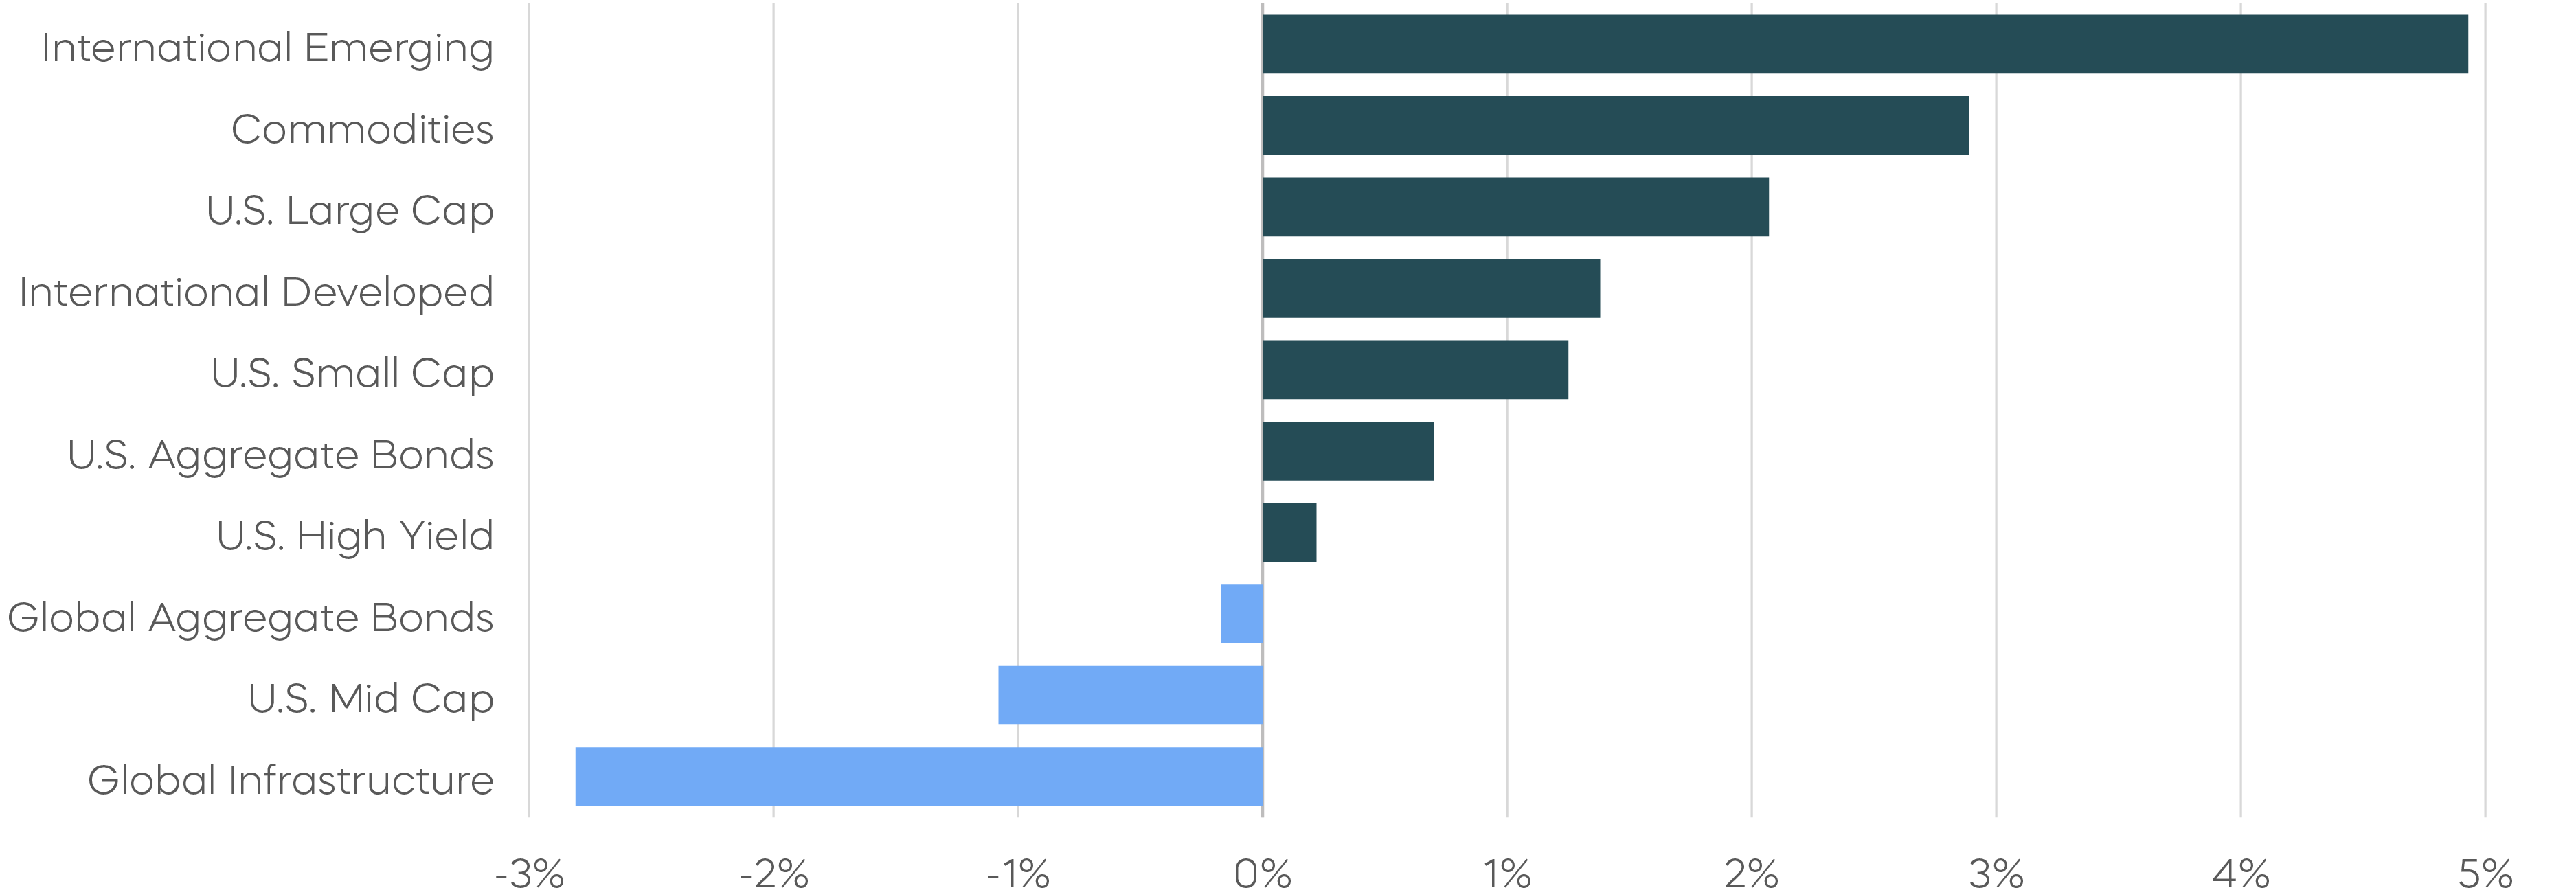
Asset Class Returns—October 2025
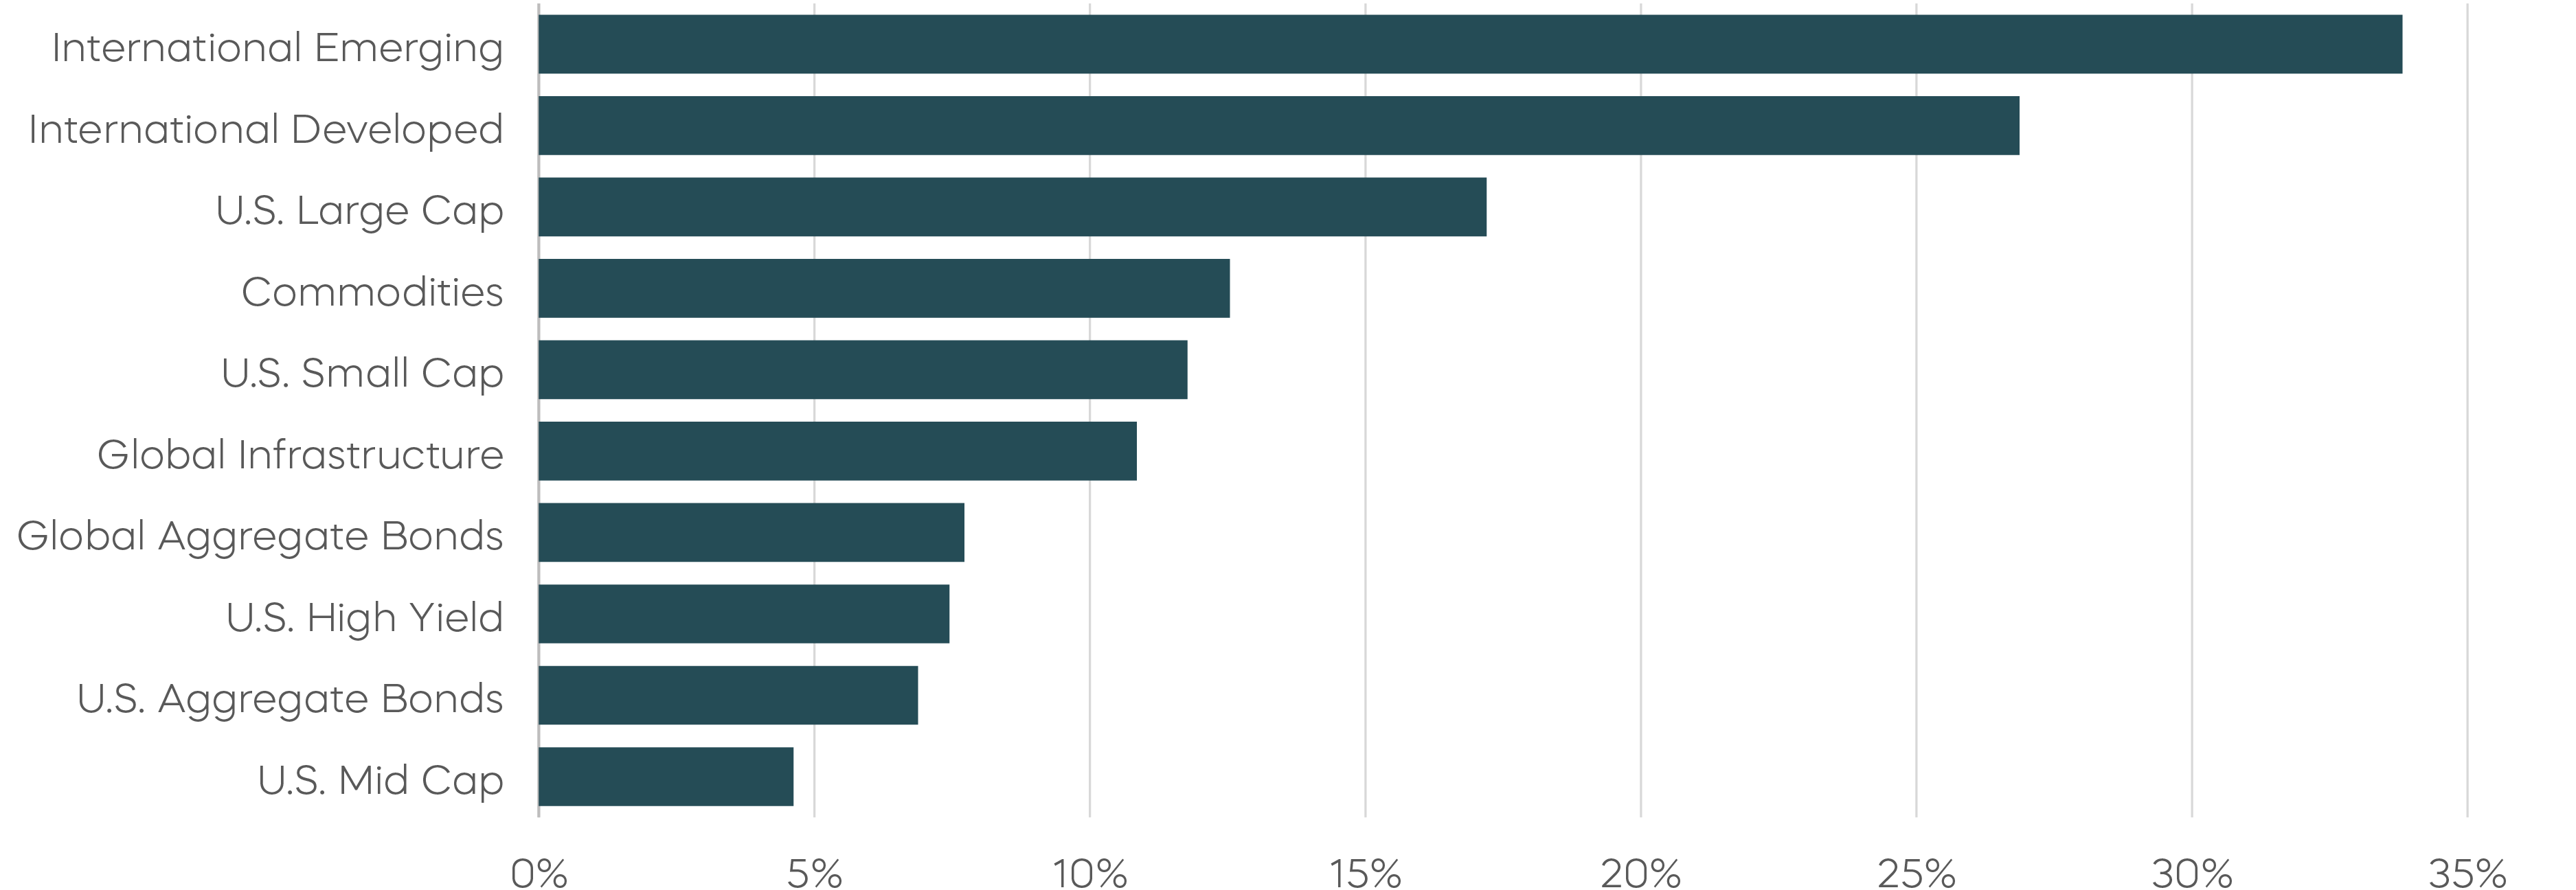
Asset Class Returns—Year-to-Date
 Source: Bloomberg. October returns 10/1/25–10/31/25; year-to-date returns 1/1/25‒10/31/25. Index returns are for illustrative purposes only and do not reflect any management fees, transaction costs or expenses. Indexes are unmanaged, and one cannot invest directly in an index. Past performance does not guarantee future results.
The following are observations on a range of asset classes. For each, green indicates a constructive backdrop, yellow indicates a neutral environment, and red would indicate a challenging backdrop.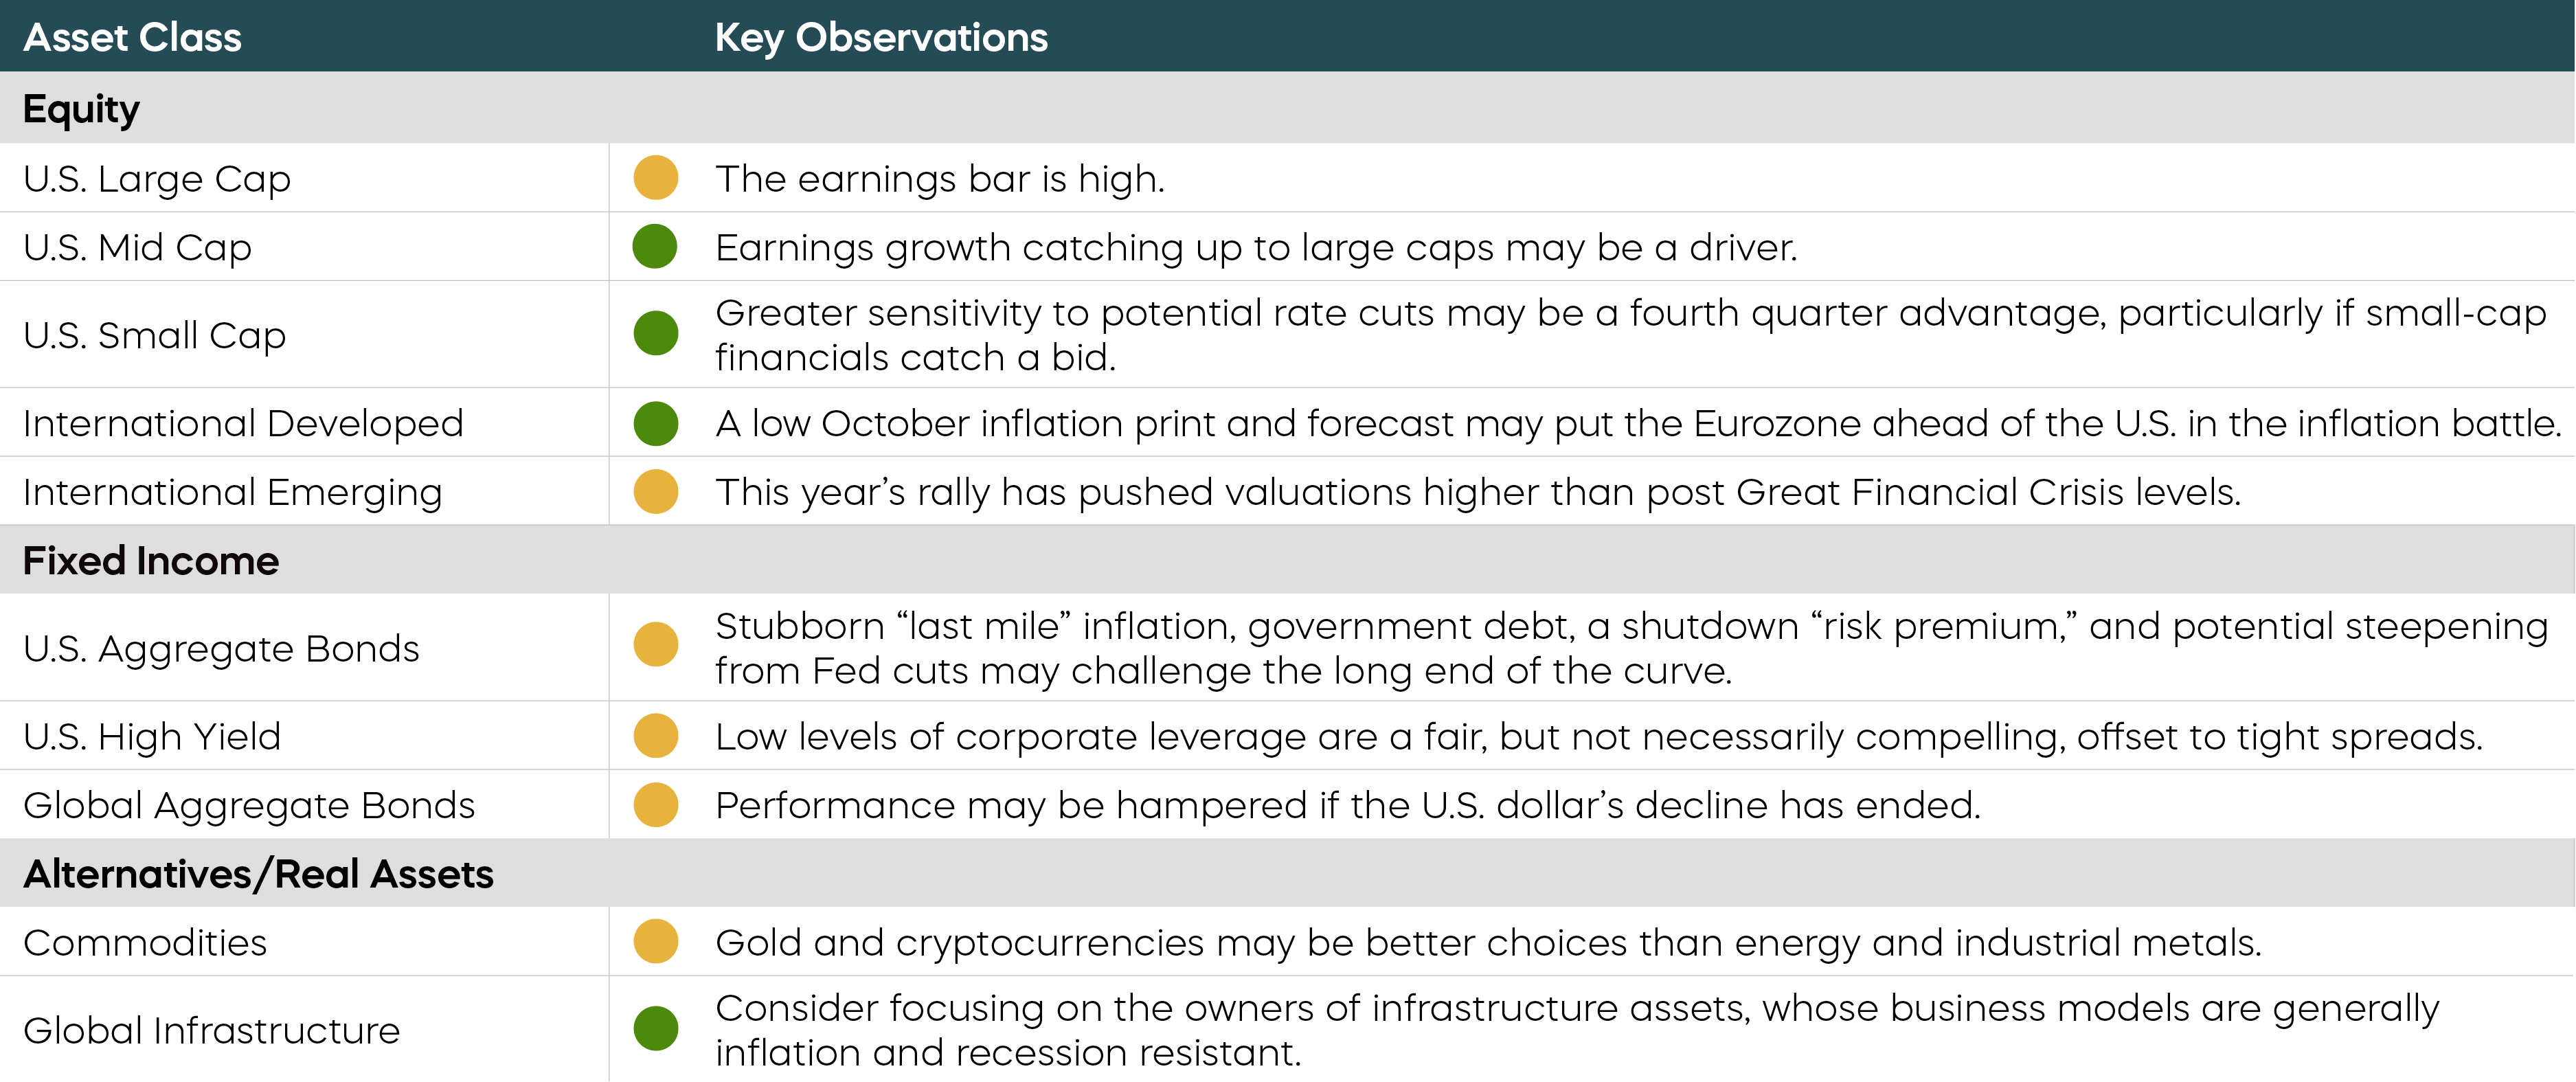
Economic Calendar
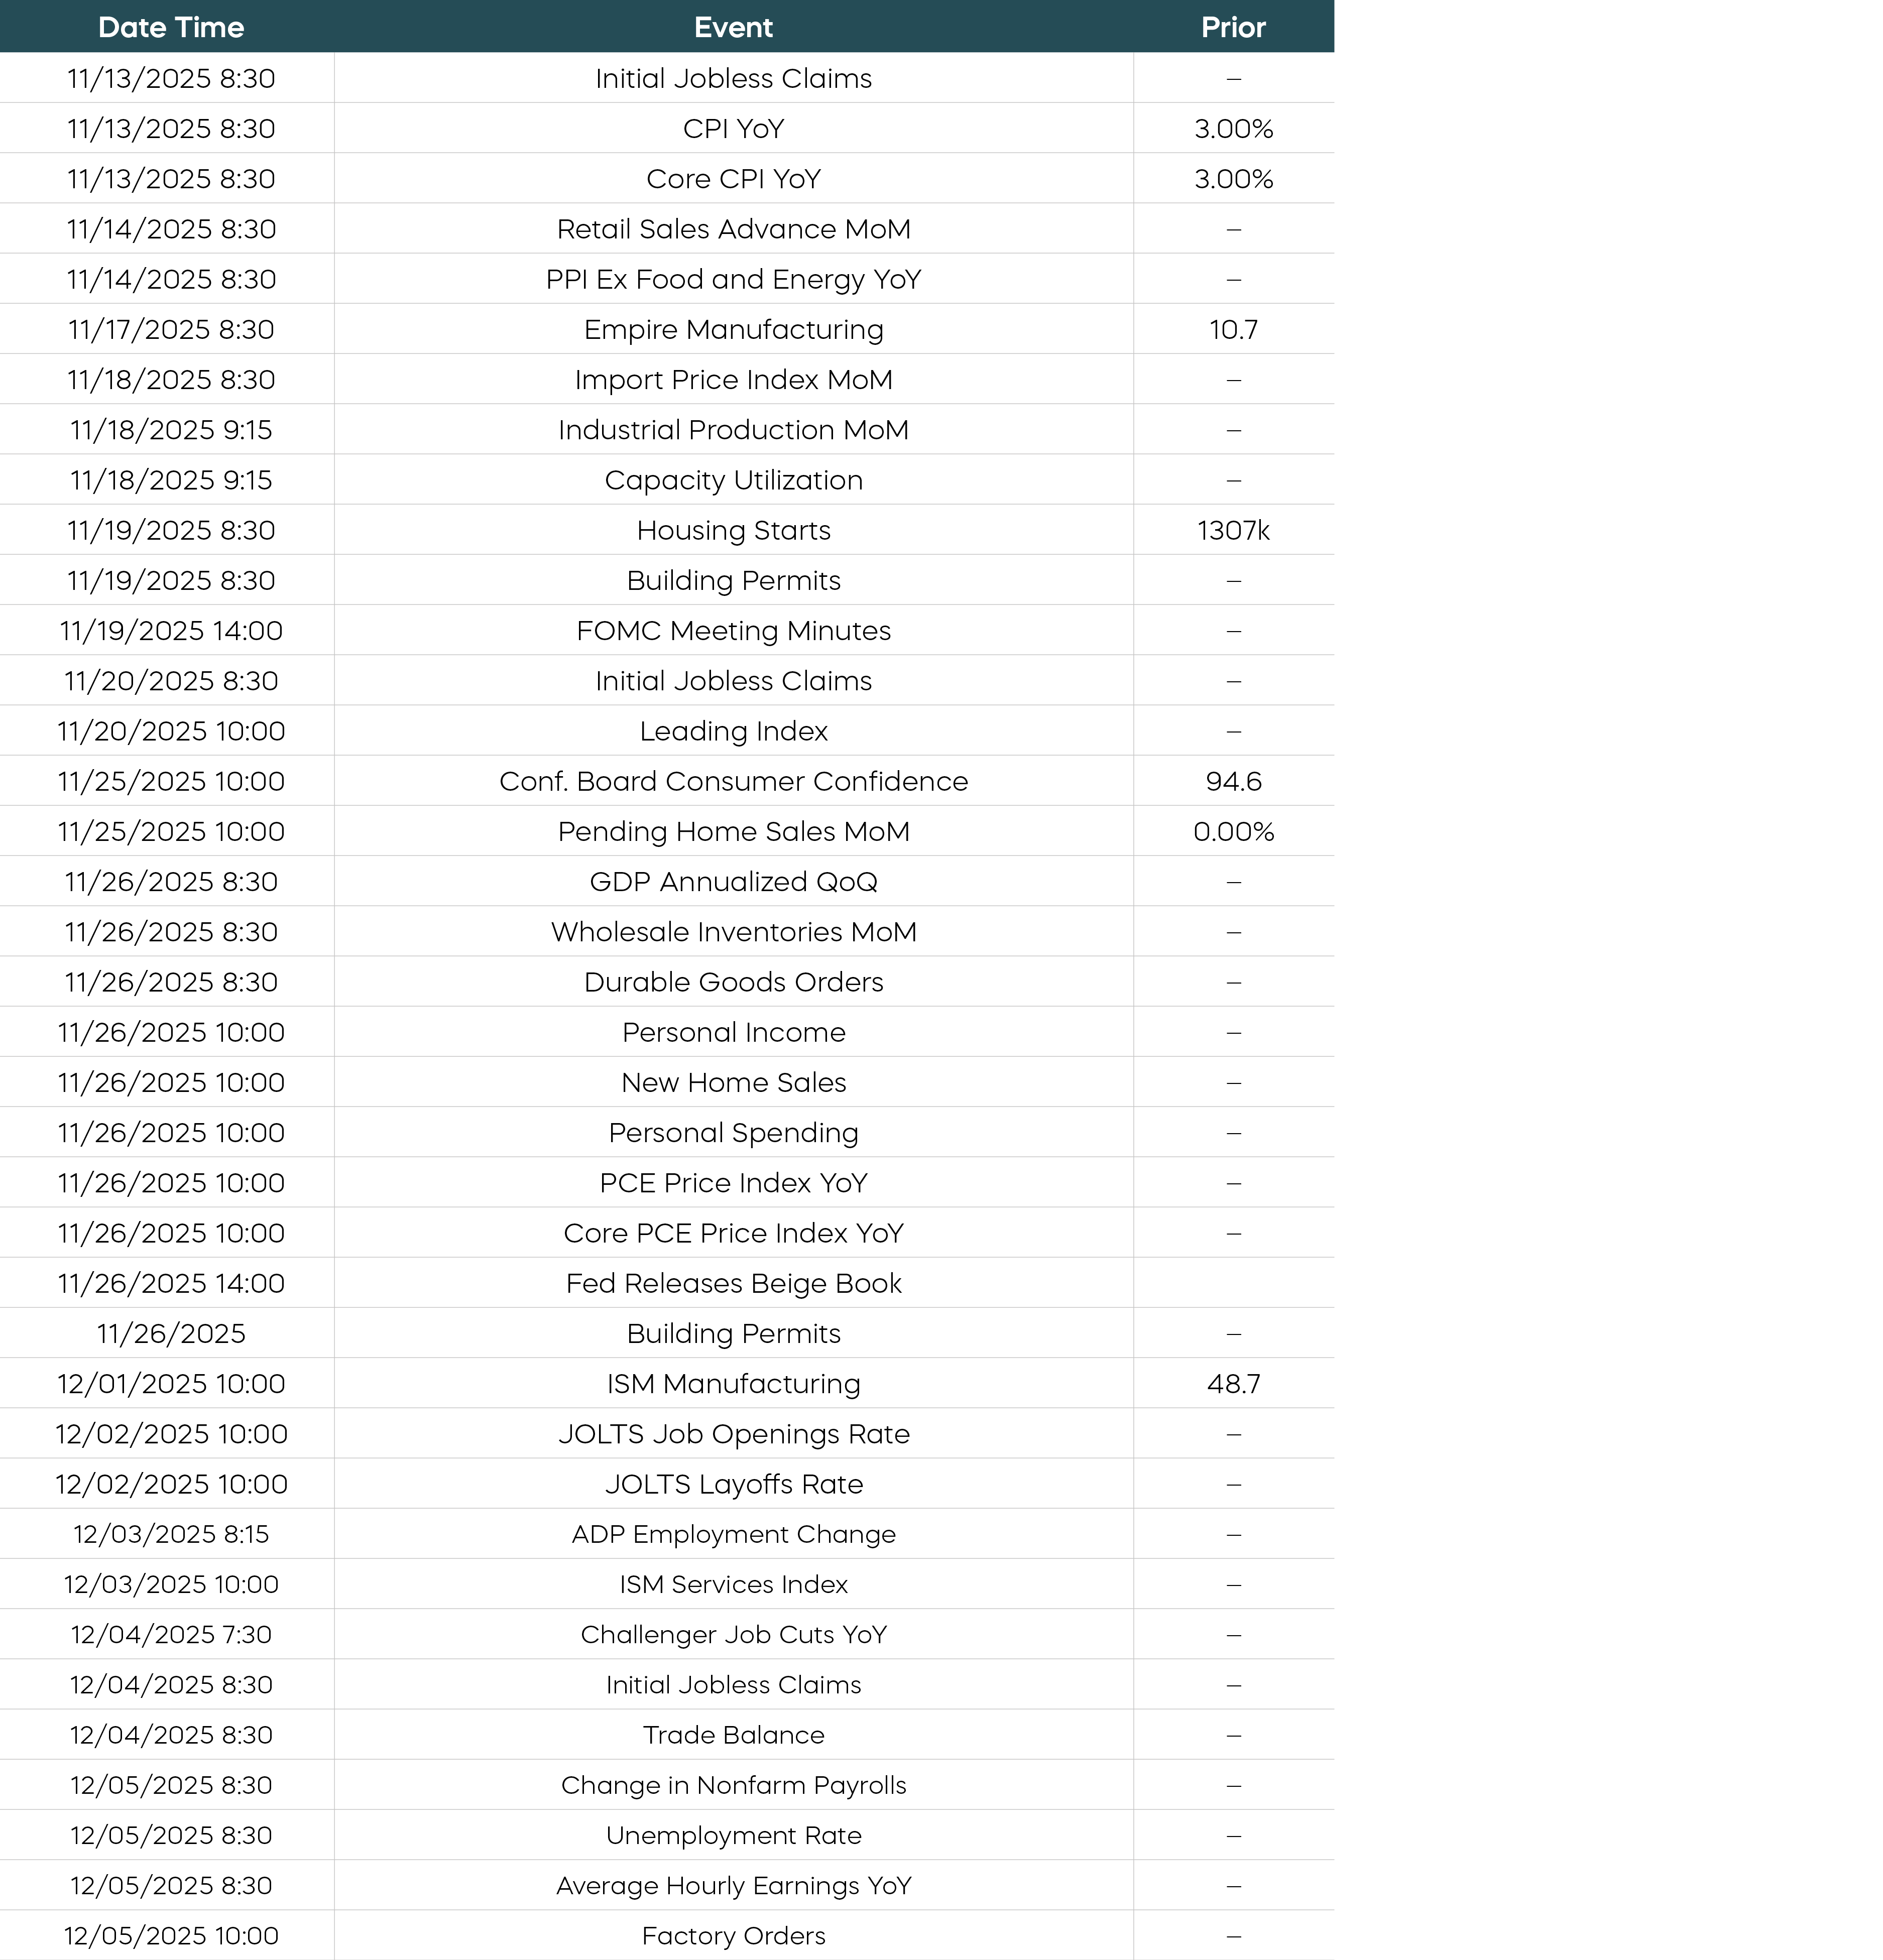 Source: Bloomberg. Data as of 11/3/25. The U.S. government shutdown may impact data releases.
Equity Perspectives
The Low-Volatility Rally Remains Supported by Fundamentals
Despite its reputation as a scary (and volatile) month for markets, October delivered the sixth consecutive month of positive returns. The S&P 500 gained 2.3%, according to Bloomberg. But it’s not just October that has been relatively quiet. Both realized and implied levels of volatility have been lower than normal since the current S&P 500 rally began in April, as demonstrated by the VIX remaining below its 200-day moving average.[1]
An obvious explanation for equity market buoyancy is company fundamentals, which haven’t just been good—they’ve been trending stronger.
There is evidence of this both in expanding profit margins and in the upward revision of earnings growth estimates those margins are fueling. Together, they provide a powerful support mechanism to the current rally.
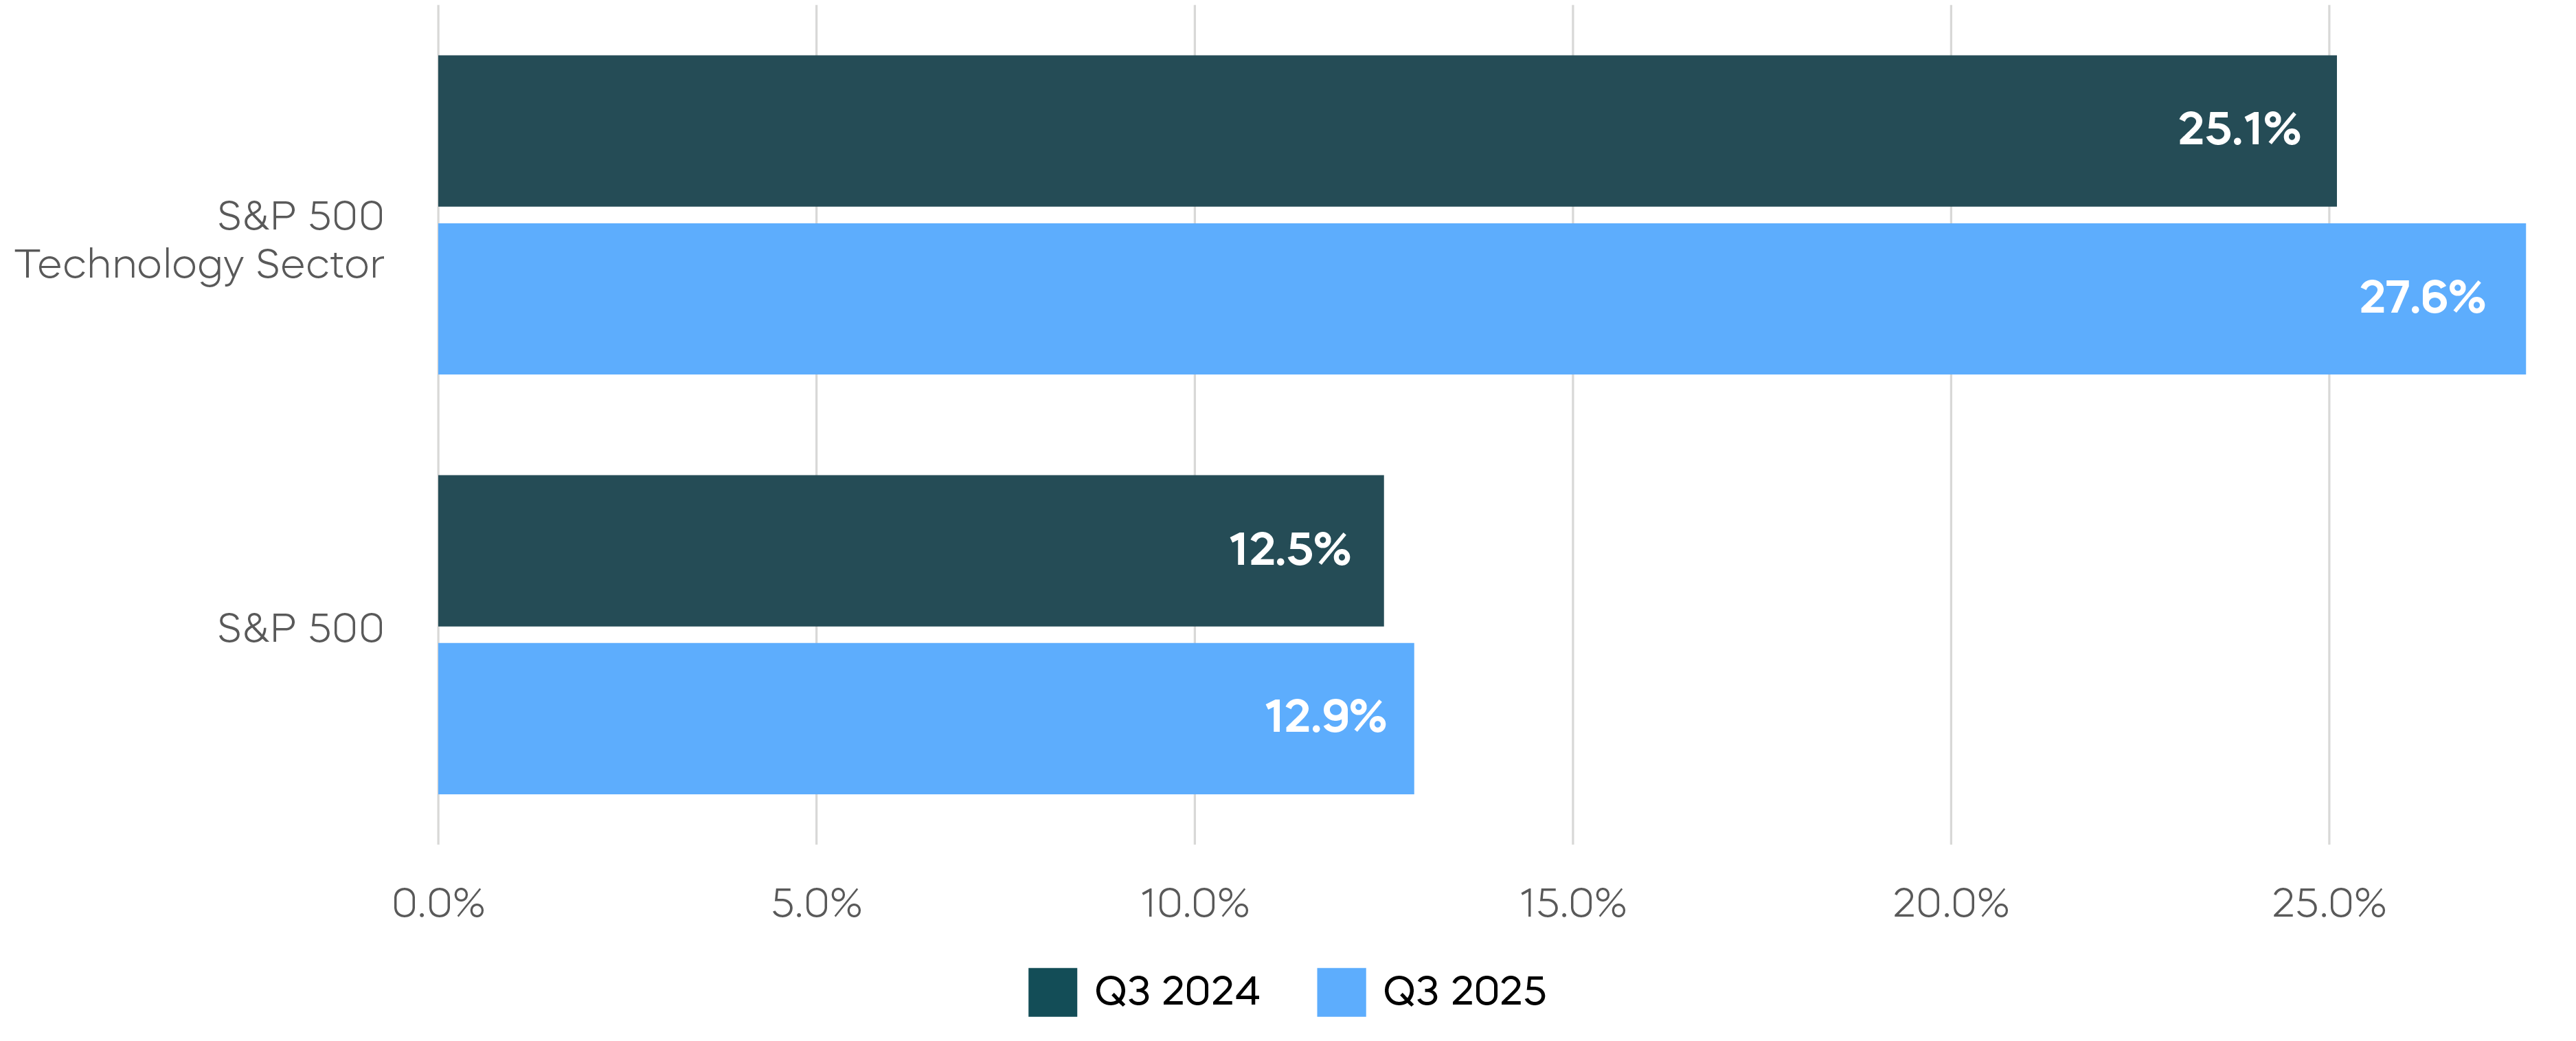
Expanding Profit Margins Have Driven Earnings Growth
 Source: FactSet, data as of10/31/25. Index returns are for illustrative purposes only and do not reflect any management fees, transaction costs or expenses. Indexes are unmanaged, and one cannot invest directly in an index. Past performance does not guarantee future results.
As the chart above shows, third-quarter profit margins for the S&P 500 stand at 12.9%, up from 12.5% last year, per FactSet. Tech stocks—which have been the growth engine of this market—are doing even better, with margins up 2.5% over last year. When margins improve, companies often raise their earnings estimates. S&P 500 earnings growth for this third quarter now stands at 11%, up almost 3% from September estimates. Tech stock earnings growth has been revised 5% higher.
How to Improve the Costly Tradeoff of Traditional Covered Call Strategies
Covered call strategies remain popular with investors who want to target high levels of income while still trying to participate in today’s strong equity market. But most covered call strategies use options that expire on a monthly basis, which can lead to a costly tradeoff of total returns in favor of income.
Many investors attempt to rationalize this tradeoff based on a perception that covered call strategies can help manage risk or hedge their portfolios. Market returns in 2025 have highlighted why this might be a misguided notion.
Looking at the chart below, Liberation Day tariff announcements introduced a burst of volatility in early April and sent markets sharply lower—the S&P 500 declined roughly 15% at the low point of the year. The CBOE S&P 500 BuyWrite Index (BXM Index), which serves as a proxy for traditional monthly covered call strategies, declined 12.6% during the same period—hardly an equity hedge.
When implementation of initial tariffs was ultimately delayed and countries started negotiating for lower rates, markets began a rally that hasn’t stopped. From its April low through October, the S&P 500 has risen more than 38%. Meanwhile, the monthly covered call strategy of the BXM Index captured only about half of those returns.
The S&P 500 Daily Covered Call Index Has Captured More of the Market's Upside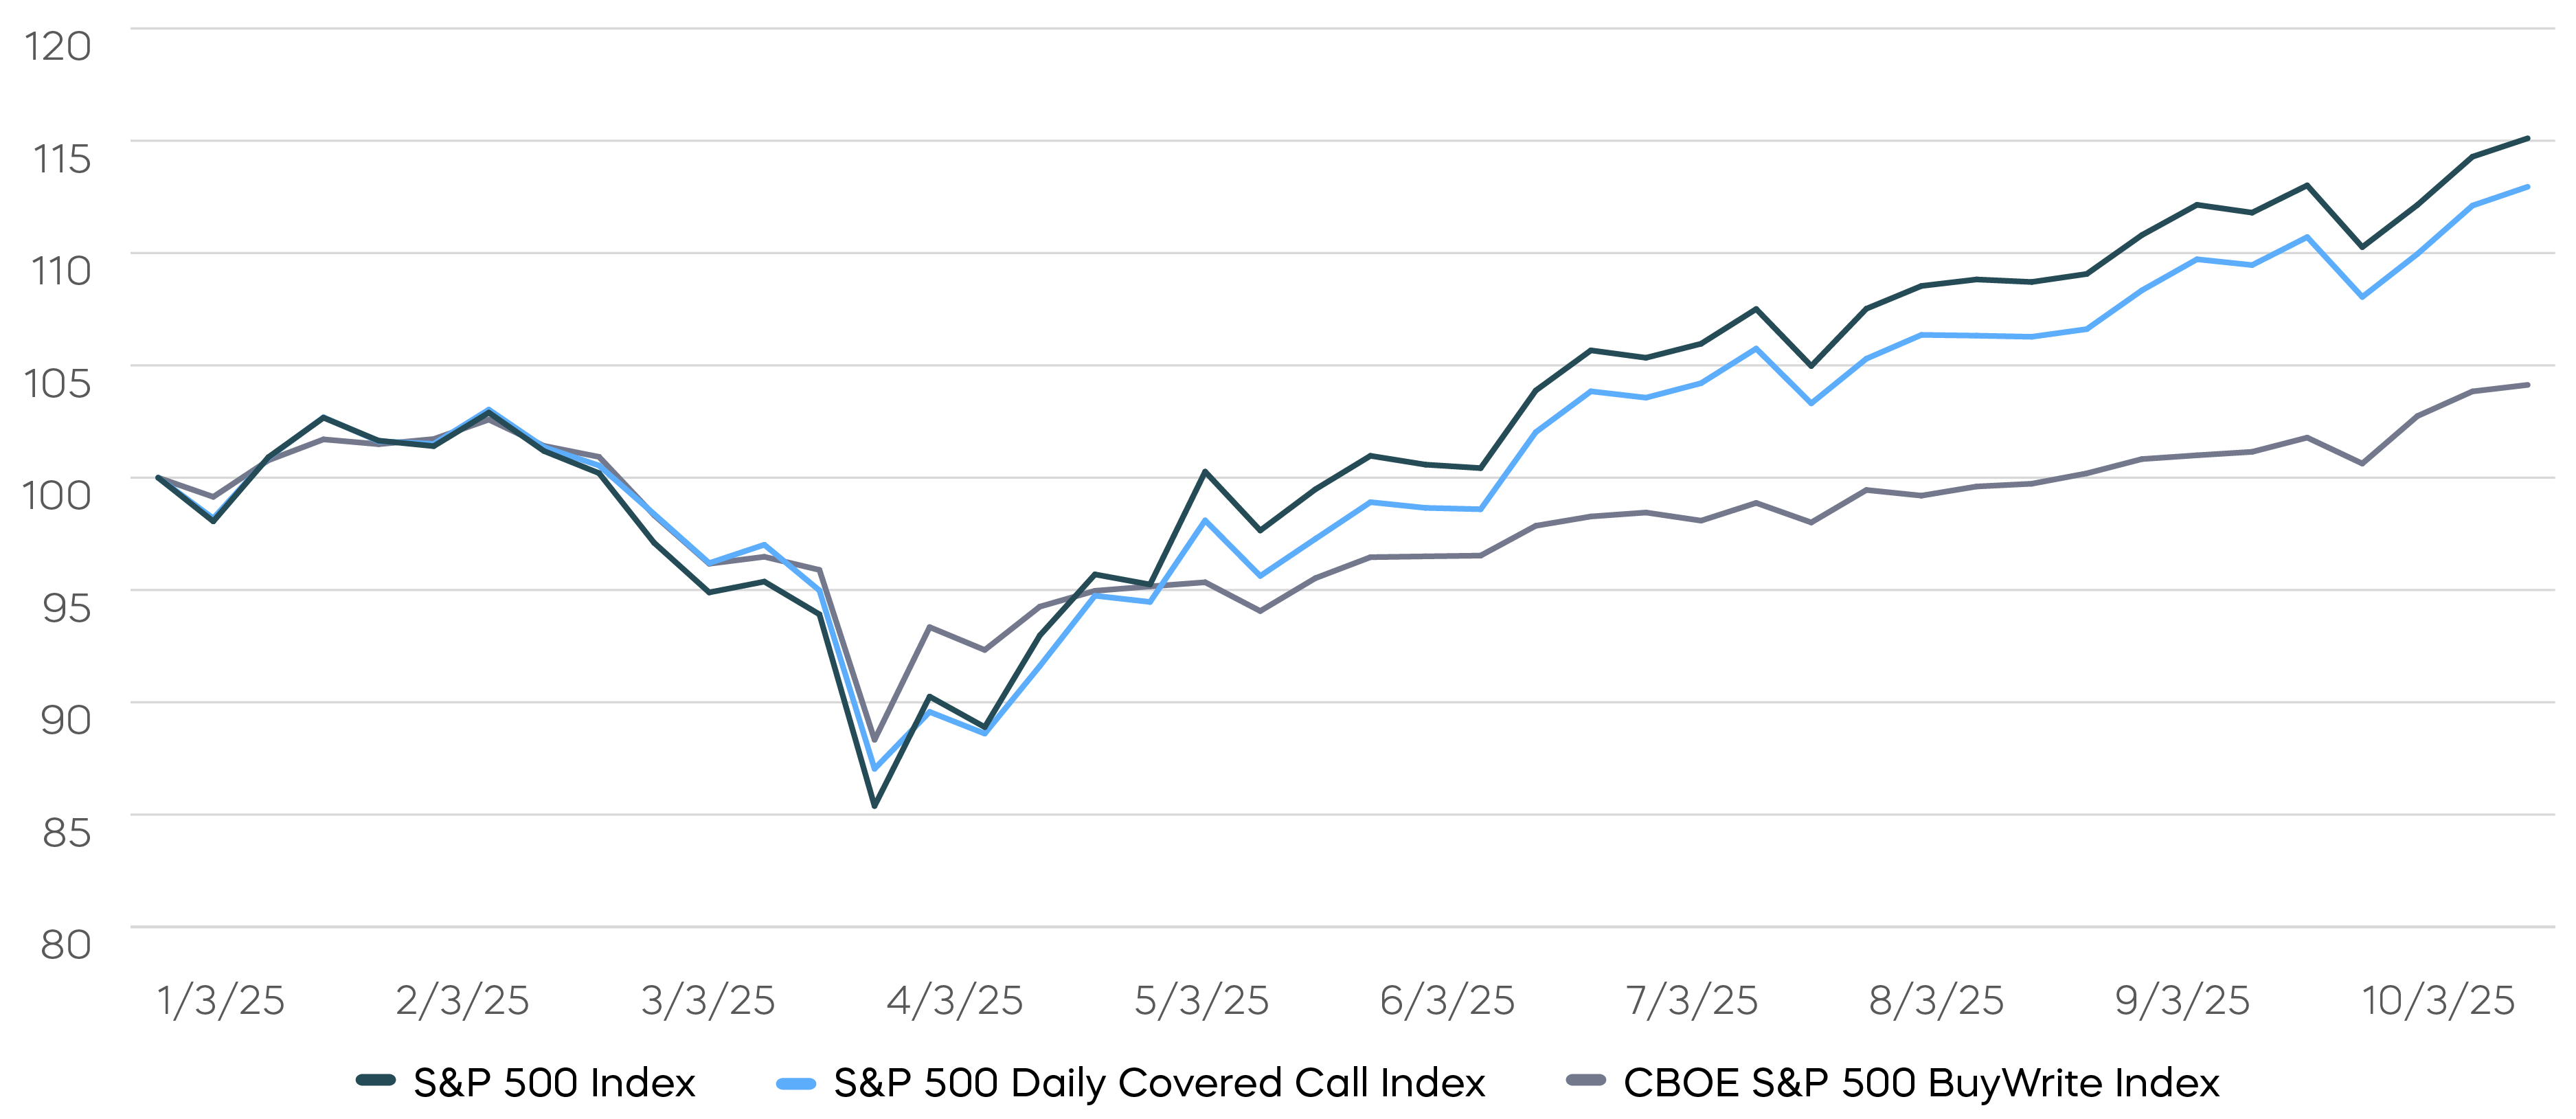
Source: Bloomberg, data as of10/31/25. Index returns are for illustrative purposes only and do not reflect any management fees, transaction costs or expenses. Indexes are unmanaged, and one cannot invest directly in an index. Past performance does not guarantee future results.
Two lessons can be learned:
- First, covered call strategies don’t generally protect your portfolio when markets falter. A potentially better solution may be a bond strategy. Through April 8, while the BXM Index was down 12.6%, the Bloomberg Barclays Aggregate Bond Index was up 1.9%.
- Second, covered call investors don’t necessarily need to sacrifice such a large percentage of total returns when equity markets rally. The S&P 500 Daily Covered Call Index provides investors with a strategy designed to generate high levels of income without sacrificing returns. As the chart demonstrates, since April’s low, the daily index has captured more of the returns of the S&P 500 and outperformed the BXM Index by 8.9%.
Fixed Income Perspectives
Ending Quantitative Tightening Does Not Equal Quantitative Easing
In the weeks before the October FOMC meeting, market participants increasingly anticipated the end of the Federal Reserve’s balance sheet runoff known as quantitative tightening (QT). When the Fed announced that QT would conclude on December 1, however, the 10-year Treasury yield rose that day by 10 bps.[2] The end of QT was not, it turned out, a meaningful policy easing event.
Under the Fed’s ample reserves framework, banks earn interest on reserves held at the Fed, which serves as the key tool for steering short-term interest rates. QT reduces the size of those reserves, and the mechanism can cease to function effectively if those reserves become scarce.
The Fed’s decision to end QT, therefore, was a technical adjustment to preserve rate-control effectiveness, not a deliberate shift toward monetary accommodation.
While the precise level of reserves required by the banking system is uncertain, signs of reduced liquidity emerged in the weeks before the meeting. Notably, the SOFR-IORB spread—the difference between the Secured Overnight Financing Rate (SOFR) and the Interest on Reserve Balances (IORB) rate set by the Federal Reserve—turned positive, as shown in the chart below. That is indicative of overnight funding rates beginning to trade above the Fed’s administered rate, which is a classic signal of reserve scarcity.
SOFR–IORB Divergence May Reflect Growing Reserve Scarcity
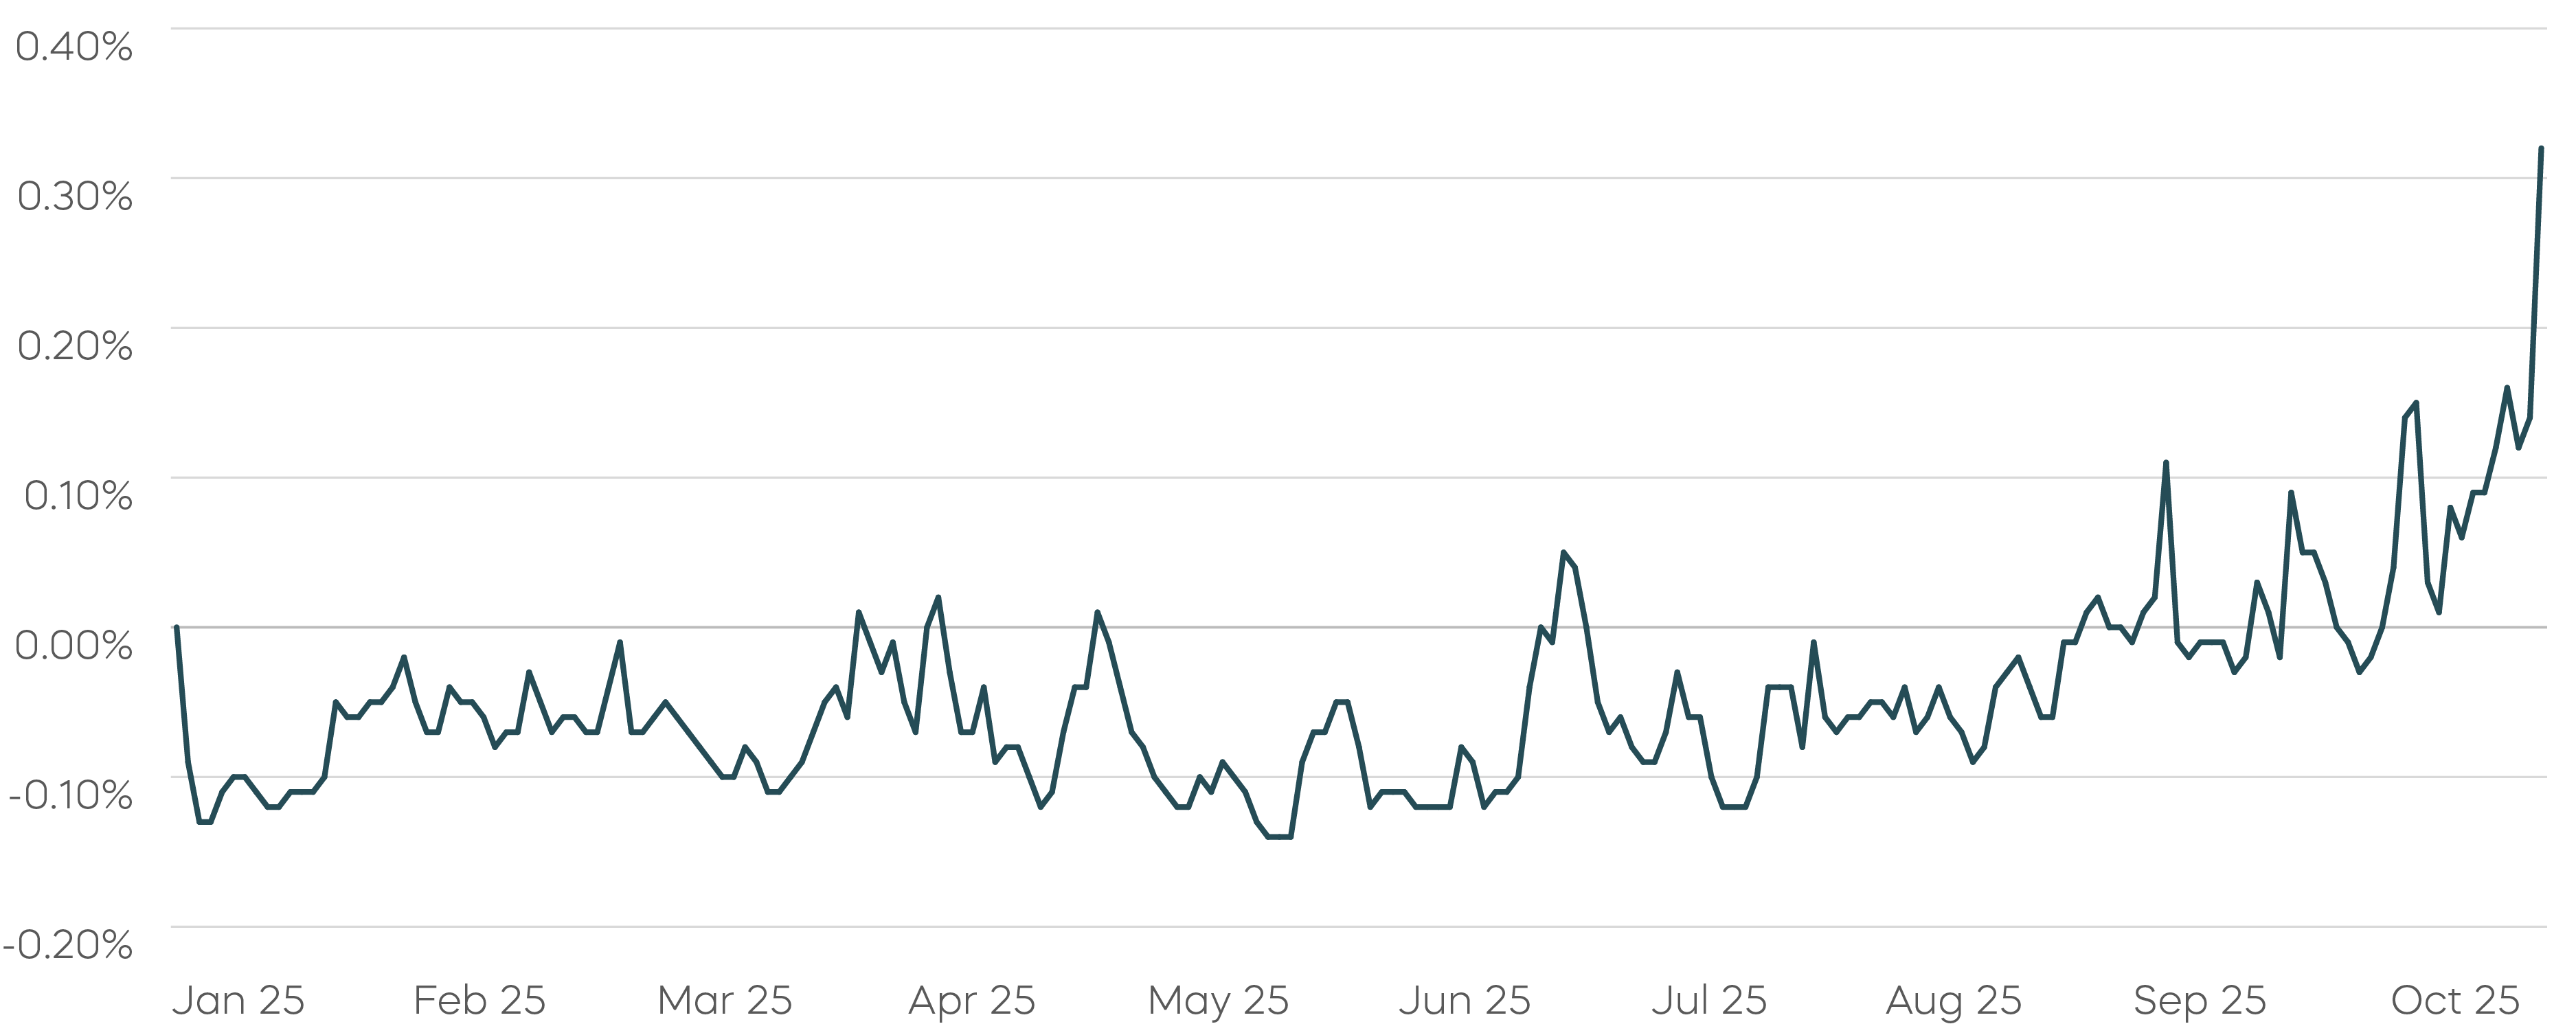
Source: Bloomberg, data as of 10/31/25. Spread shown is the difference between Secured Overnight Financing Rate (SOFR) and Interest on Reserve Balances (IORB).
The implementation details of the balance sheet announcement carried what many interpreted as a slightly hawkish tone. Starting in December, maturing mortgage-backed securities (MBS) will be reinvested into Treasury bills, freezing the size of the balance sheet but shifting its composition toward shorter-dated assets. The Fed emphasized its goal of realigning its portfolio duration with the structure of outstanding Treasury debt.
Over recent years, the weighted-average maturity of the Fed’s Treasury holdings has lengthened from just over seven years at the end of 2020 to around nine years today. That compares with roughly six years for marketable Treasury securities.
By signaling a preference to shorten that maturity profile, the Fed could be seen as effectively committing to (very) gradually replacing notes and bonds acquired during QE with cash-like Treasury bills. This approach also suggests that future declines in reserves could be offset by bill purchases, a market-neutral operation that should not be interpreted as policy easing.
Rising Weighted Average Maturity of Treasury Securities Held by the Fed (in years)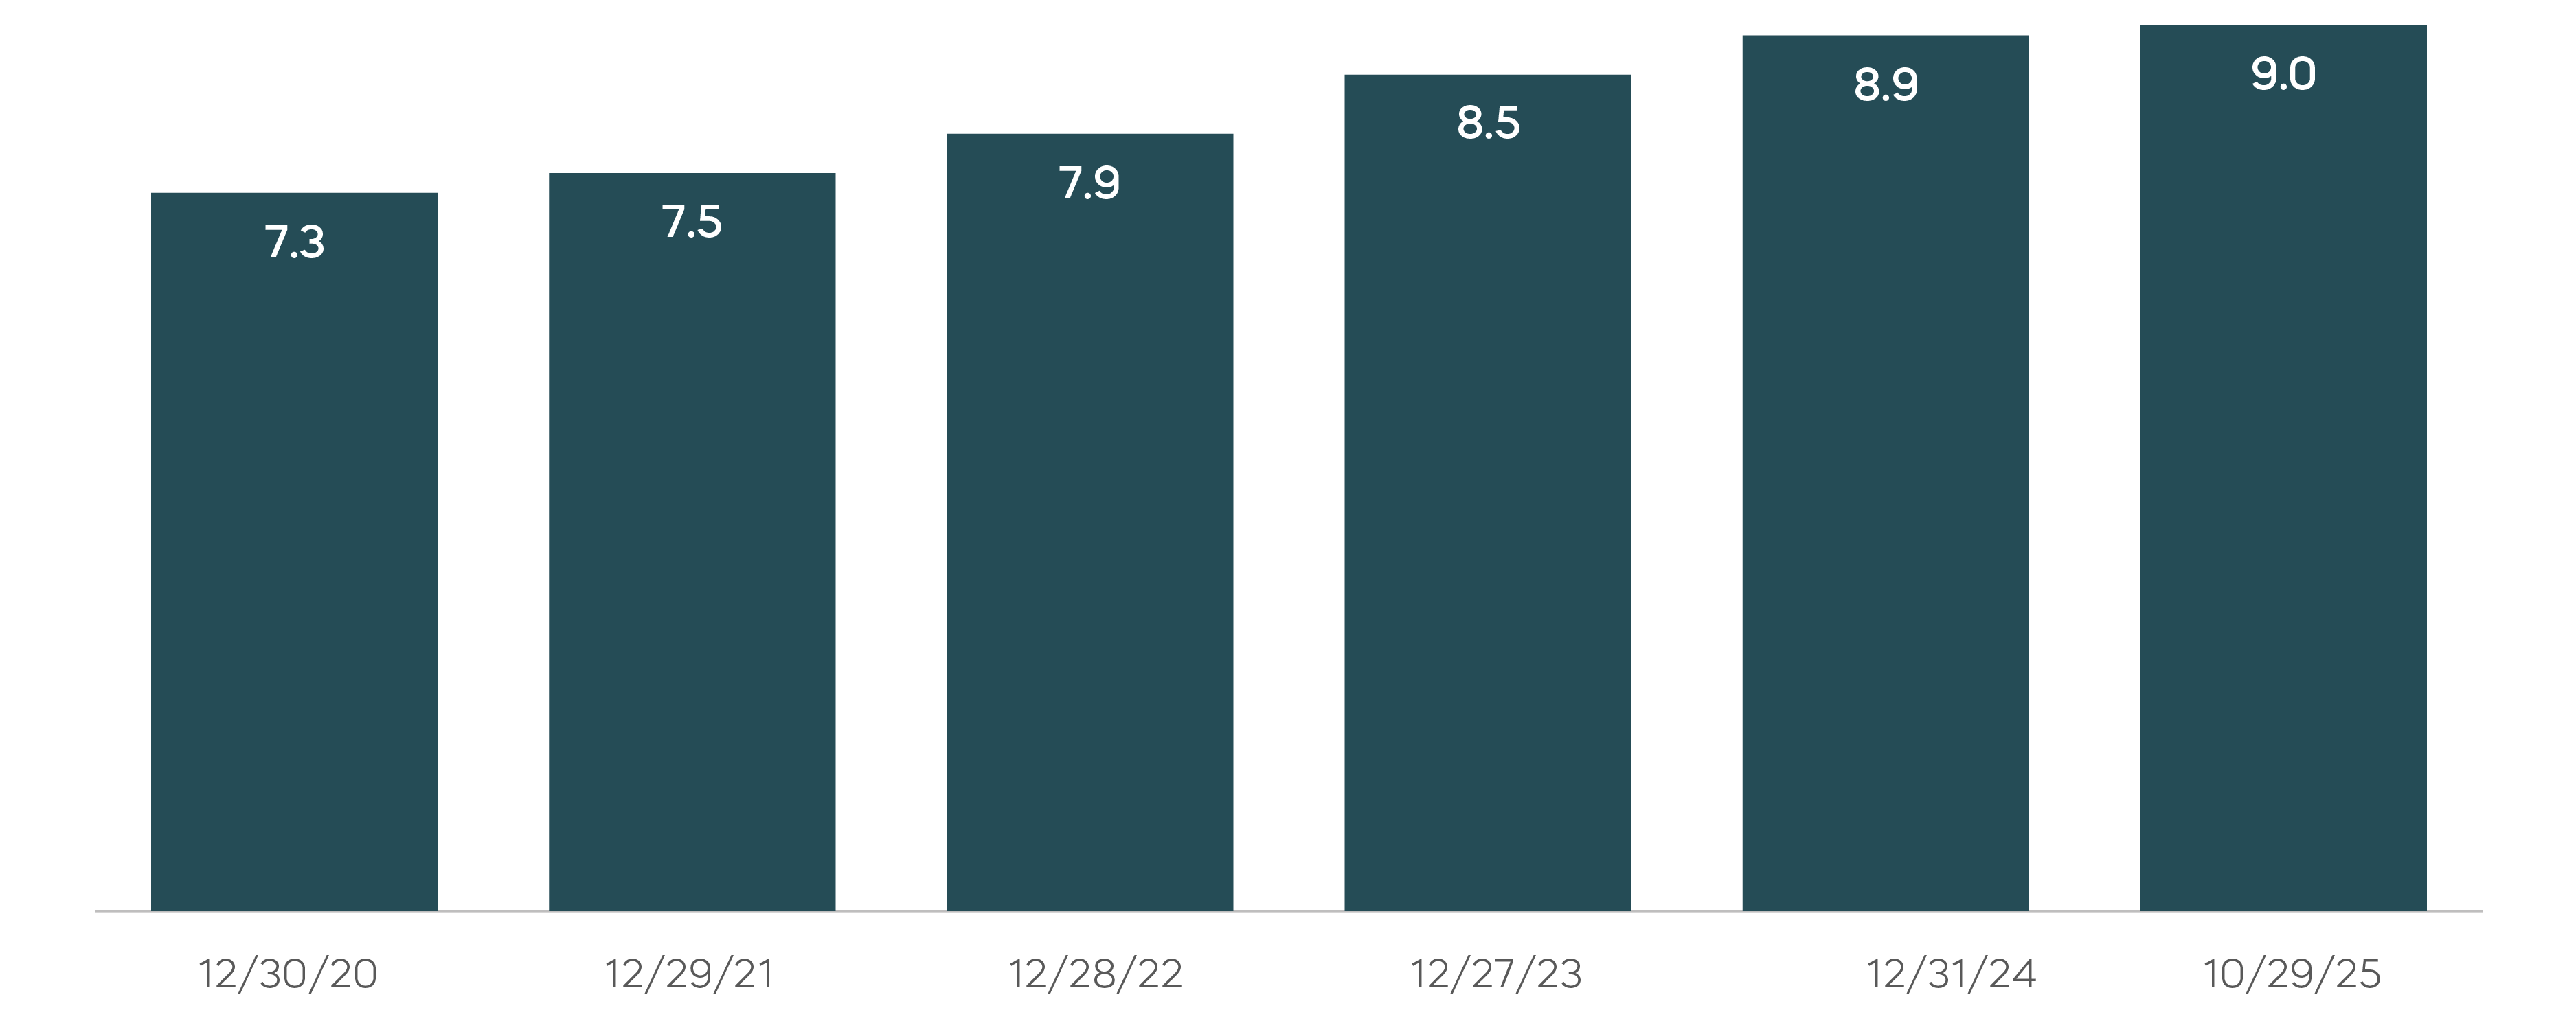 Source: Federal Reserve Bank of New York, System Open Market Account Holdings of Domestic Securities.
Part of the market’s reaction may also have stemmed from Chair Powell’s remarks downplaying the likelihood of another rate cut in December. In our view, underlying economic conditions still seem to justify a shift toward a more neutral policy stance; Powell’s tone likely reflected caution rather than concern about the growth outlook. The knee-jerk rise in 10-year Treasury yields underscores how dovish expectations had already been priced in, especially ahead of next year’s change in Fed leadership.
Bond returns across the fixed-income spectrum have been strong so far this year, buoyed by declining long-term yields in the second half. While we still expect additional rate cuts ahead, we are less convinced that long-term yields will follow those moves lower.
Moreover, we see potential signs of complacency in the market’s pricing of interest-rate volatility. Since the April spike, swaption-implied volatility across 2-, 10- and 30-year maturities has declined sharply, suggesting investors may perceive limited risk in holding duration, even as uncertainly about inflation persists. Historically, however, long-term bondholders have demanded greater compensation when inflation surprises to the upside. So, if inflation proves stickier amid fiscal stimulus and resilient growth, long-term yield could experience a larger rebound.
Broad Decline in SOFR Swaption Volatility (At-the-money, 3-Month)
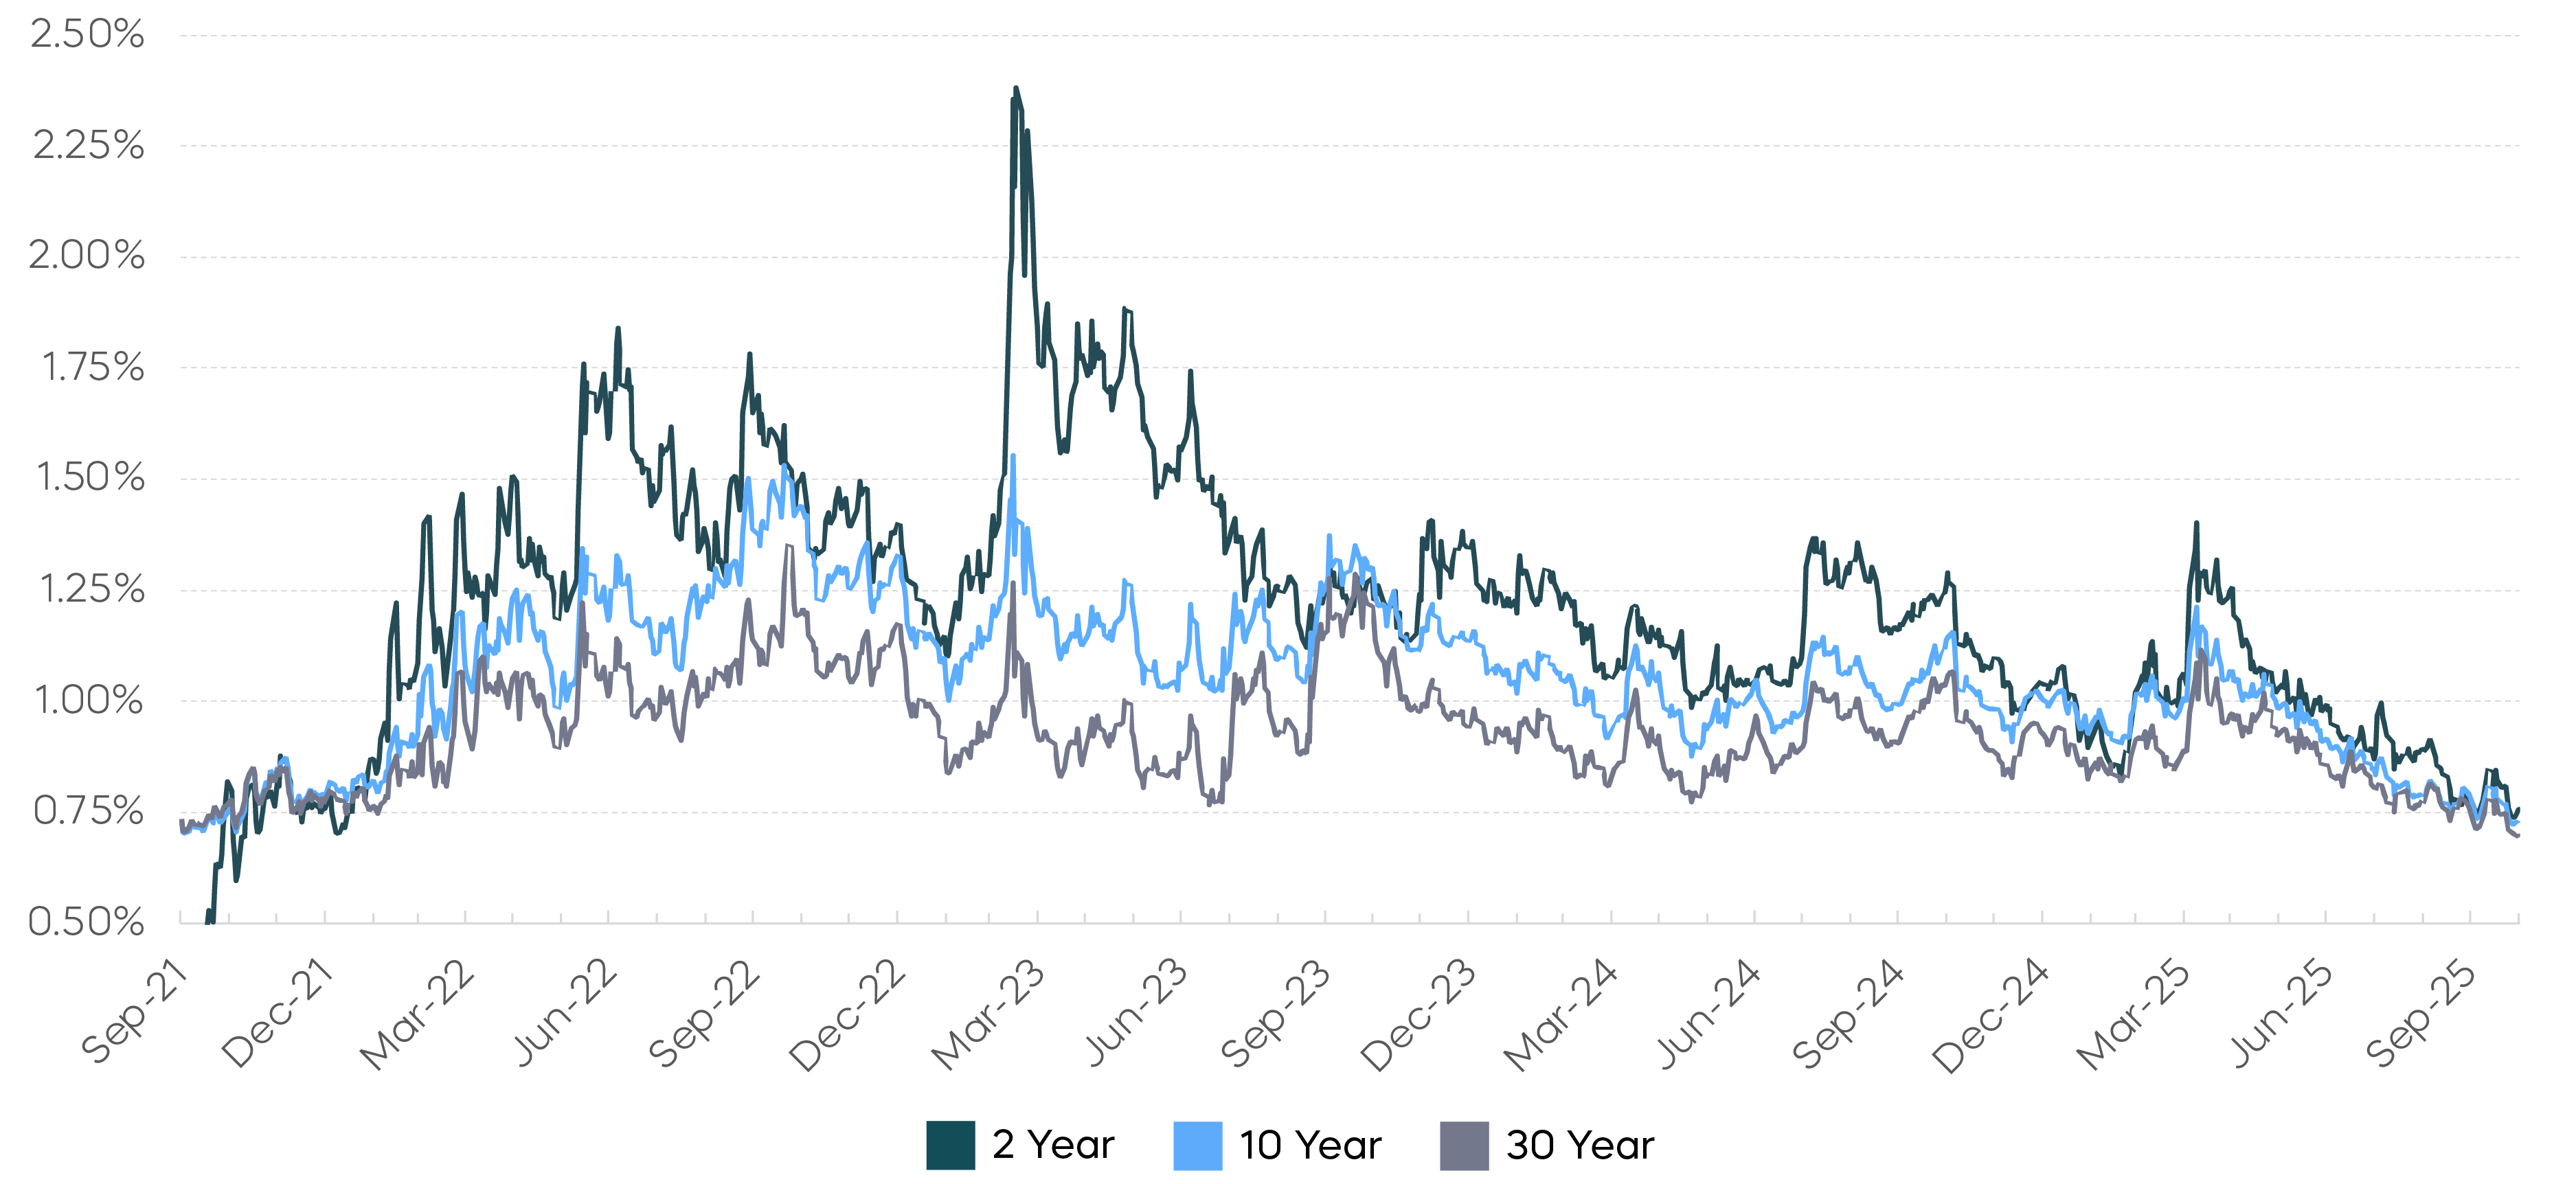 Source: Bloomberg, ICAP. Data as of 10/31/25.
Fixed Income Returns—October 2025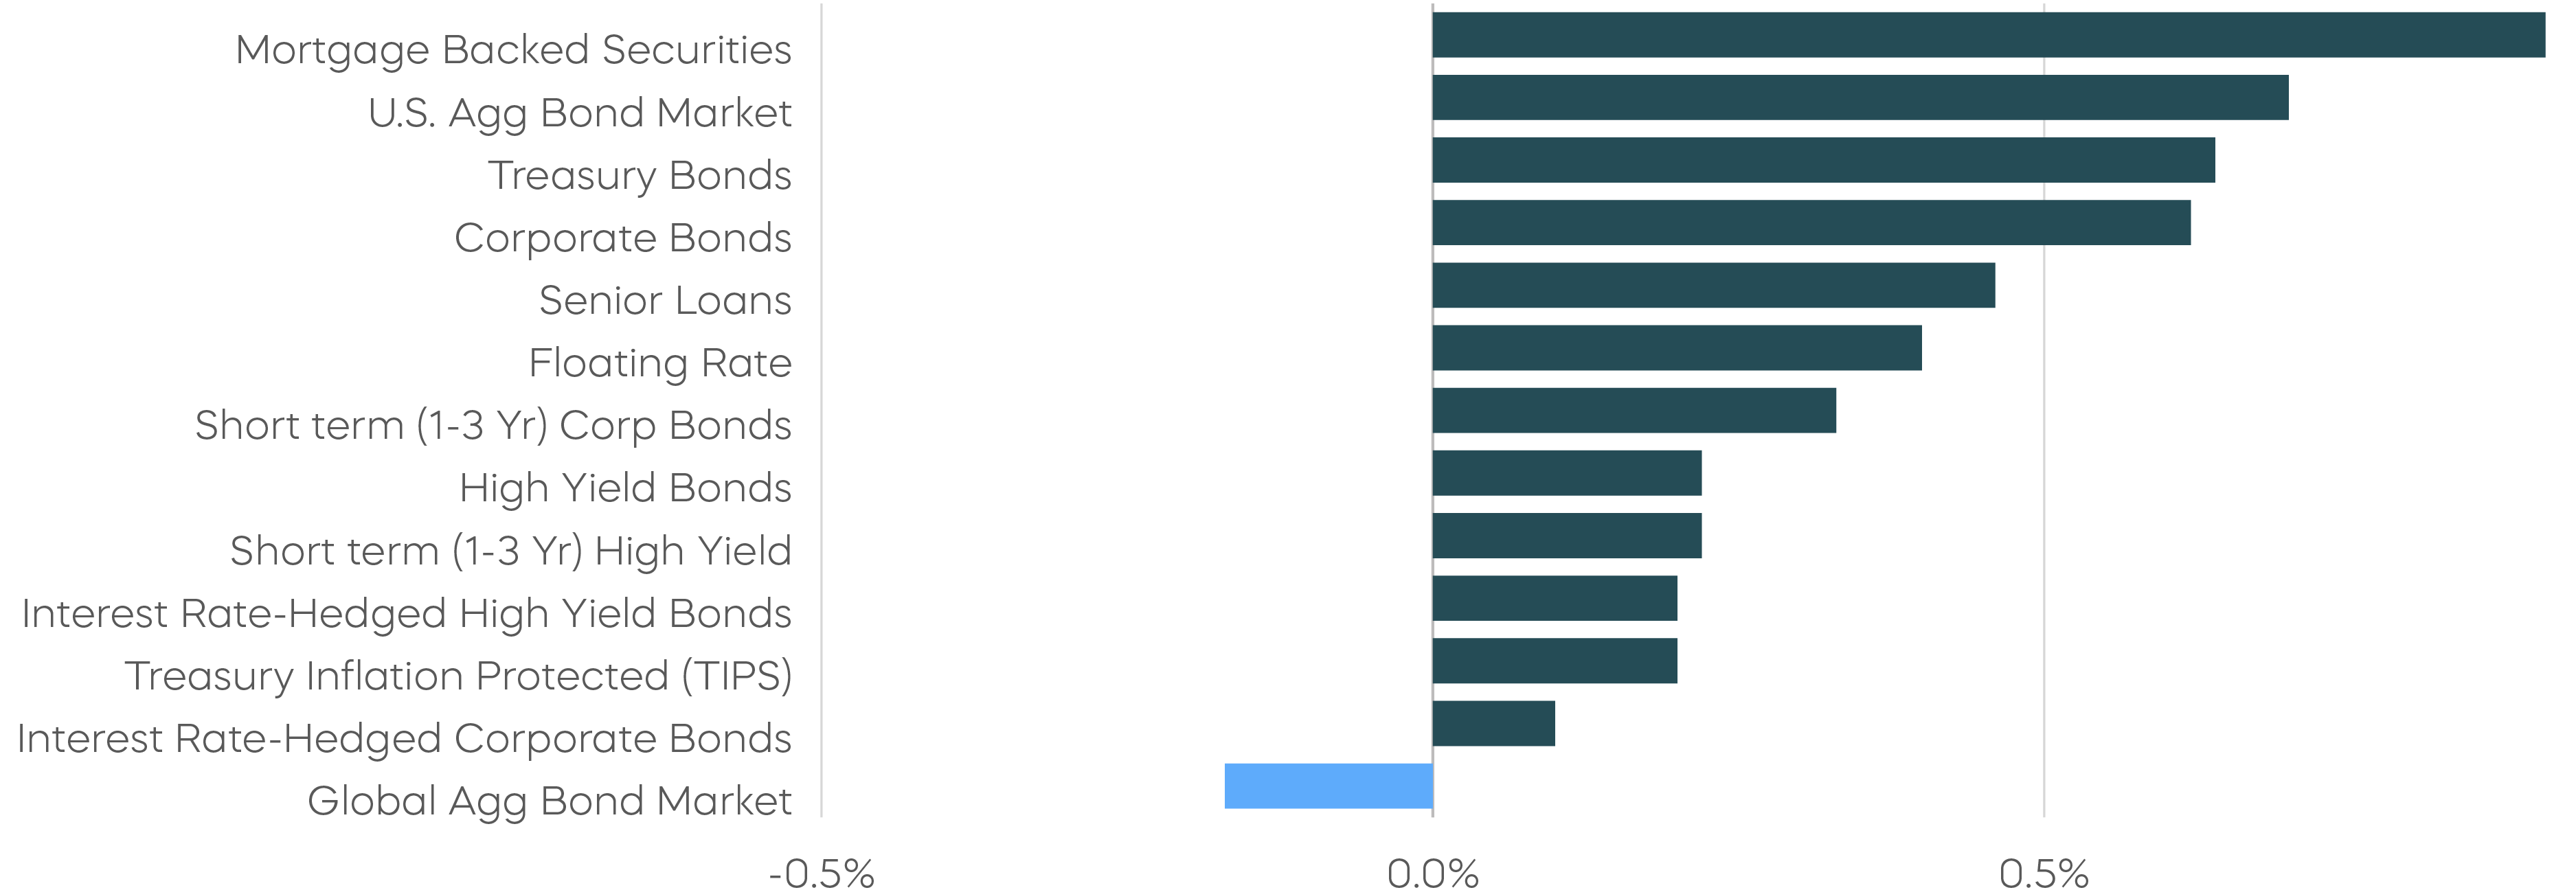
Source: Bloomberg. October returns 10/1/25–10/31/25. Index returns are for illustrative purposes only and do not reflect any management fees, transaction costs or expenses. Indexes are unmanaged, and one cannot invest directly in an index. Past performance does not guarantee future results.
[1] Source: FactSet, data from 4/8/25 to 10/31/25.
[2] Source: Bloomberg, data as of 10/29/25.