Key Observations

For the second time in less than a year, the United States is engaged in military conflict in the Middle East. And once again, investors must assess how escalating tensions could affect markets.
In our recently published Quick Take commentary, we noted that stocks, while initially battered by conflict-led uncertainty, recovered relatively quickly not just after June’s brief conflict, but also during the later days of the two previous protracted Gulf Wars.
Presently, while we cannot dismiss the risks posed by current tensions, investors should take note of the recent broadening of equity market participation. A rotation from the highfliers of mega-cap tech into the type of equities that show resilience during periods of market stress may offer durability in both the short and long term.
Still, choosing traditionally defensive sectors may not be the most advisable path forward. Defense and energy sector stocks have been showing strength for obvious reasons. But energy prices can be volatile and retreat quickly. And demand for military equipment can be impacted, sometimes just as quickly, not just by geopolitics, but also by domestic politics.
Investing based on boosted fundamentals in these instances may prove little different than chasing the fleeting benefits of short-term sentiment. In contrast, a recent uptick in performance combined with an uptick in fundamentals among dividend growth stocks—specifically the S&P 500 Dividend Aristocrats—may offer a more lasting combination of resilience and durability.
Chart of the Month
S&P 500 Dividend Aristocrats Earnings Have Gained Ground
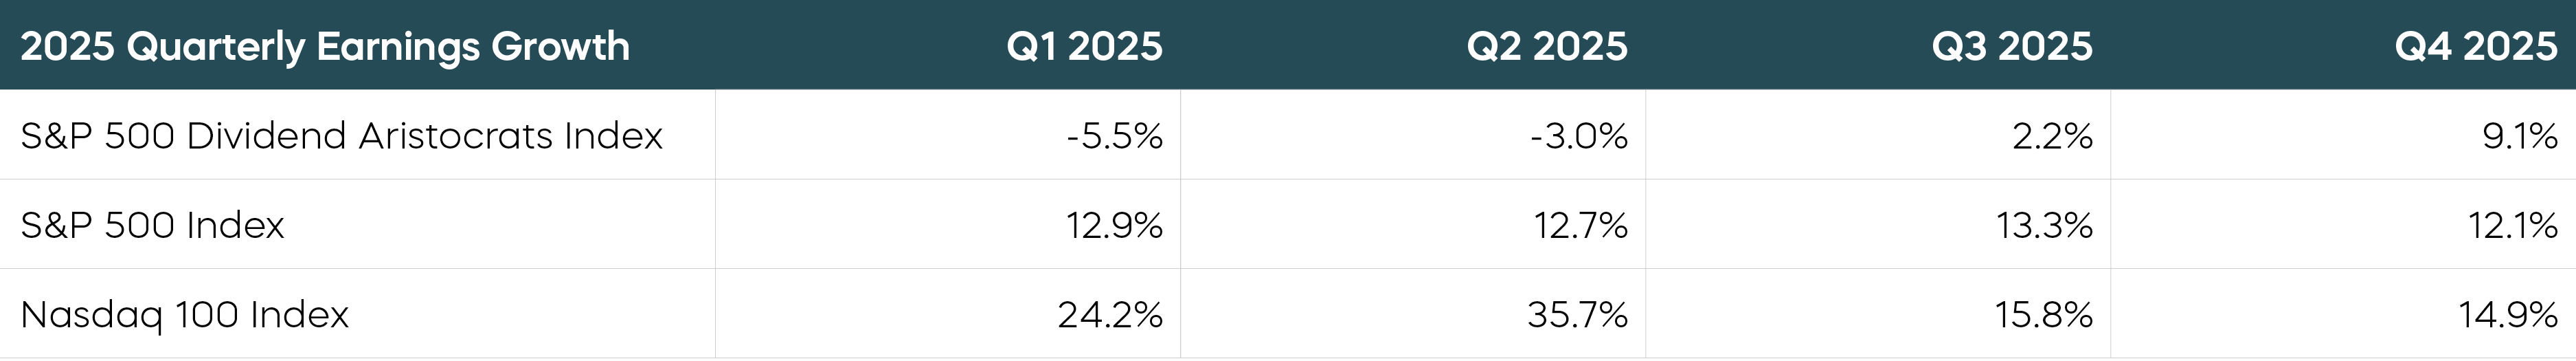
The first half of 2025 saw tremendous earnings growth from the Nasdaq-100, while the S&P 500 Dividend Aristocrats shrank. But by the end of 2025, the S&P 500 Dividend Aristocrats nearly closed the gap. Those strong earnings have supported recent outperformance from the Aristocrats, which have returned over 10% year-to-date through February, according to Bloomberg, compared to the relatively flat performance of the S&P 500. It’s not just earnings growth either. The equally weighted S&P 500 Dividend Aristocrats Index has also seen, for example, greater return on assets than the S&P 500 Index. Characteristics like this may position the Aristocrats well for both near-term volatility and durable performance.
One more point to consider: While earnings growth power has shifted from high-flying Nasdaq-100 companies to typically higher-quality ones like the Aristocrats, S&P 500 earnings growth has remained steady. That broadening of fundamentals suggests that, while there’s a good chance of outperformance from quality stocks like the Aristocrats, it may also come with a “soft landing” for the mega-caps that ran the table the last several years. In addition to the historical short-lived market impacts of geopolitical conflict, a soft landing for tech could be another reason for investors to consider a return to well-considered risks.
Asset Class Perspectives
Asset Class Returns—February 2026
Asset Class Returns—Year-to-Date 2026
The following are observations on a range of asset classes. For each, green indicates a constructive backdrop, yellow indicates a neutral environment, and red would indicate a challenging backdrop.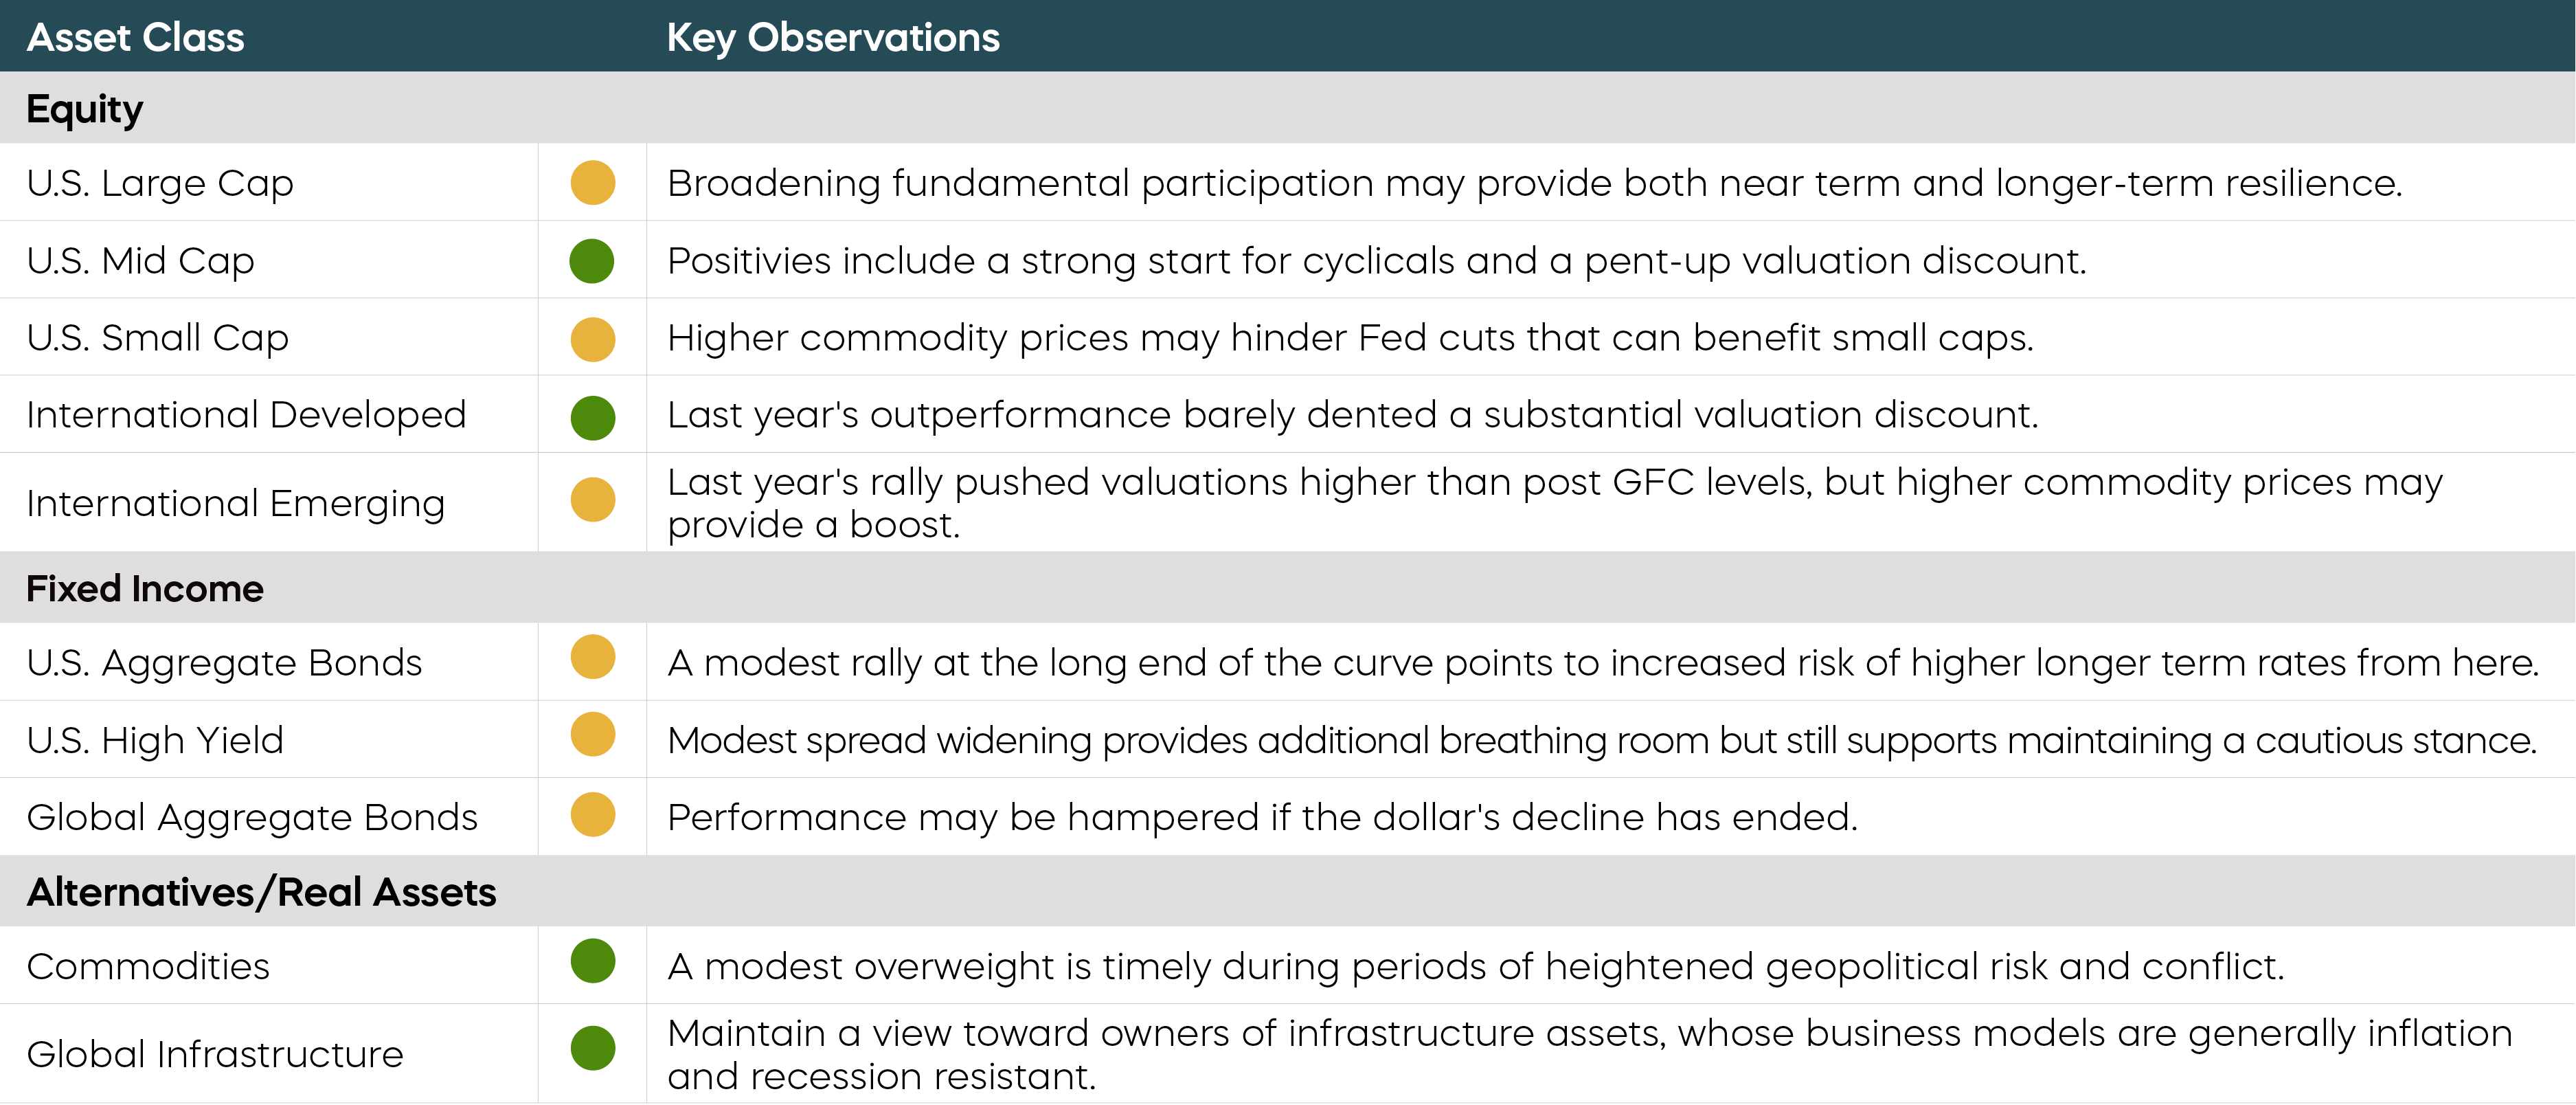
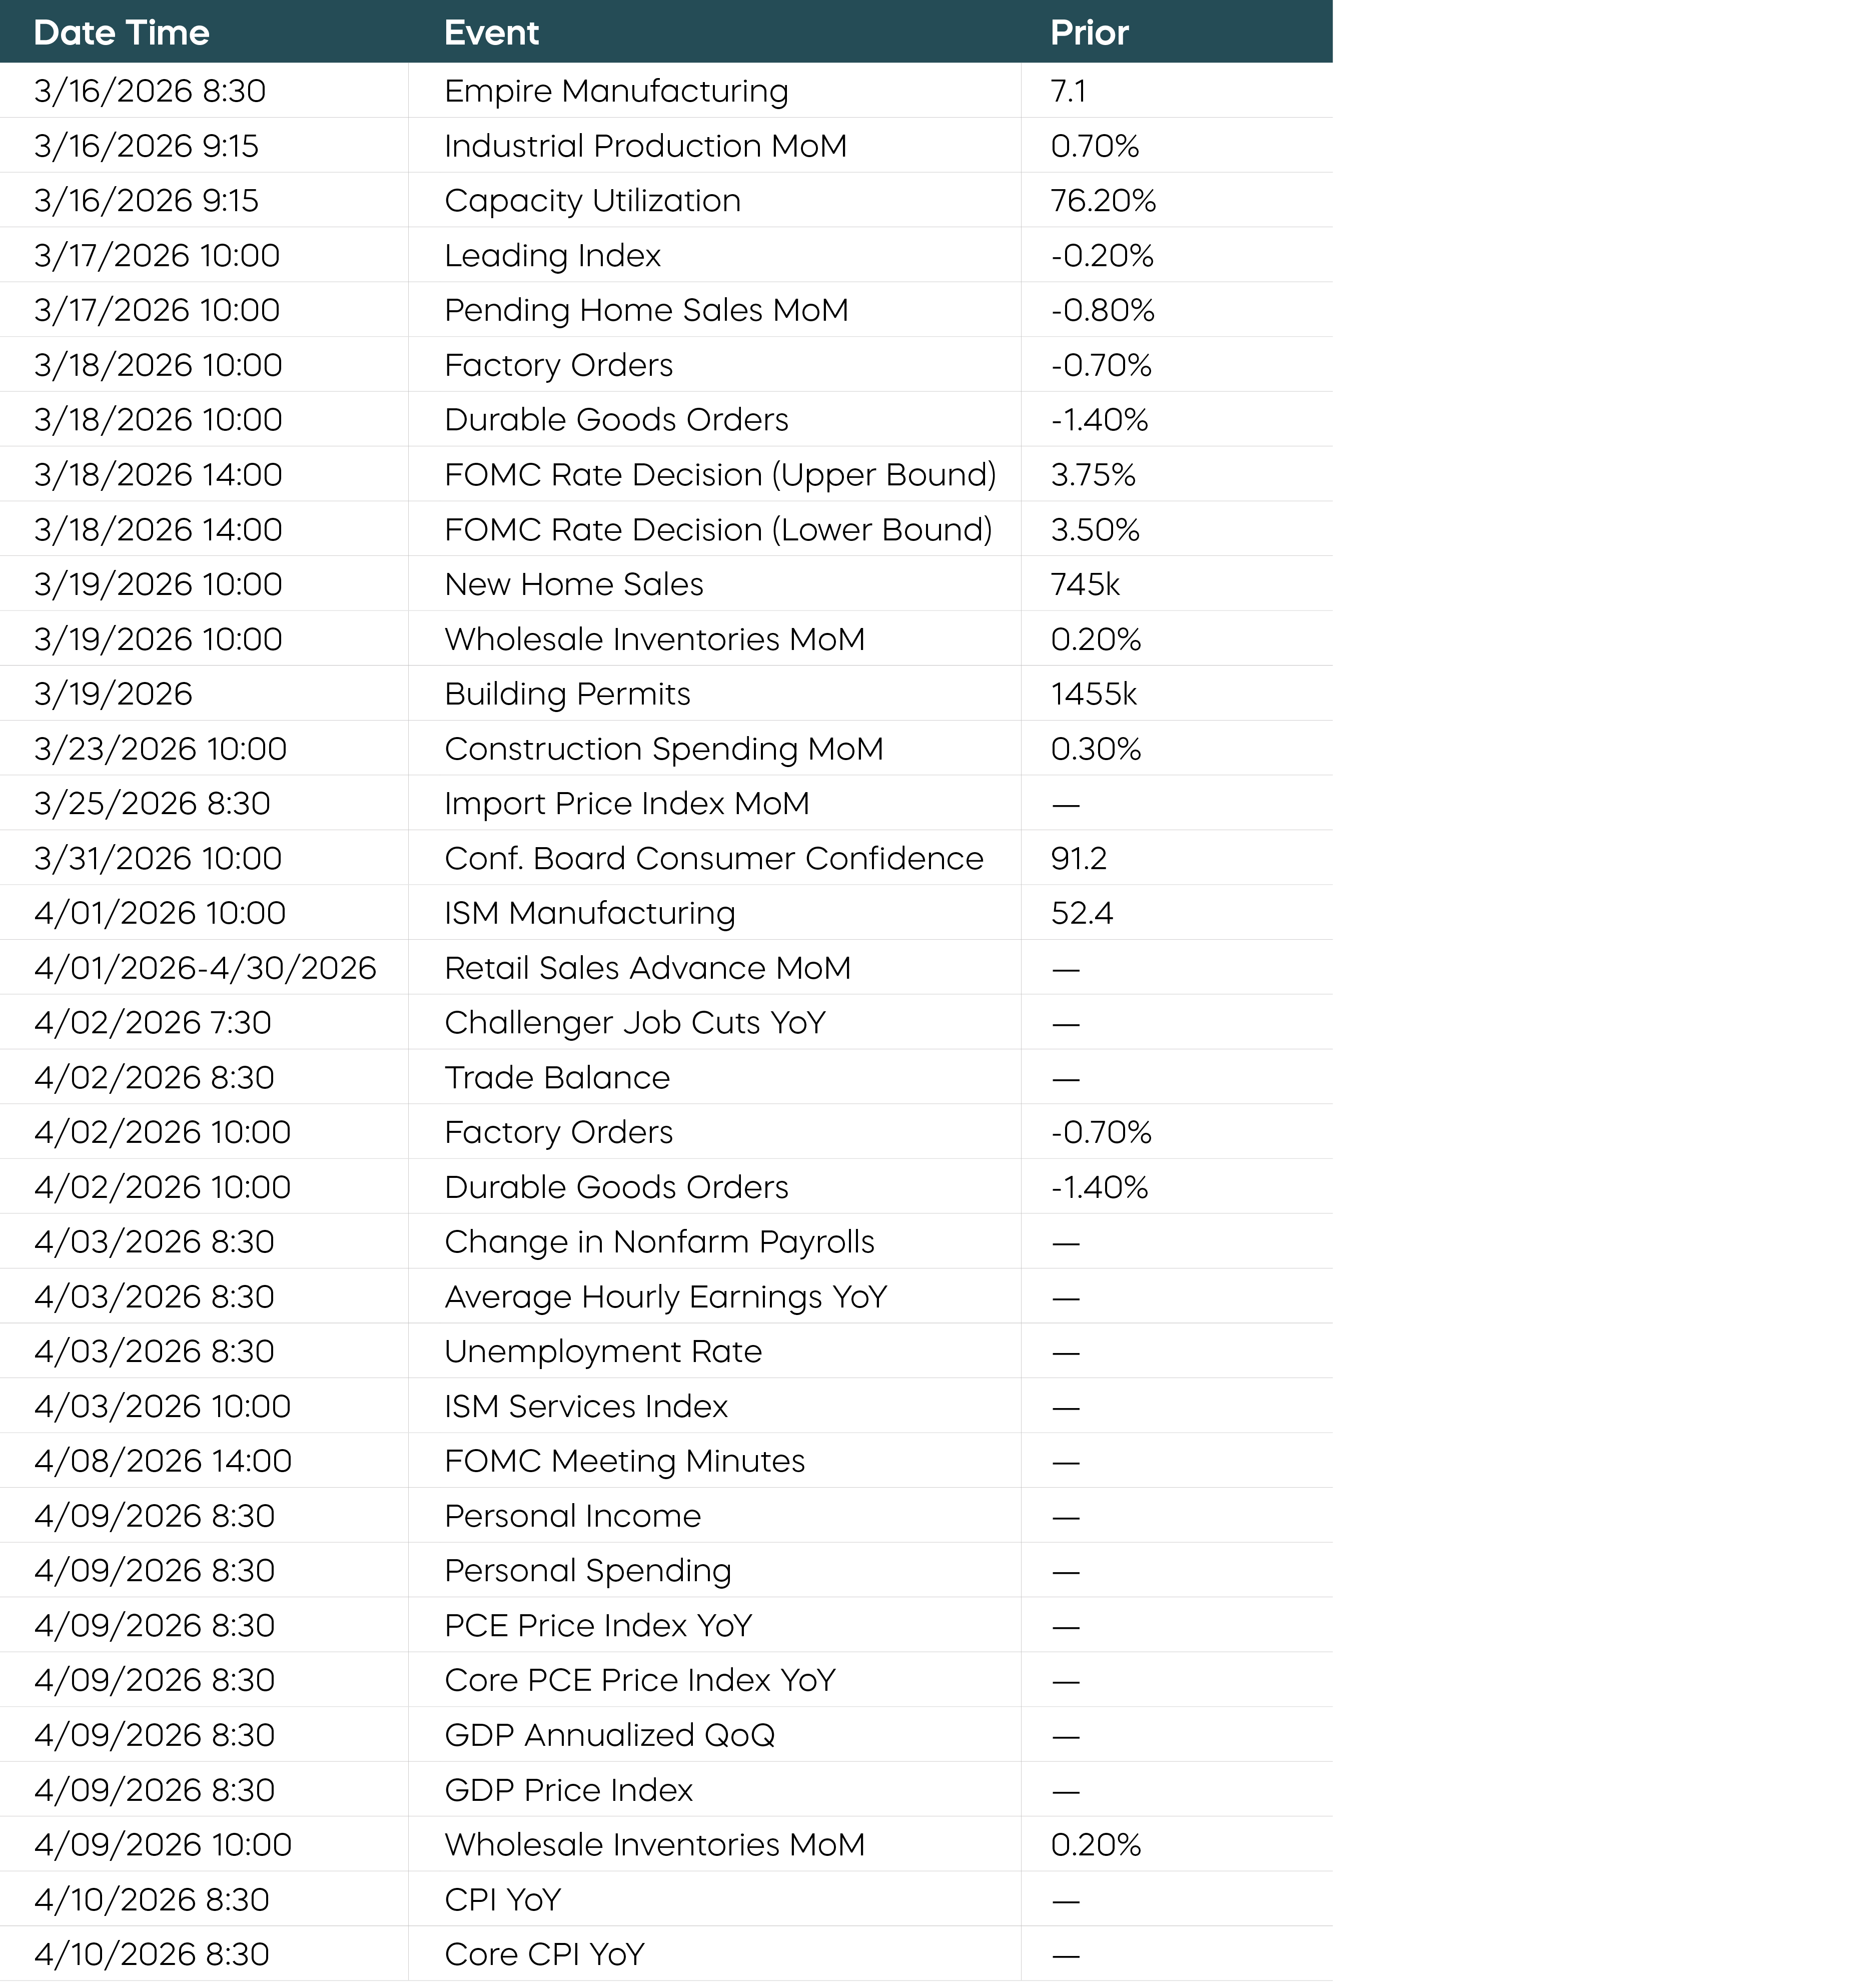
Economic Calendar
Equity Perspectives

Looking Below the Surface
The S&P 500 declined 0.8% in February, bringing year-to-date returns to 0.7%, according to Bloomberg data. At first glance, muted returns imply a tranquil market. Of course, reality has been very different. Recent military action in Iran exacerbate a long list of potential risks to the bull market we’ve enjoyed since 2022. Looking below the surface, there are significant shifts happening at the sector and stock level that could have important implications for investors.
To start, implied volatility has risen. The CBOE Volatility Index, the VIX, has moved meaningfully higher since the start of the year and recently crossed both its 50-day and its 200-day moving averages.
Perhaps more notable: the difference in individual stock returns is also moving higher. The technical measure for such behavior is the cross-sectional standard deviation of returns, or more simply, dispersion. According to Standard & Poor’s, dispersion levels for the S&P 500 closed February at 33%, an amount near the 95th percentile of all values dating back to January 2007.
High-dispersion environments tend to provide a greater opportunity for focused stock selection to outperform broader benchmarks. Dispersion levels also tend to be persistent, implying that recent market behavior could remain in place for an extended period.
The Dividend Aristocrats Have Been Outperforming
The S&P 500 Dividend Aristocrats are a quintessential example of a focused stock selection strategy. They represent a distinguished group that has managed to grow their dividends for a minimum of 25 consecutive years. Only 69 companies meet these strict criteria, and they tend to embody quality, with long histories of stable earnings and solid fundamentals.
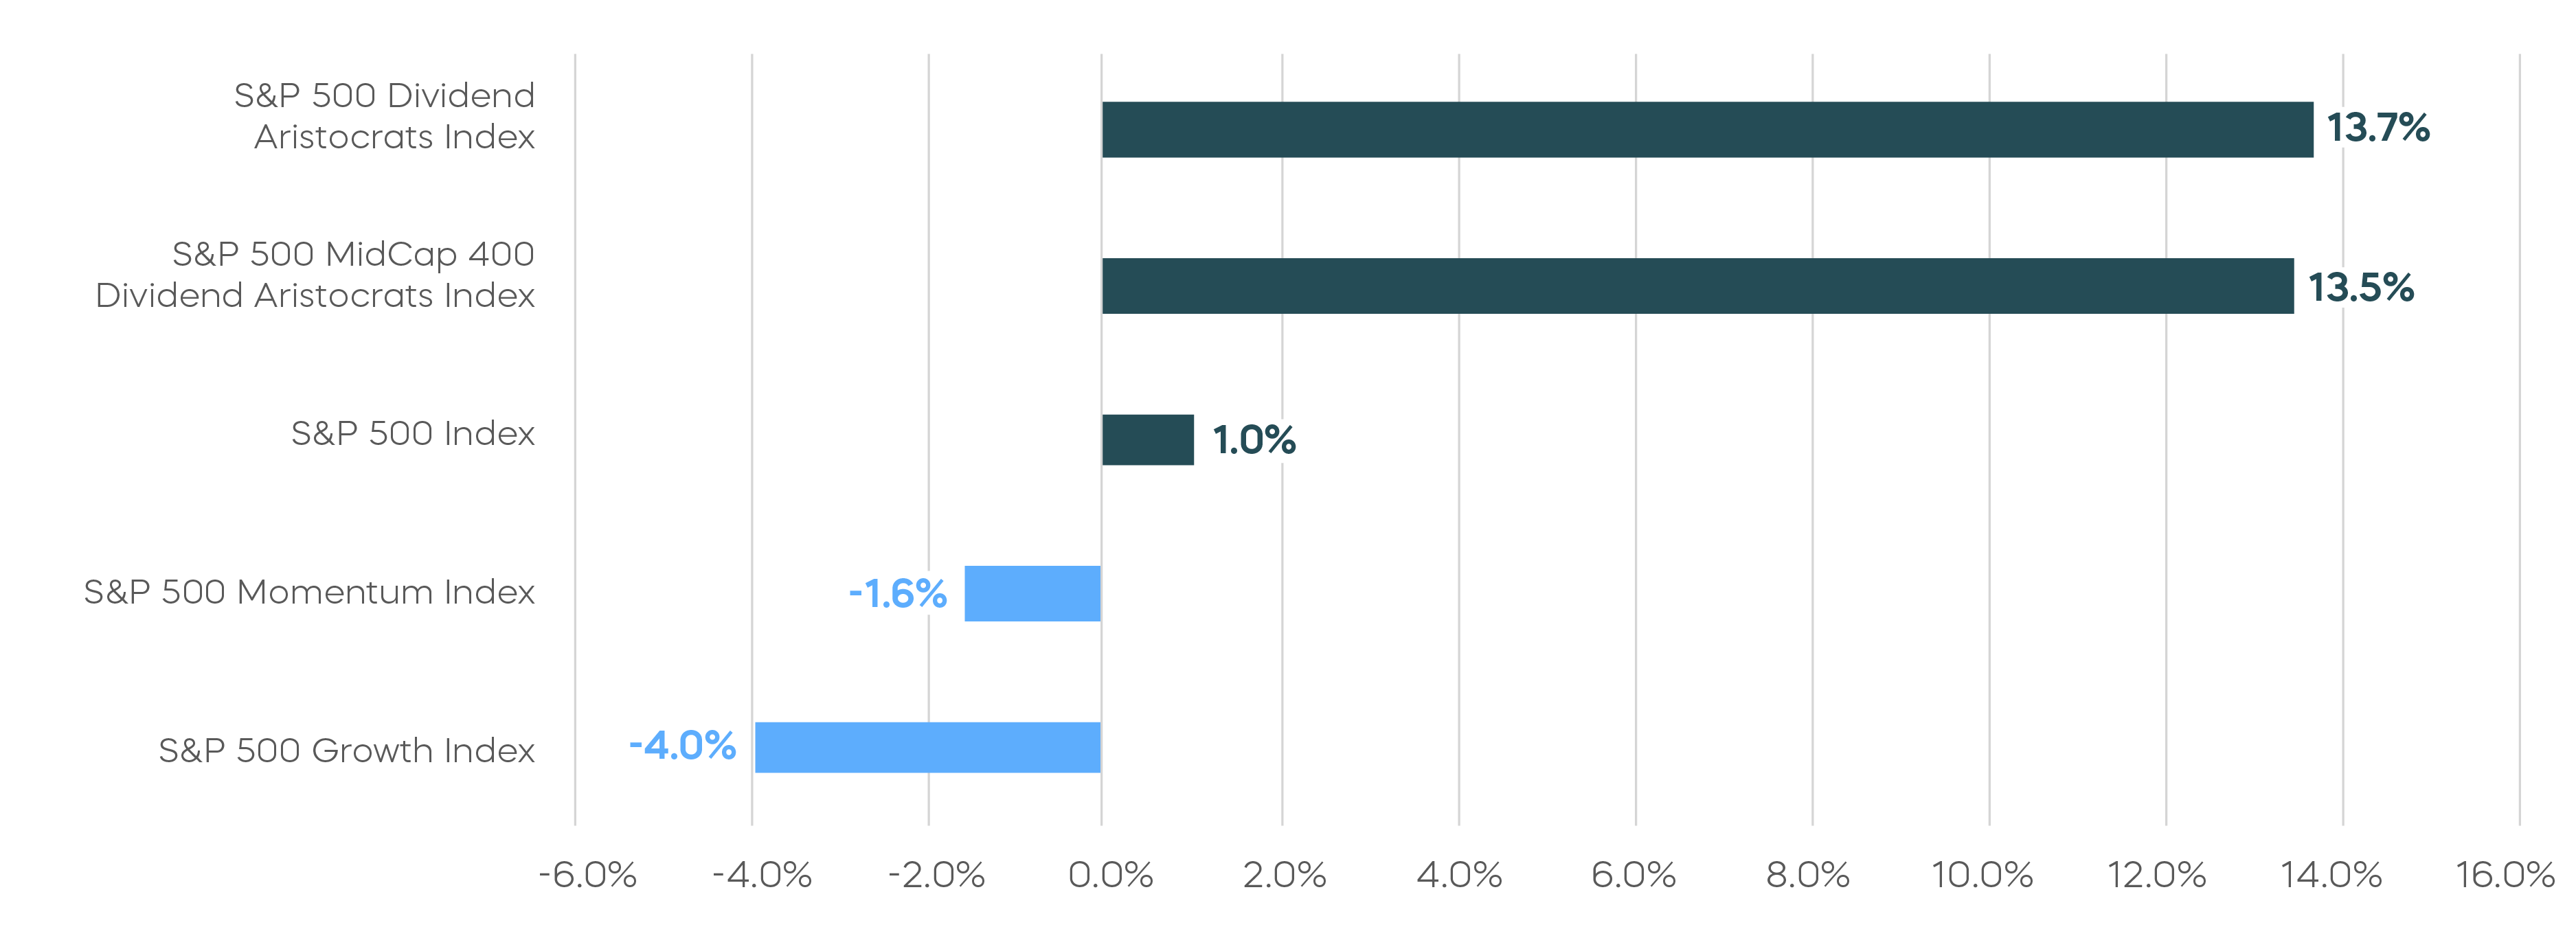
Recent performance trends highlight how the Aristocrats may help investors build a more resilient portfolio. According to Bloomberg, the S&P 500 Dividend Aristocrats delivered February returns of 4.2%. This continued a pattern of outperformance that began in November 2025. Since that time, both large- and mid-cap Dividend Aristocrat strategies have significantly outperformed strategies focused on growth and momentum.
The Dividend Aristocrats Have Outperformed Since November
Fixed Income Perspectives

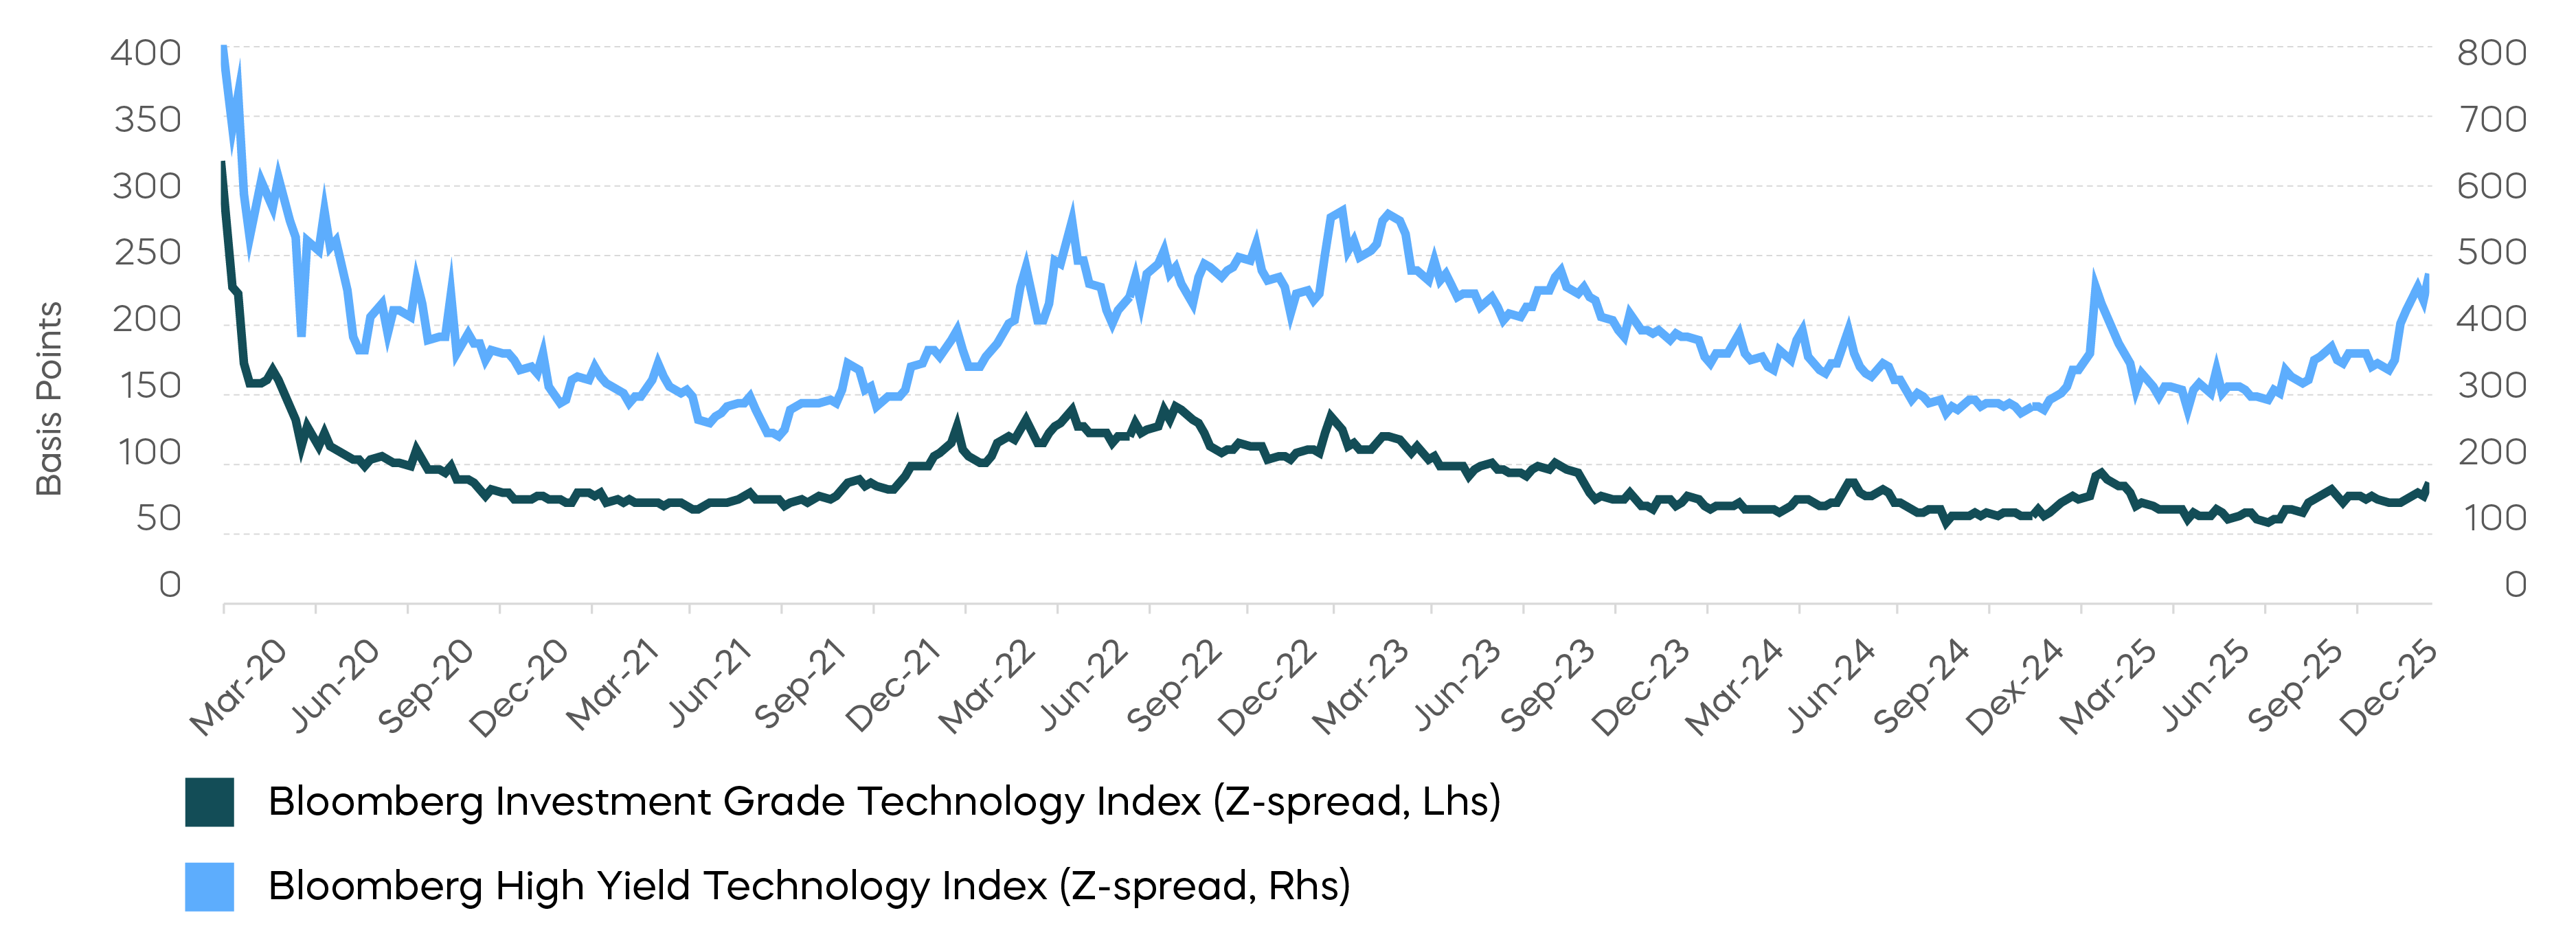
When AI Disrupts Software
Generative AI may one day be regarded as one of the most important technological innovations in history. Today, credit investors are beginning to confront just how disruptive this technological shift might be to existing business models.
In its shareholder letter late last year, Blue Owl, an alternative asset manager, noted a pickup in tender activity across business development companies (BDCs) as publicly traded software-as-a-service (SaaS) equities sold off. That repricing has accelerated in 2026 and is now spilling over into parts of the public credit market.
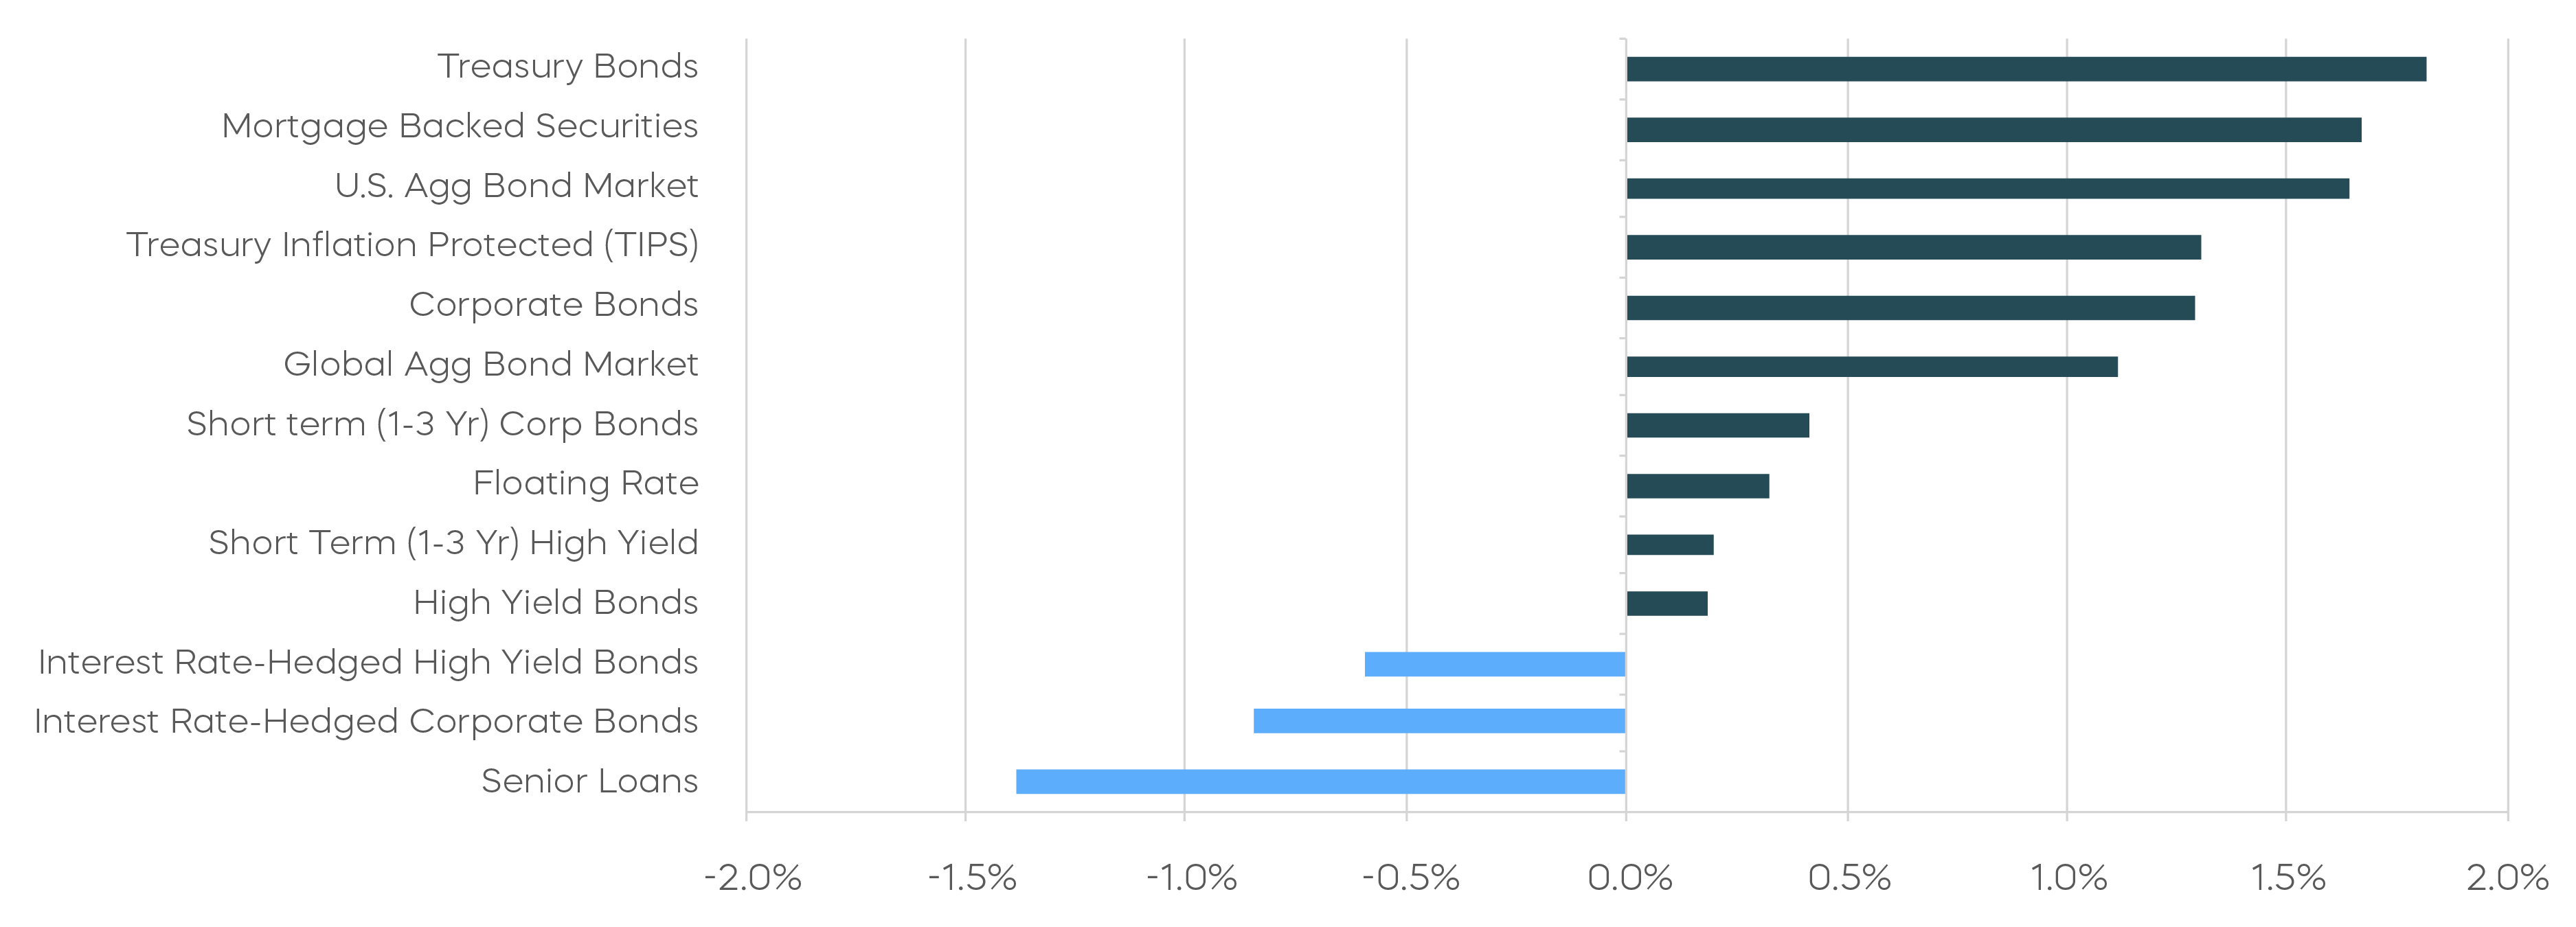
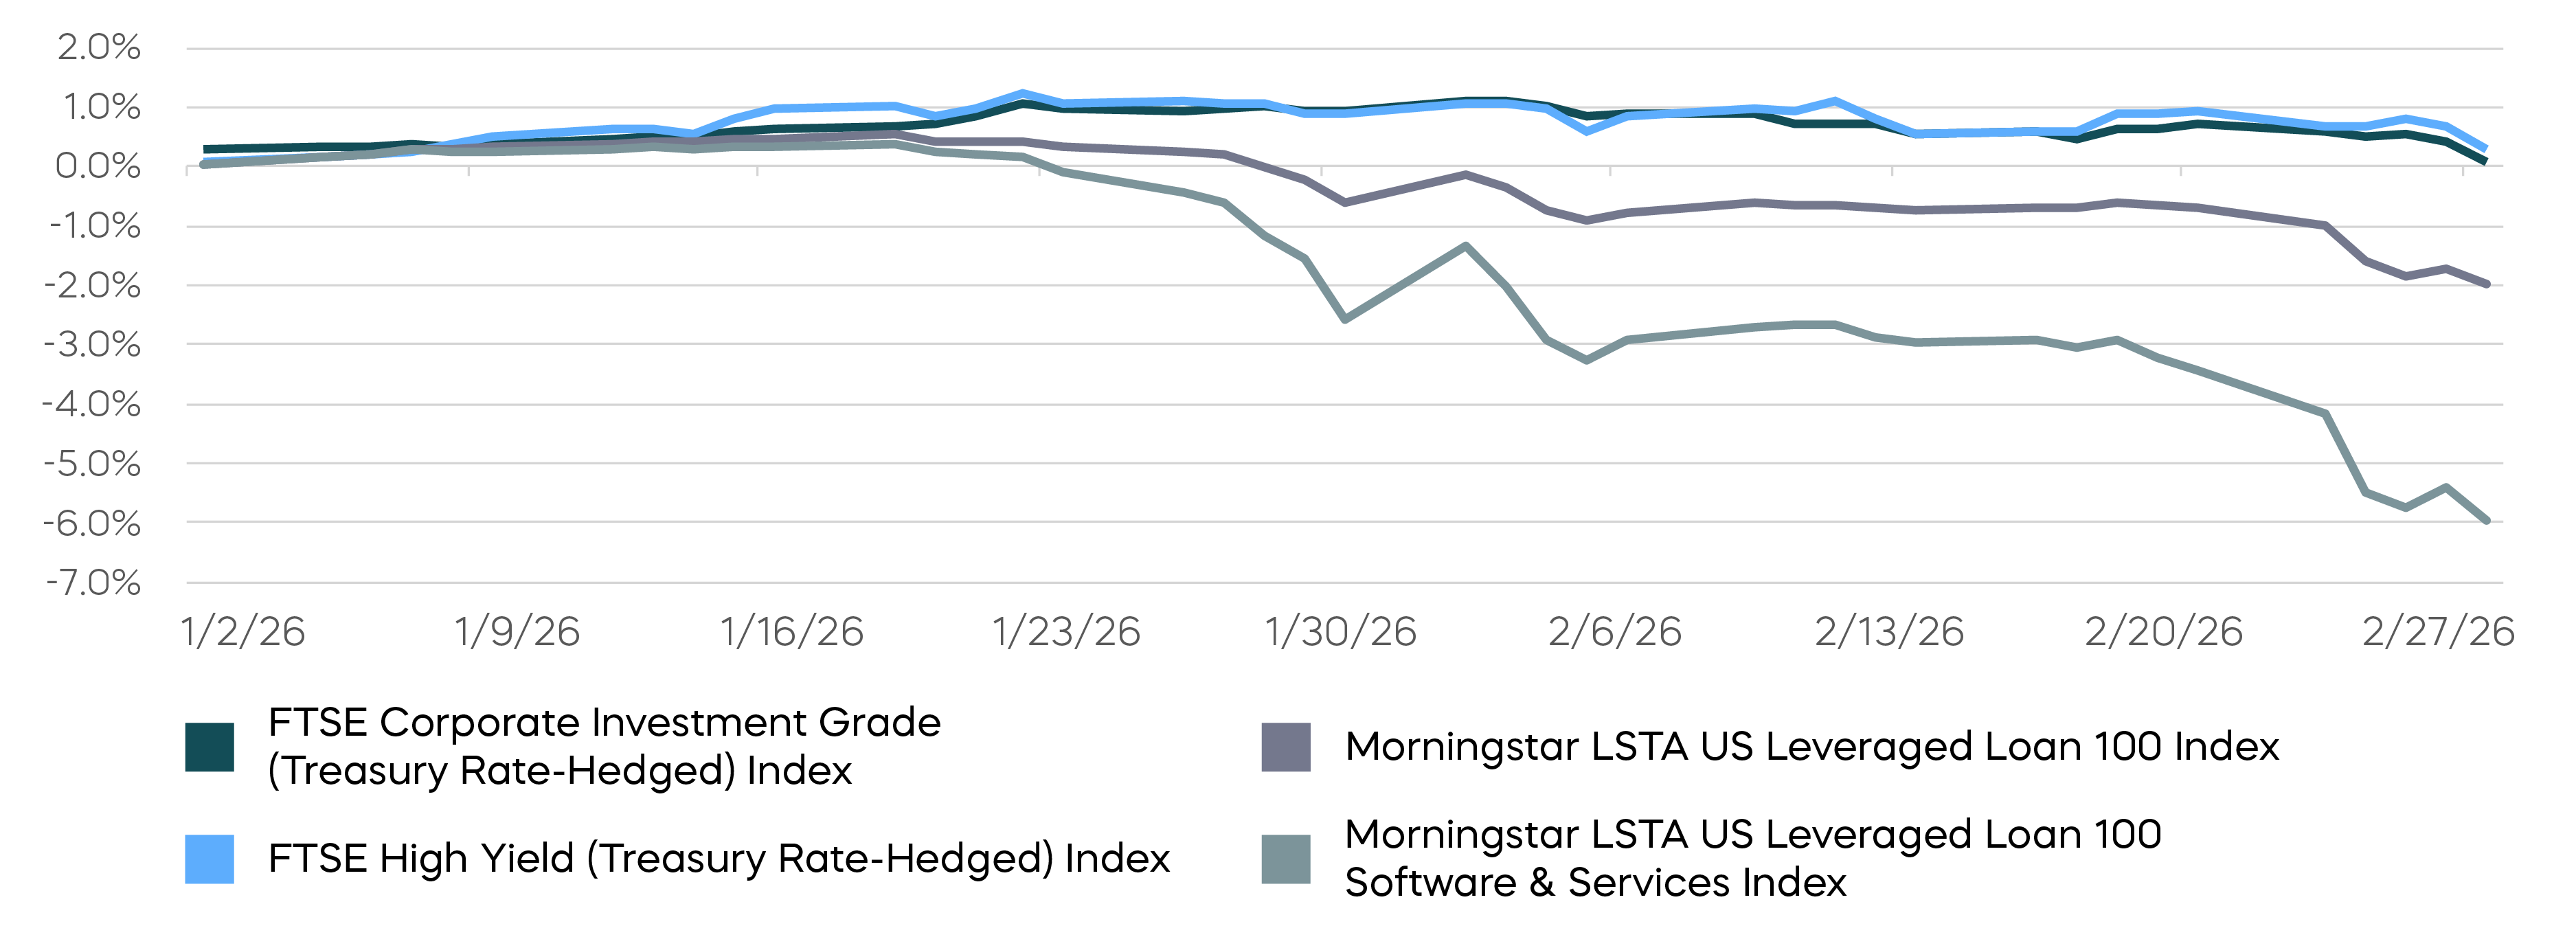
Private credit lenders like Blue Owl provided much of the financing to software companies at peak post-COVID valuations, but the public markets have not been insulated as sentiment has deteriorated. Within leveraged finance, software represents roughly 3% of the high-yield bond market but a meaningful 13% of the broadly syndicated loan market (Source: Bloomberg, as of 2/26/26). And these loans have materially underperformed year to date, weighing heavily on leveraged loan indexes.
Loans Have Significantly Underperformed This Year
Although cases of AI-driven disruption remain limited (and largely anecdotal), some degree of repricing may be rational. Among issuers that accessed the high-yield bond market in 2025, the average BB-rated software company carries approximately 3.4x net-debt-to-EBITDA, broadly in line with other sectors (Source: Bloomberg, as of 12/31/25).
Historically, however, software credits have benefited from a valuation premium that disruption from AI now puts at risk. The recurring, subscription-based nature of SaaS revenues has supported durable growth assumptions, allowing investors to tolerate tighter spreads and greater multiple risks. If AI meaningfully erodes pricing power or lowers switching costs, that structural advantage may diminish. As AI improves, there may be a dispersion of outcomes that could translate into wider spreads for companies looking to refinance their debt.
The balance sheet adds another layer of complexity. On average, roughly 57% of total assets for these BB-rated software issuers consist of goodwill (Source: Bloomberg, as of 12/31/25). In a disrupted environment, the valuation of intangible assets becomes more uncertain. If the durability of recurring revenues become uncertain, impairments could follow. For more leveraged borrowers, that could compress enterprise value and reduce the equity cushion.
Meanwhile, investors are expressing confidence in AI’s long-term potential. Alphabet’s recent £1 billion 100-year bond issuance was heavily oversubscribed and priced at 120 basis points over the closest 50-year Gilt. The spread was wider than Oxford University’s 100-year bond at 85 basis points in 2017, but nonetheless indicative of strong demand.[1] That a technology company can access century financing at these levels suggests the market is treating AI as a structural theme with lasting relevance.
In addition, the sell-off in software credit has largely been treated as sector-specific. That may reflect a calibrated view that current AI progress will be most impactful in verifiable tasks such as mathematics and coding. It appears that investors are repricing disruption risk selectively, rather than assuming obsolescence outright.
For now, we think AI could more likely drive productivity gains and reshape competition rather than eliminate technology moats entirely. Its economic impact may unfold gradually, until firms focus more on cost structures during a slowdown. However, elevated uncertainty argues for discipline, especially since credit spreads were already tight. Extending investment horizons and maintaining selectivity may prove more effective for investors than tactically trading near-term valuation dislocations.
Spreads Have Widened in Response to Potential AI Disruption