
For the second time in a year, the U.S. is involved in a major military conflict with Iran. Again, investors are forced to determine how significant an impact this conflict will have on global markets.
Whenever there is conflict in the Middle East, the market’s reaction starts with oil. In 2025, oil prices had been climbing steadily for several months leading up to June’s U.S. attack on Iran’s nuclear enrichment programs, only to fall substantially as that short-lived conflict concluded.
Daily Crude Oil Futures Price During Previous Conflict
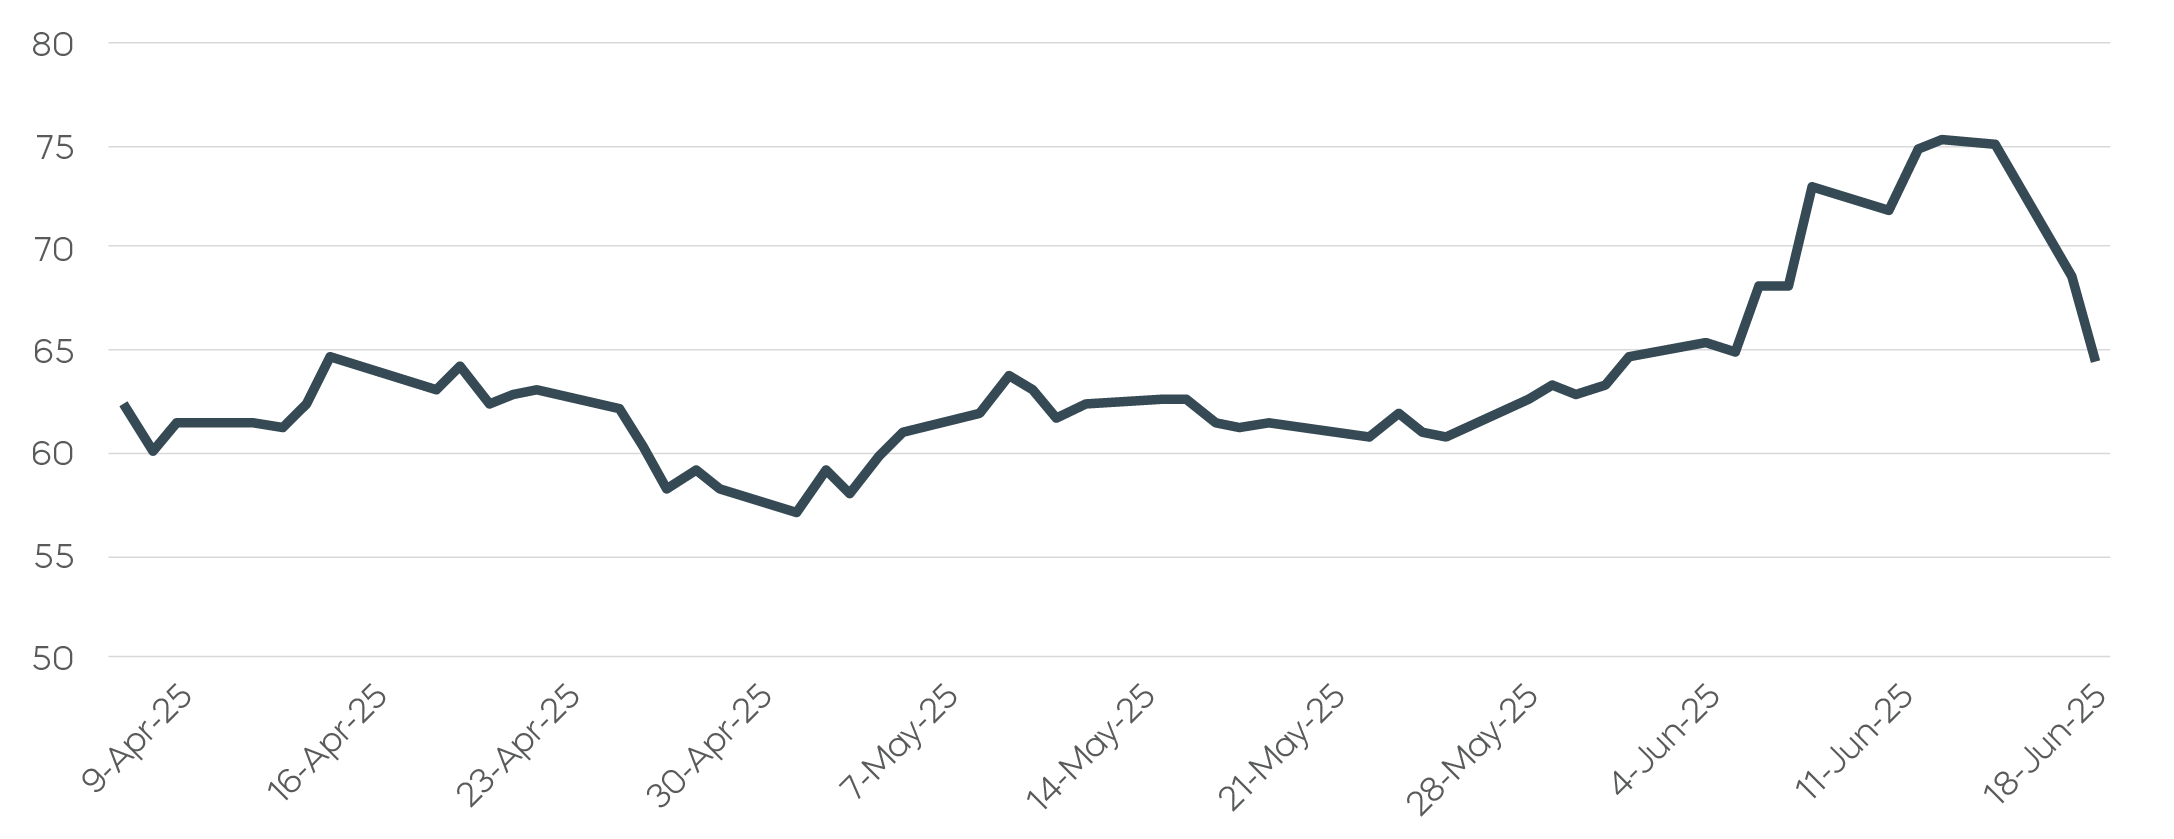 Source: Bloomberg, data 4/9/2025–6/24/2025.
The setup appears similar now, with oil rallying in the immediate aftermath of strikes on Iran and a wider escalation of attacks across the region.
Daily Crude Oil Futures Price Leading Into Current Conflict
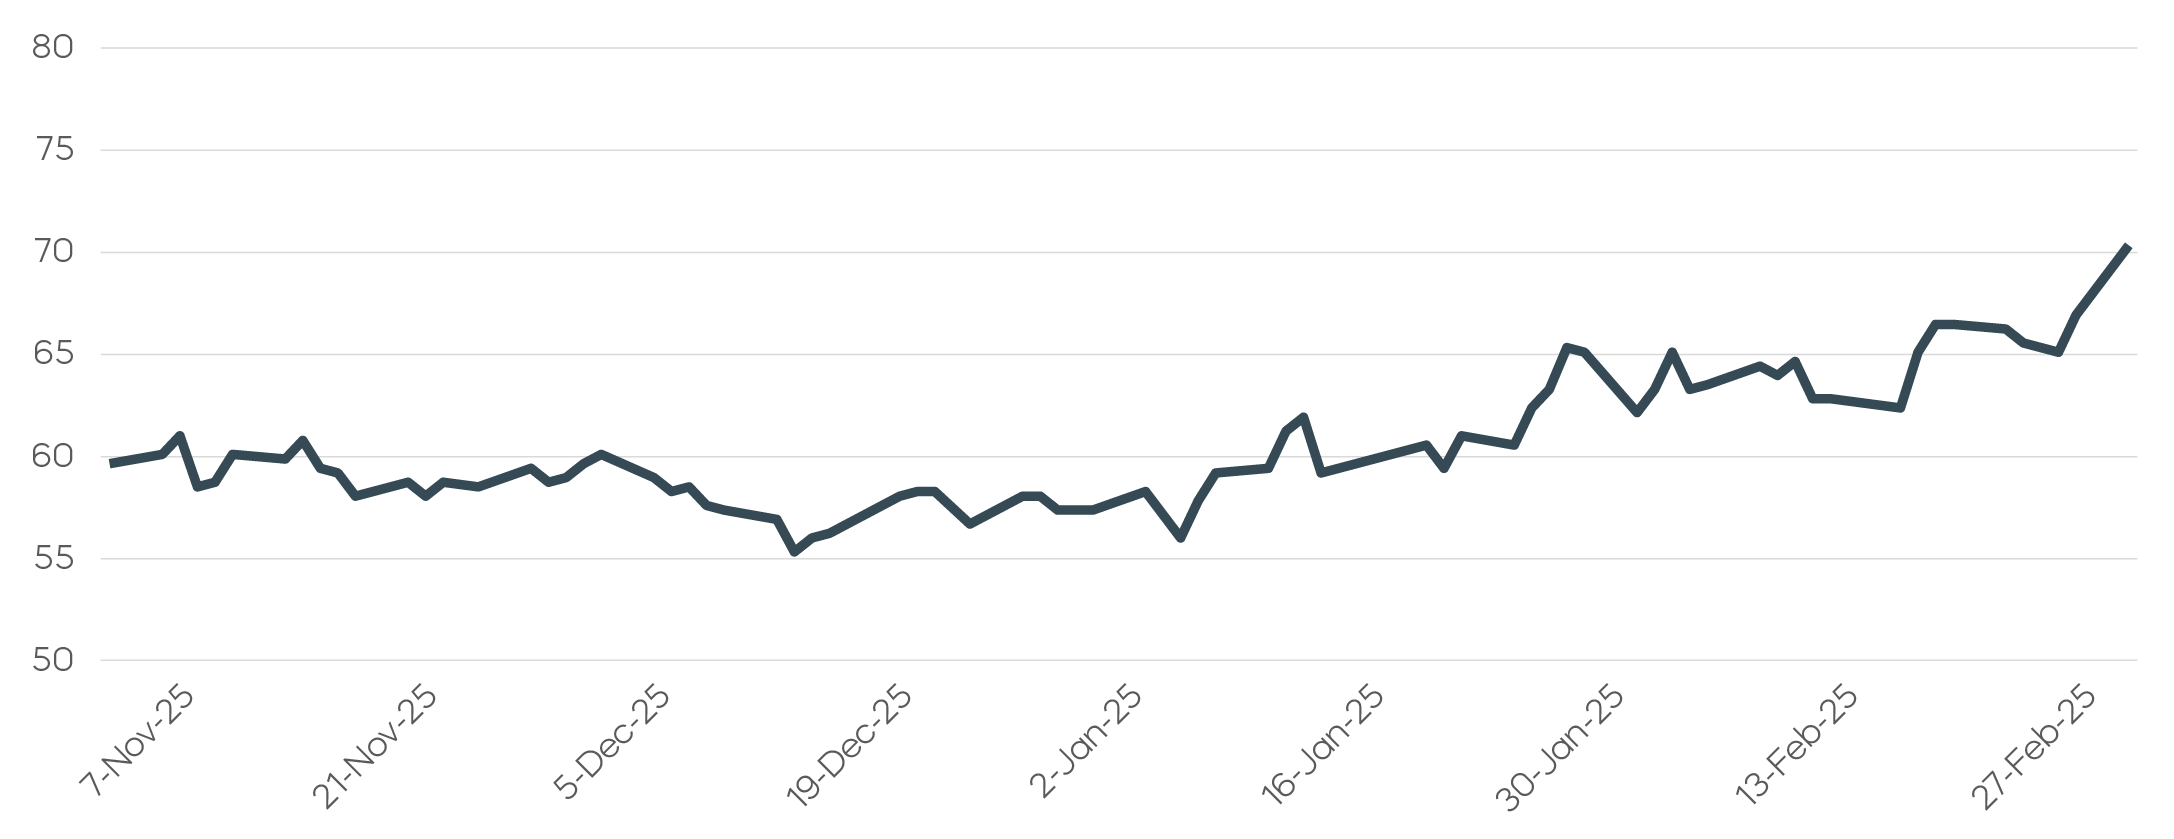 Source: Bloomberg, data 11/7/2025–3/2/2026.
A more muted response from crude markets in the weeks ahead could be yet another example of a changing dynamic in global energy’s balance of power: A key to oil’s quick retreat in 2025 was the Unites States’ position at the top of oil league tables.
Top 10 Oil-Producing Nations and Share of Global Oil Production
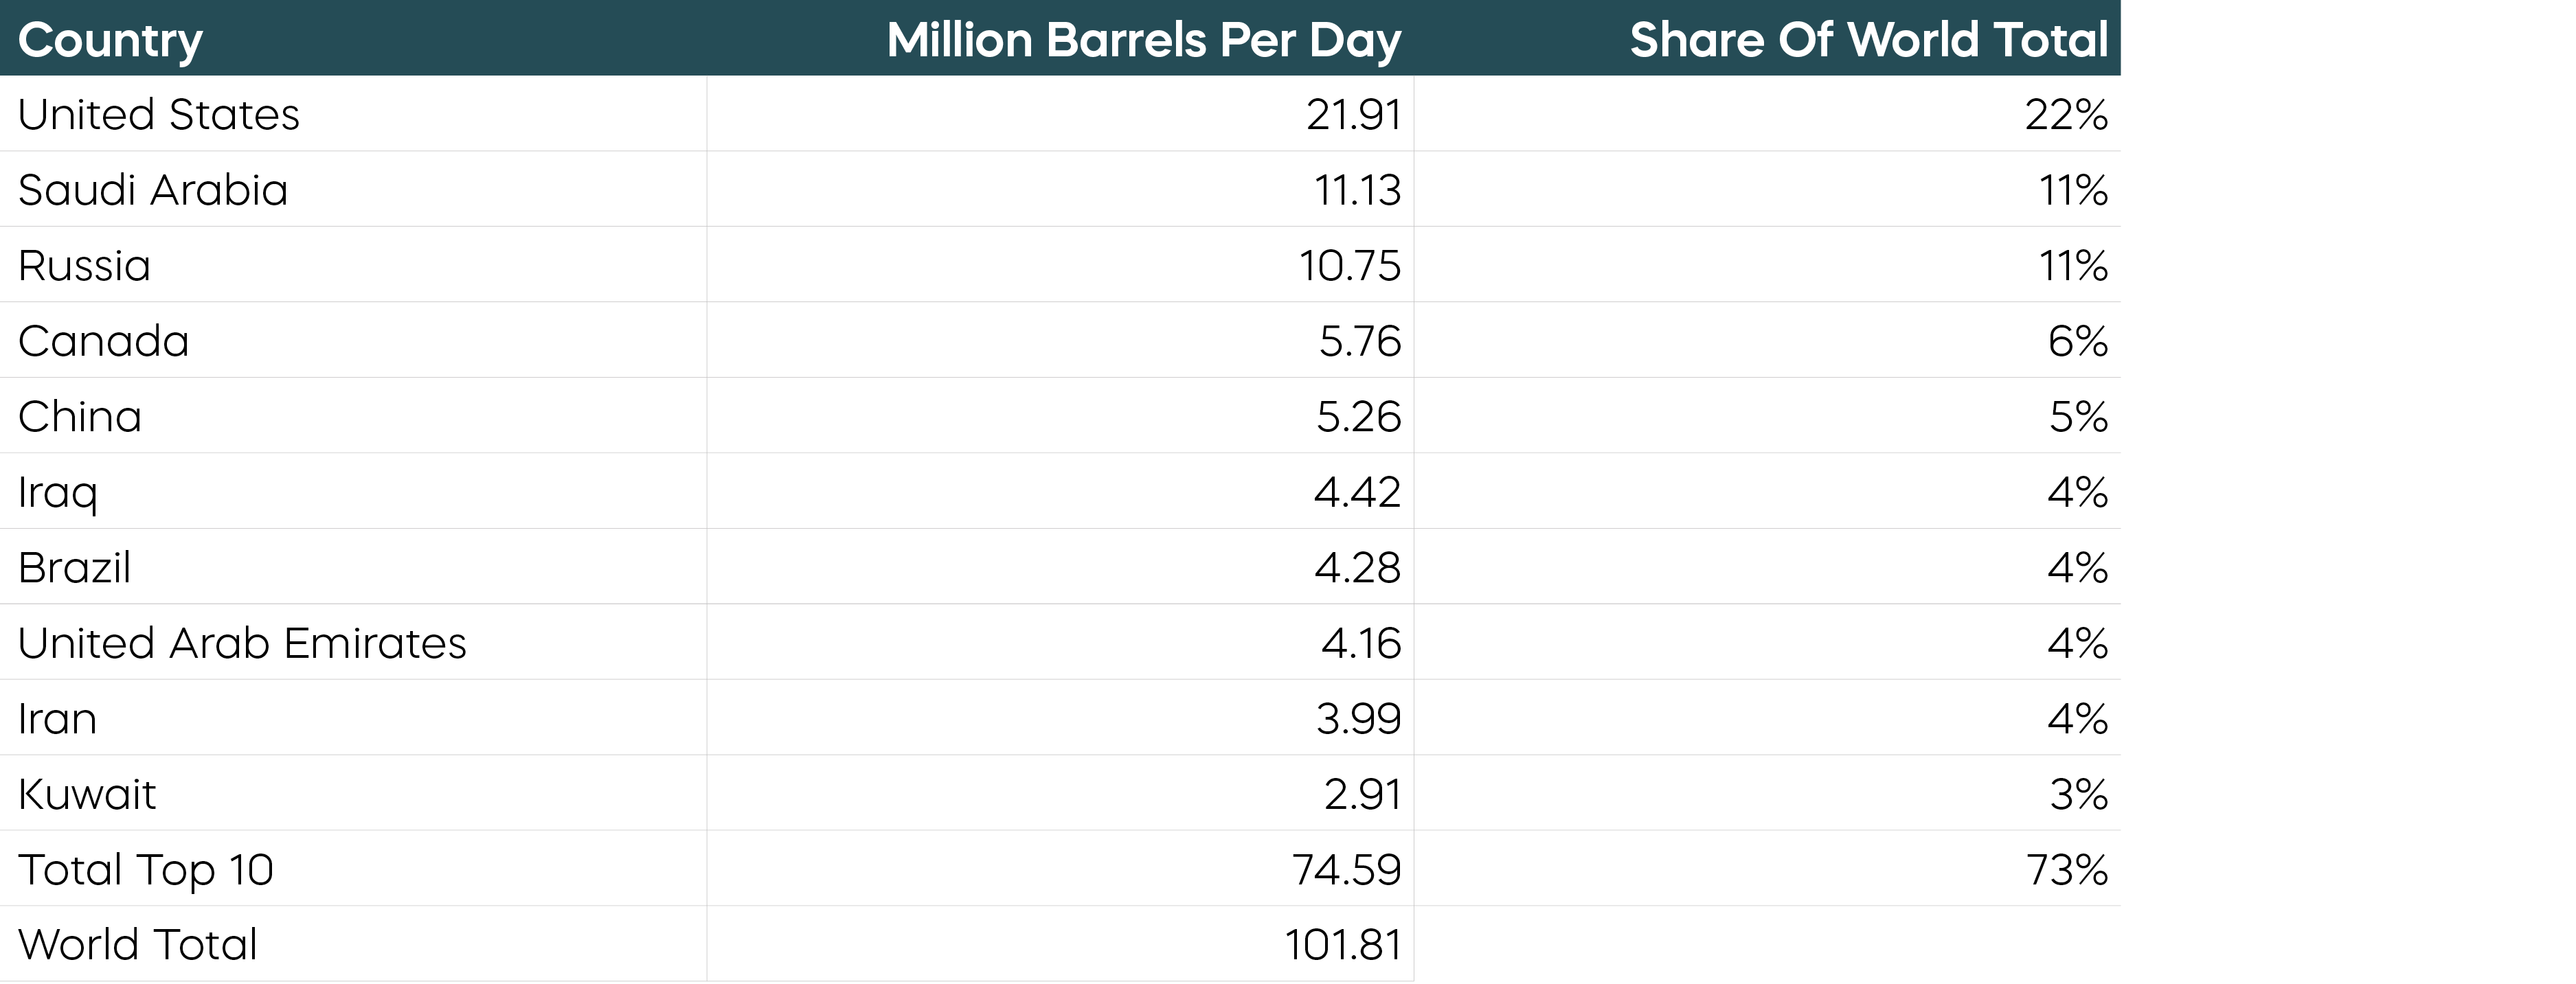 Source: U.S. Energy Information Administration, based on top 10 oil producers and share of total world oil production in 2023. Oil includes crude oïl, all other petroleum liquids, and biofuels. Production includes domestic production of crude oil, all other petroleum liquids, and biofuels and refinery processing gain. Data from U.S. Energy Information Administration, International Energy Statistics, Total oil (petroleum and other liquids) production, as of April 11, 2024.
That 22% share for the Unites States is up from less than 7% in 2008, according to Statista. And higher oil prices could prompt even more U.S. production, with the shale oil breakeven price estimated to be around $70 per barrel.
The near-term impact of the current conflict with Iran and an impeded Strait of Hormuz could be a significant increase in oil prices. But conflict in the Middle East is no longer a one-way sustained ticket up for oil.
Equity markets, too, showed resilience in the face of conflict. Between June 13 and year-end, the S&P 500 gained roughly 14%, (Source: Bloomberg, 6/13/25–12/31/25). And even if this new conflict is more protracted, markets held up well during both Gulf Wars.
After the start of the first Gulf War in 1990, the S&P 500 recovered its initial losses in just a few months. By the end of 1991, the S&P 500 had risen over 29% from the launch of Operation Desert Shield in August of 1990, as shown below.
First Gulf War (August 1990)
S&P 500 Index Total Return
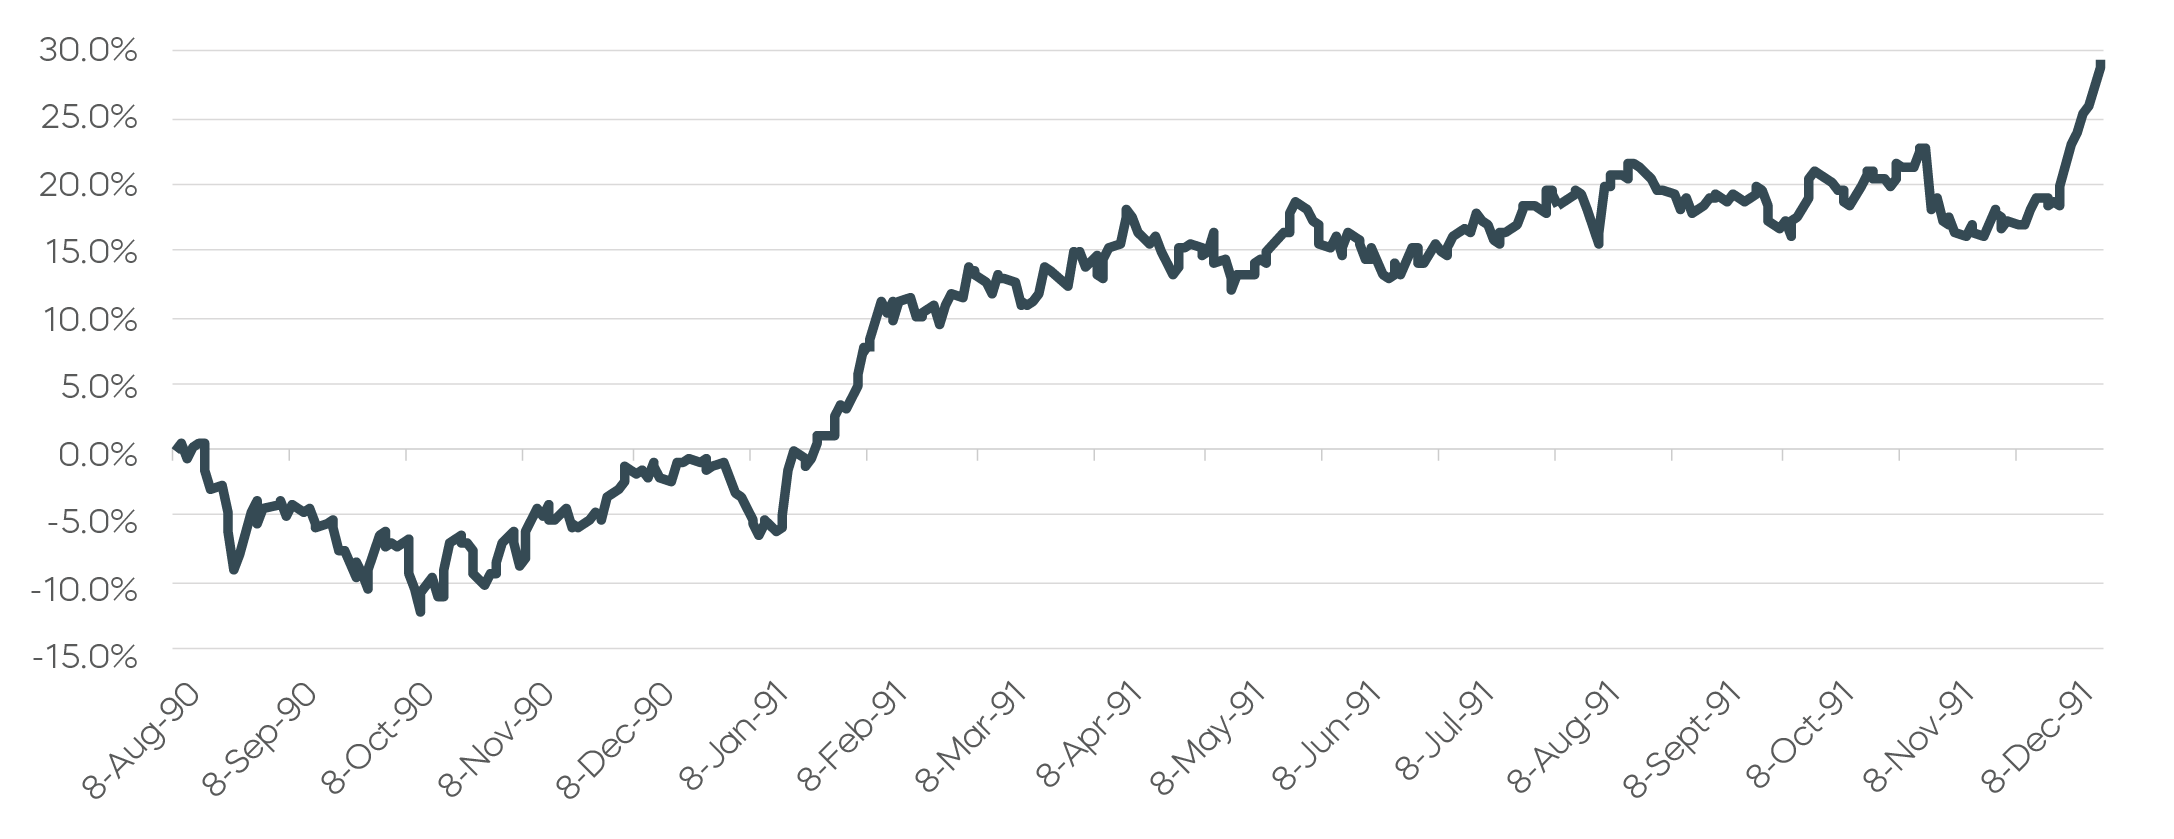 Source: Bloomberg, data 8/8/1990–12/31/1991.
And prior to the beginning of the second Gulf War in 2003, the S&P 500 had fallen modestly. But its recovery began even before the U.S. invasion on March 20, and the index ended the year up roughly 29%, as seen below.
Second Gulf War (March 2003)
S&P 500 Index Total Return
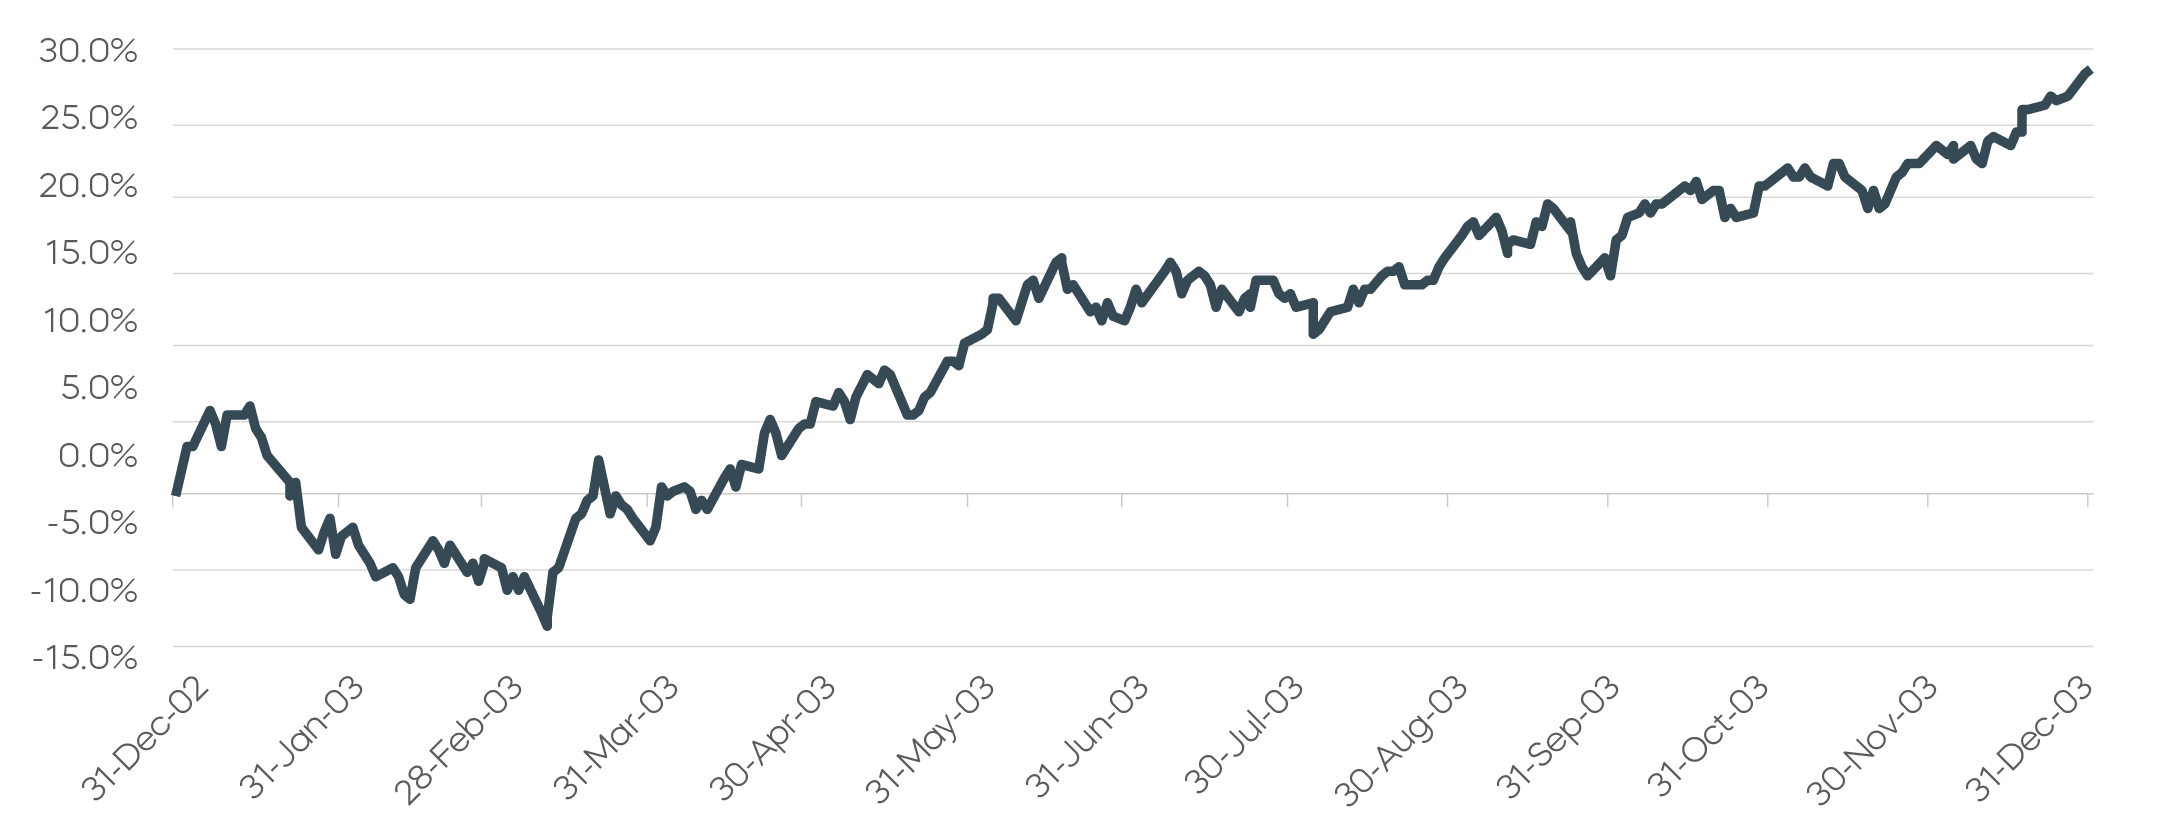 Source: Bloomberg, data 12/31/2002–12/31/2003.
Military conflicts and geopolitical tensions may give rise to significant uncertainty in both equity and energy markets—but they do not always lead to protracted declines.