Aristocrats Haven’t Been This Cheap in Over a Decade
Major U.S. equity benchmarks kept marching higher during the first eight months of 2021, with the S&P 500 closing at multiple record highs throughout the year. However, traditional valuation metrics—even after adjusting for today’s low interest rates—still appear to be at a level between near fully valued to mildly elevated, relative to historical norms. But the market isn’t monolithic, and as is often the case, there are relative bargains available, if one knows where to look. One area of the market that appears to be a potential bargain in terms of valuation is a strategy like the S&P 500® Dividend Aristocrats®.
While there is no guarantee of future results, levels like today’s for the Dividend Aristocrats have historically been opportune times to invest in the strategy in order to maximize the potential for long-term outperformance.
Levels like today’s for the Dividend Aristocrats have historically been opportune times to invest in the strategy to maximize the potential for long-term outperformance.
Understanding Current Valuations
Valuation is a complex concept and a combination of science and art. To keep things straightforward, we will focus on one common metric: price-to-earnings (or P/E) ratio. For the earnings portion of this, we will use estimated forward earnings.
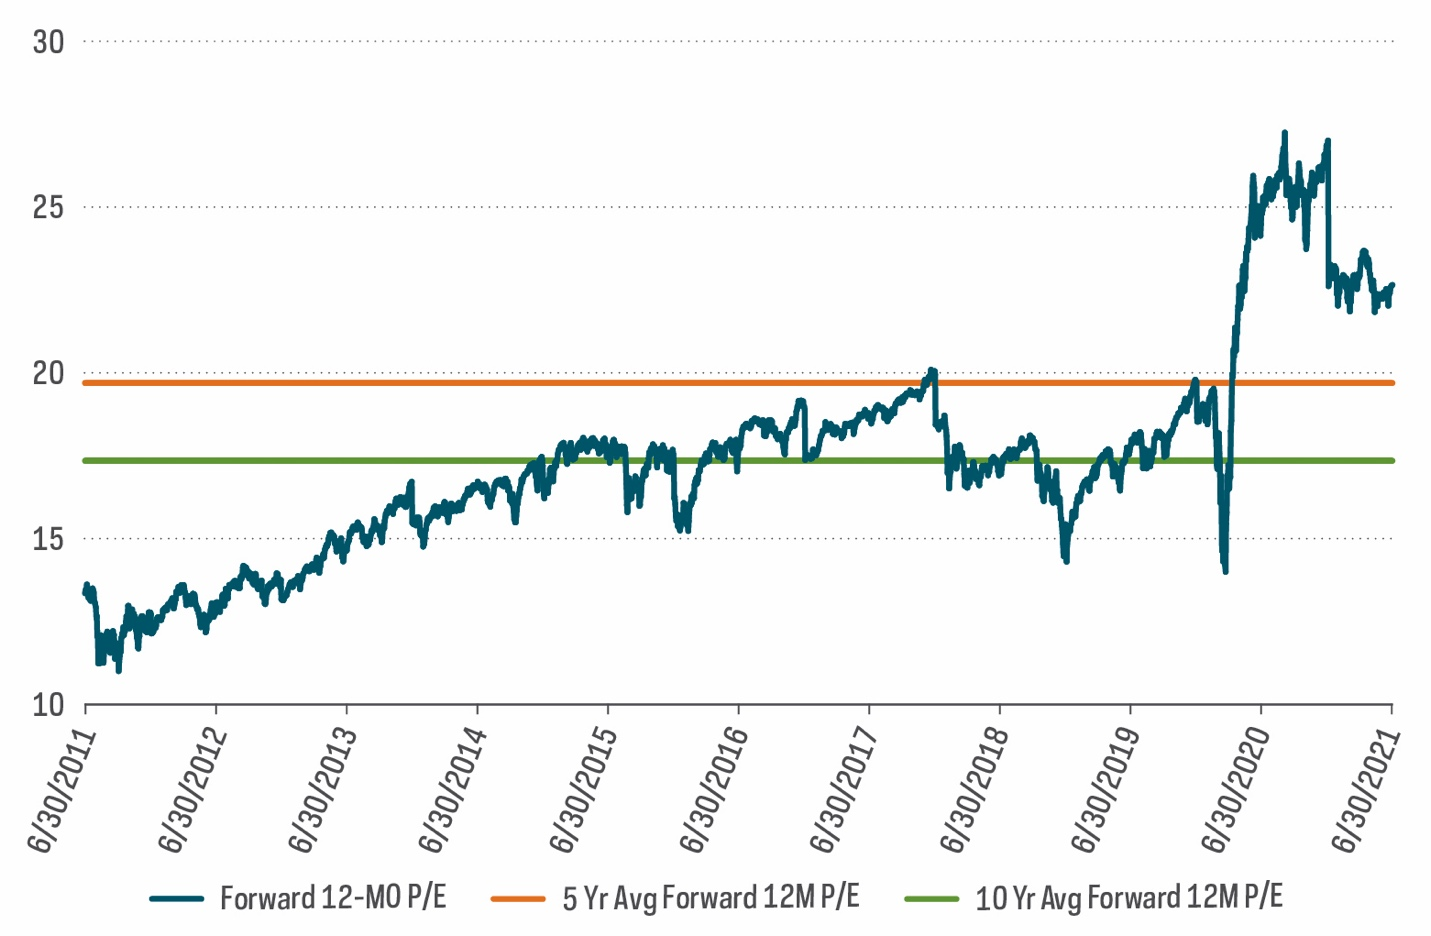
According to FactSet, consensus estimate for S&P 500 future 12-month earnings was approximately $204 per share as of 8/31/21. Using that as our denominator, and inserting the S&P 500’s price of 4,405 on 8/20/21, produces a forward P/E ratio of just over 21.5 times earnings. How does that compare historically?
The 10-year average multiple shown below was just over 17x as of 6/30/21. From this vantage point, the current market appears elevated.
Today’s P/E Ratio Appears Elevated
(S&P 500 Forward 12-Month P/E Ratios)

Source: Bloomberg. Data from 6/30/11‒6/30/21. The P/E ratio shows how much investors are paying for a dollar of a company's earnings. Price-to-sales ratio shows how much investors are paying for a dollar of a company’s sales. Price-to-book ratio measures market value of a fund or index relative to the collective book values of its component stocks. Price-to-cash-flows ratio measures the value of a stock’s price relative to its operating cash flow per share.
What About Interest Rates?
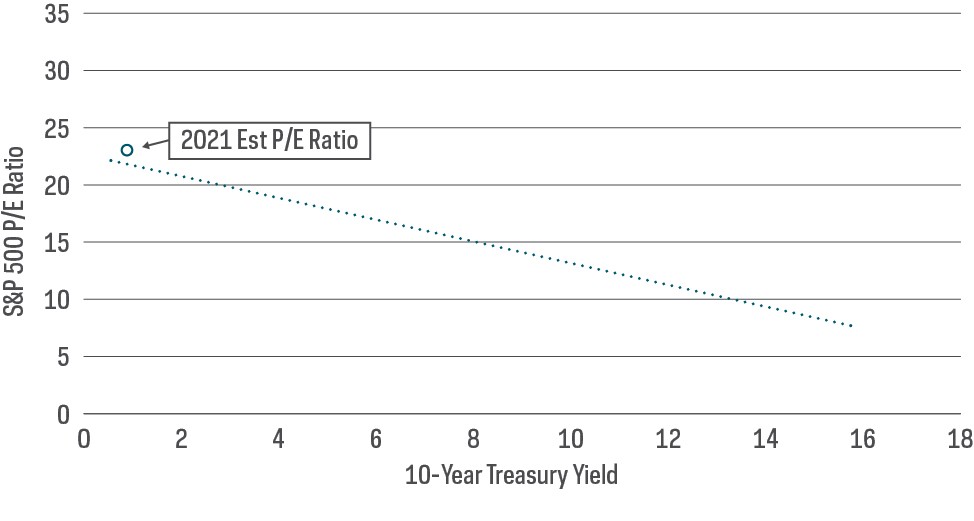
We’ve made this same point in our 2021 market outlook, but it bears repeating: The level of interest rates provides at least some measure of useful context for today’s valuations. While not necessarily predictive, lower rates may indeed provide some explanation for higher valuations. Intuitively, this makes sense. If the market is generally a discounting mechanism, then today’s lower interest rates—all else equal—make the present value of tomorrow’s earnings more valuable.
S&P 500 P/E Ratio Versus Interest Rates
(1962-2021)

Source: Bloomberg. Data from 3/30/62‒6/30/21. Trendline established based on historical relationship between P/E ratios and 10-year Treasury yields measured on a quarterly basis.
The Market Is Growing into Valuations
For investors still anxious about valuations, the good news is that S&P 500 gains during the first half of 2021 were not driven by valuations extending from the already elevated levels at the end of 2020. In fact, P/E valuations for the S&P 500 have stabilized of late and begun trending downwards.
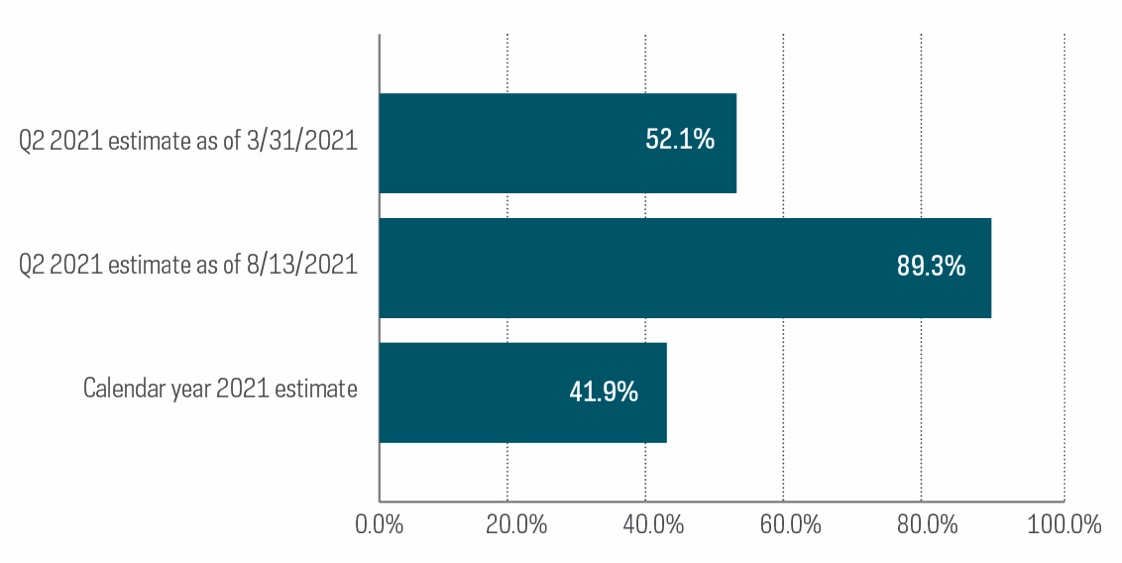
If price has been moving higher while the P/E ratio is moving lower, it must be that the “E” (earnings) have also been rising. Indeed, earnings growth from corporate America has been robust since the depths of the pandemic. First quarter 2021 year-on-year earnings growth was 53%, and second quarter was over 89%. The even better news is that analyst estimates for future earnings growth continue to move even higher. Take second quarter earnings as an example. At the start of the second quarter earnings season (3/31/21), analysts were expecting earnings growth of roughly 52%. By mid-August, those estimates had been revised upwards to growth of over 89%. Companies aren’t just meeting estimates with robust growth rates. They are smashing through estimates and raising future guidance. For the full year, earnings are now expected to grow almost 42%. The market’s fundamental earnings picture seems to keep getting better. If recent trends continue, better-than-expected earnings may be just the fuel needed to propel equity markets higher, while also bringing valuations back to more reasonable levels.
American Corporate Earnings Eclipsing Estimates

Source: FactSet. Calendar year 2021 estimate as of 8/13/2021.
Today’s lofty earnings growth numbers will eventually moderate. Some companies—perhaps even some of the largest market-cap names that have been doing much of the heavy lifting—may miss earnings estimates, or at least disappoint. While this is not the current situation, a potential scenario of weakening fundamentals combined with full valuations is probably not a good recipe for strong stock returns. Where can investors turn for a bargain?
A potential solution can be found with the S&P 500 Dividend Aristocrats, high-quality companies that have grown their dividends continuously for at least 25 consecutive years. The Dividend Aristocrats have historically demonstrated hallmarks of quality like stable earnings, solid fundamentals, and strong histories of profit and growth. Stocks like the Dividend Aristocrats are arguably well positioned to continue consistently delivering the earnings growth “fuel” that could drive future market returns.
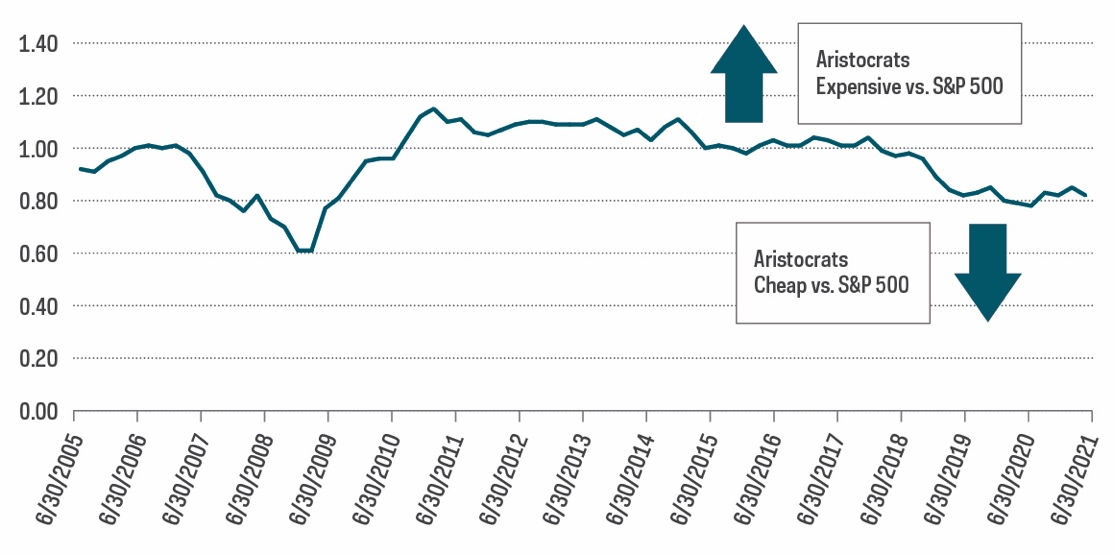
The S&P 500 Dividend Aristocrats are also trading at the cheapest valuation levels relative to the S&P 500 in over a decade. While investors often pay a premium for quality stocks like the Dividend Aristocrats, causing them to trade at higher valuation levels compared with the S&P 500, today’s situation is much different. Relative to the S&P 500, the Dividend Aristocrats traded at roughly 80% of the market’s P/E valuation as of 6/30/21. This is the cheapest level the Aristocrats have traded since March 31, 2010.
S&P 500 Dividend Aristocrats Are a Potential Bargain

Source: Bloomberg. Data from 6/30/05‒6/30/21
Potential Buy Signal?
Favorable valuations generally aren’t considered very useful to predict returns over shorter time horizons, but the story is different for longer term returns. In fact, starting valuations tend to heavily influence returns over longer periods of time.
We can use historical performance information for the S&P 500 Dividend Aristocrats to provide some evidence. The last time the S&P 500 Dividend Aristocrats Index traded at similar valuation levels relative to the S&P 500 was the end of first quarter of 2010, shortly after the 2007-2008 Financial Crisis. From that point, it outperformed the S&P 500 over the subsequent 1-, 3- and 5-year periods, indicating that today’s discounted valuations may be another potentially opportune entry point.
Dividend Aristocrats Index Historical Outperformance
(1-, 3- and 5-Year Forward Returns After the Financial Crisis)
|
1 Year |
3 Year |
5 Year |
|
|
Total S&P 500 TR USD |
15.65% |
12.67% |
14.47% |
|
S&P 500 Dividend Aristocrats TR USD |
15.86% |
16.66% |
16.83% |
|
Aristocrats Outperformance |
0.21% |
3.99% |
2.36% |
Source: Morningstar. Data from 4/1/10‒3/31/11 for one-year period, 4/1/10‒3/31/13 for three-year period, and 4/1/10‒3/31/15 for five-year period.
Spotlight on Select Aristocrats
As of 8/31/21, the S&P 500 Dividend Aristocrats Index included 65 companies that had grown their distributions for a minimum of 25 consecutive years. Of course, many of those companies have grown their distributions for much longer, and at attractive growth rates. Combining a long record of dividend growth with solid dividend growth rates has generally been a compelling strategy for investors seeking capital appreciation and the potential to outperform the S&P 500.
The table below shows select S&P 500 Dividend Aristocrats companies that have not just grown their distributions for at least 25 consecutive years, but also produced double-digit dividend growth rates over the last 10 years and that are currently trading at lower valuations than the overall market.
Double-Digit Growth Rates and Below-Market Valuations
|
Years of Dividend Growth |
10-Year Dividend Growth Rate |
Trailing P/E Ratio |
Trailing 10-Year Returns |
Trailing 20-Year Returns |
Trailing 30-Year Returns |
|
|
A.O. Smith |
28 |
21.5% |
26.2 |
22.8% |
19.2% |
17.4% |
|
Expeditors Int'l |
26 |
10.0% |
21.3 |
11.9% |
12.8% |
18.8% |
|
General Dynamics |
29 |
10.1% |
17.2 |
13.8% |
10.5% |
16.9% |
|
Lowe's |
46 |
20.4% |
21.2 |
26.7% |
13.8% |
20.2% |
|
Target |
49 |
11.4% |
20.1 |
21.0% |
12.2% |
15.6% |
|
Walgreens Boots Alliance |
45 |
11.3% |
18.4 |
4.6% |
3.5% |
10.0% |
|
S&P 500 |
- |
- |
27.7 |
15.3% |
8.8% |
10.6% |
Source: FactSet, Bloomberg. Data from 8/1/99‒7/31/21.
The Takeaway
Continued equity market strength has resulted in the S&P 500 regularly setting new record highs thus far in 2021. However, it also has markets trading at valuations ranging from near fully valued to mildly expensive, even after adjusting for the low level of interest rates. The good news is that corporate earnings have been robust, allowing for the potential of valuations to moderate if recent trends continue. In a fully valued market, the S&P 500 Dividend Aristocrats are currently trading at the cheapest relative valuations in over a decade and offer a potential bargain. Historically, similar valuation levels to the ones seen now have been attractive entry points for Dividend Aristocrats investors seeking outperformance.
This is not intended to be investment advice. Any forward-looking statements herein are based on expectations of ProShare Advisors LLC at this time. ProShare Advisors LLC undertakes no duty to update or revise any forward-looking statements, whether as a result of new information, future events or otherwise.
Investing is currently subject to additional risks and uncertainties related to COVID-19, including general economic, market and business conditions; changes in laws or regulations or other actions made by governmental authorities or regulatory bodies; and world economic and political developments.
The "S&P 500® Dividend Aristocrats® Index" and "S&P MidCap 400® Dividend Aristocrats® Index" are products of S&P Dow Jones Indices LLC and its affiliates. All have been licensed for use by ProShares. "S&P®" is a registered trademark of Standard & Poor's Financial Services LLC ("S&P") and "Dow Jones®" is a registered trademark of Dow Jones Trademark Holdings LLC ("Dow Jones") and have been licensed for use by S&P Dow Jones Indices LLC and its affiliates. ProShares have not been passed on by these entities and their affiliates as to their legality or suitability. ProShares based on these indexes are not sponsored, endorsed, sold or promoted by these entities and their affiliates, and they make no representation regarding the advisability of investing in ProShares. THESE ENTITIES AND THEIR AFFILIATES MAKE NO WARRANTIES AND BEAR NO LIABILITY WITH RESPECT TO PROSHARES.
Learn More
NOBL
S&P 500 Dividend Aristocrats ETF
Seeks investment results, before fees and expenses, that track the performance of the S&P 500® Dividend Aristocrats® Index.
REGL
S&P MidCap 400 Dividend Aristocrats ETF
Seeks investment results, before fees and expenses, that track the performance of the S&P MidCap 400® Dividend Aristocrats® Index.
TDV
S&P Technology Dividend Aristocrats ETF
ProShares S&P Technology Dividend Aristocrats ETF seeks investment results, before fees and expenses, that track the performance of the S&P® Technology Dividend Aristocrats® Index.