Key Observations

The earnings recession is here. S&P 500 earnings shrank nearly 6% in the second quarter, on top of the over 3% they declined during the first quarter. Optimists will note that those earnings were, at least, better than expected. And S&P 500 companies did deliver a nearly 8% positive earnings surprise, with guidance that seemed generally positive too.
However, investors looking for something more substantive than surprises and guidance may want to look toward the comparatively strong earnings results for the S&P 500 Dividend Aristocrats.
Chart of the Month
First Half 2023 S&P 500 Earning Results
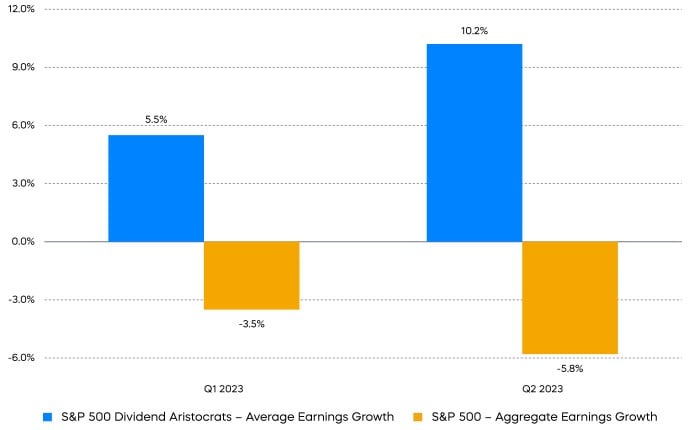
Source: Bloomberg, data as of 9/5/23. Quarterly earnings announced starting from one and half months after the end of the prior calendar quarter. Average earnings growth rate for the S&P 500 Dividend Aristocrats; aggregate earnings growth rate for the S&P 500.
Finding stocks that are growing earnings in the current environment is important. Keep our cautionary theme in mind. Even when the Fed ultimately reduces the Fed Funds Rate, long term interest rates—for example, rates on 10-year Treasurys—are, we think, likely to remain stable. That suggests stable price-to-earnings (P/E)1 multiples, leaving stocks at the mercy of earnings.
The S&P 500 Dividend Aristocrats have had modestly lower profit margins in aggregate than the S&P 500. However, they have also had substantially higher return on assets. Even with lower margins, the S&P 500 Dividend Aristocrats have been more efficient at turning investments into profits. That’s a powerful advantage.
It is one thing for a company to grow earnings, but if it needs an overly large amount of assets to do so, those earnings may have to be reinvested in the company—not given back to shareholders in the form of dividends. The S&P 500 Dividend Aristocrats, on the other hand, have been growing earnings during an earnings recession, and they seem well positioned to translate those earnings into dividends for their shareholders. This could make them a timely investment opportunity.
Performance Recap
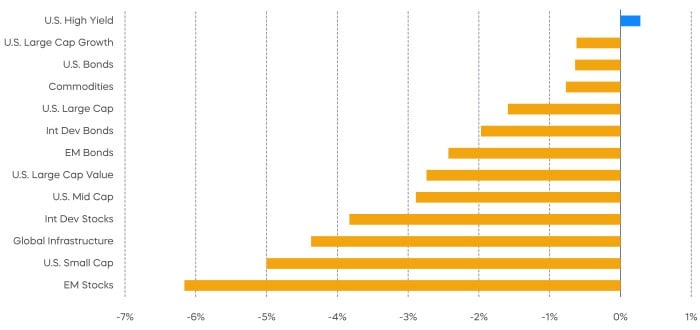
Risk assets broadly pulled back in August as Treasury yields rose. Dollar strength weighed on emerging markets performance.
Asset Class Returns—August 2023
Asset Class Returns—Year to Date
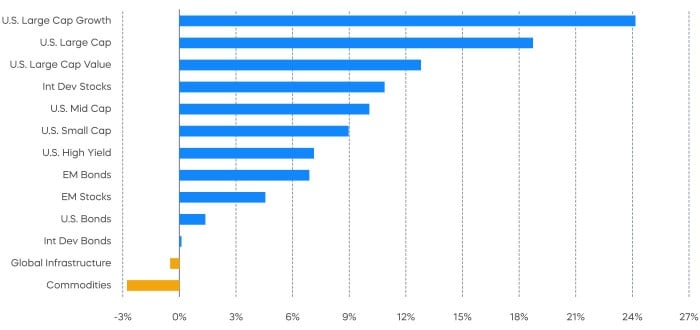
Source: Bloomberg. August returns 8/1/23‒8/31/23; year-to-date returns 1/1/23‒8/31/23. Index returns are for illustrative purposes only and do not reflect any management fees, transaction costs or expenses. Indexes are unmanaged, and one cannot invest directly in an index. Past performance does not guarantee future results.
Economic Calendar
Here’s a list of key and upcoming economic releases, which can serve as a guide to potential market indicators.

Source: Bloomberg, as of 9/6/23.
Equity Perspectives

Earnings Matter
As Simeon noted above, the second quarter earnings season was not inspiring. It marked the third consecutive quarter of earnings declines. Faring worse than large cap S&P 500 results, however, were mid-cap and small-cap companies. The S&P MidCap 400 and S&P SmallCap 600 indexes each saw their second-quarter earnings decline by over 20% from the prior year. Analysts’ expectations on future earnings are more optimistic though. The S&P 500 is expected to be roughly flat for the full year 2023, before advancing potentially 12% in 2024. Until then, higher quality stocks that can deliver earnings resilience—like Dividend Aristocrats—seem well positioned as we enter the historically volatile September and October months.
One sector of the market that may be a harbinger for improving earnings fundamentals is technology. Early signs appear favorable based on second quarter results. According to FactSet, second-quarter tech earnings on June 30, 2023 were expected to decline by 3.5%. The actual results were a 4% increase.
Those aren’t blockbuster results, but they are encouraging given the slowdown in growth we’ve seen and importance of the technology sector to the overall market. And it is possible that 2024 could be even better. Not only are tech stocks forecasted to produce the fastest revenue growth of any sector, they have also been producing the highest profit margins.
Tech Stocks: Favorable Revenue Growth with Fat Margins
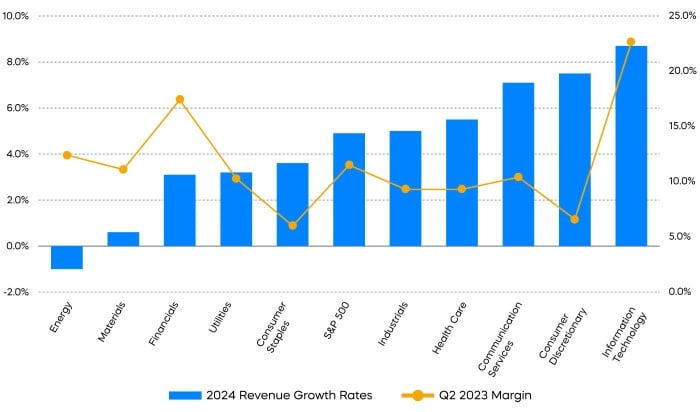
Source: FactSet. Revenue growth rates are consensus analyst expectations for 2024. Profit margins are as of Q2 2023.
Technology Aristocrats: Profitable Growth
With the Fed intent on slowing the economy, stretched valuations, and corporate earnings contracting, investors who are looking to take advantage of this equity rally should be choosy. One way to focus on technology-oriented companies that are profitable and producing robust cash flows could be through a dividend growth strategy. The S&P Technology Dividend Aristocrats are a collection of tech-related companies that have grown their dividends for at least seven consecutive years. Currently trading below 70% of the tech sector’s price-to-earnings ratio, the S&P Technology Dividend Aristocrats may offer a rare combination in today’s market: robust growth at reasonable valuations.
Fixed Income Perspectives

Rates continued to rise during the month of August, hitting their year-to-date highs. Meanwhile, credit spreads held steady, dampening the impact of rate volatility.
Fixed Income Returns—August 2023
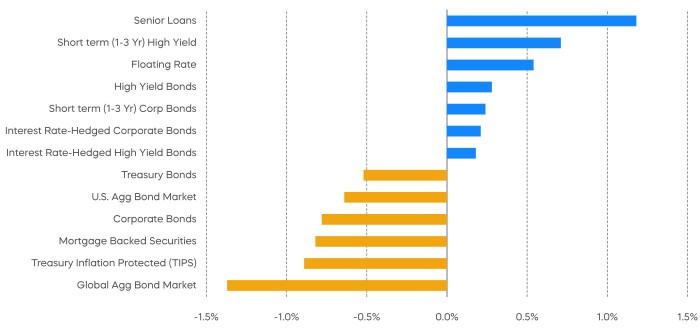
Source: Bloomberg. Data as of 8/31/23.
Income or Diversification?
Historically, investors have turned to bonds to add both income and diversification to their portfolios. In his economic outlook delivered at this year’s Jackson Hole symposium, the Federal Reserve chair Jerome Powell acknowledged the substantial progress made towards easing inflation, raising the odds that the Fed could be closing in on the end of rate hikes. This potential shift in policy has brought more focus to price movement from changing interest rates.
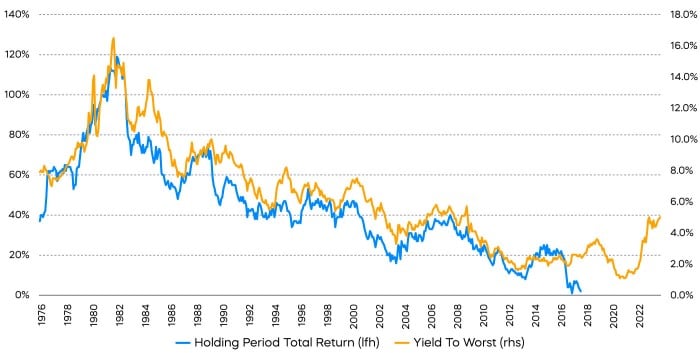
In recent months, we’ve argued that long-term interest rates should remain higher-for-longer in the current environment. Still, many investors who mainly use bonds as diversification for their equity portfolios are effectively trying to time the next big move in interest rates.
Bloomberg U.S. Aggregate Bond Index Yield versus Total Returns
Source: Bloomberg, monthly data from 1/1/1976–8/31/23. Holding period total returns (blue line) are labeled based on start dates of holding periods; data is not available from 7/31/17–8/31/23. “Holding period total return” is realized total return for a holding period equivalent to the index’s modified duration. “Yield to worst” is a measure of the lowest possible yield that can be received on a bond with an early retirement provision.
It’s important to keep in mind that a primary role of bonds is generating “fixed income.” Without any defaults, an investor will be repaid the principal if a bond is held to maturity. Therefore, the market price of a bond with $100 principal amount should approach $100 over the life of the bond. This behavior is commonly referred to as “pull-to-par,” and it occurs regardless of changes in interest rates. As a result, if we look at the Bloomberg U.S. Aggregate Bond Index, yield has been a great predictor of total return over any duration-adjusted holding period.
The implication for bond investors: Pay more attention to the yield you earn rather than trying to predict price movements from changes in interest rates. Currently, the net index yield of FTSE Treasury rate-hedged bond indexes are approximately 100 basis points higher than bond indexes with similar credit qualities, providing an edge towards not only higher income, but potentially higher total return.
[1] Price-to-earnings (P/E) is a ratio reflecting how much investors are paying for a dollar of a company's earnings.
Sources for data and statistics: Bloomberg, FactSet, Morningstar, and ProShares.
The different market segments represented in the performance recap charts use the following indexes: U.S. Large Cap: S&P 500 TR; U.S. Large Cap Growth: S&P 500 Growth TR; U.S. Large Cap Value: S&P 500 Value TR; U.S. Mid Cap: S&P Mid Cap TR; U.S. Small Cap: Russell 2000 TR; International Developed Stocks: MSCI Daily TR NET EAFE; Emerging Markets Stocks: MSCI Daily TR Net Emerging Markets; Global Infrastructure: Dow Jones Brookfield Global Infrastructure Composite; Commodities: Bloomberg Commodity TR; U.S. Bonds: Bloomberg U.S. Aggregate; U.S. High Yield: Bloomberg Corporate High Yield; International Developed Bonds: Bloomberg Global Agg ex-USD; Emerging Market Bonds: DBIQ Emerging Markets USD Liquid Balanced.
The S&P 500 is a benchmark index published by Standard & Poor's (S&P) representing 500 companies with large-cap market capitalizations. The S&P 500 Dividend Aristocrats Index targets companies that are currently members of the S&P 500 that have increased dividend payments each year for at least 25 years. The S&P MidCap 400 is an index designed to represent the performance of U.S. companies with midrange market capitalizations between $3.6 billion and $13.1 billion. The S&P SmallCap 600 is an index designed to represent the performance of small-sized U.S. companies with market capitalizations between $850 million and $3.6 billion. The Bloomberg U.S. Aggregate Bond Index or "the Agg" is a broad-based fixed-income index used as a benchmark to measure bond and bond fund relative performance. THESE ENTITIES AND THEIR AFFILIATES MAKE NO WARRANTIES AND BEAR NO LIABILITY WITH RESPECT TO PROSHARES.
This is not intended to be investment advice. Indexes are unmanaged, and one cannot invest directly in an index. Past performance does not guarantee future results.
Any forward-looking statements herein are based on expectations of ProShare Advisors LLC at this time. Whether or not actual results and developments will conform to ProShare Advisors LLC’s expectations and predictions, however, is subject to a number of risks and uncertainties, including general economic, market and business conditions; changes in laws or regulations or other actions made by governmental authorities or regulatory bodies; and other world economic and political developments. ProShare Advisors LLC undertakes no duty to update or revise any forward-looking statements, whether as a result of new information, future events or otherwise.
Investing involves risk, including the possible loss of principal. This information is not meant to be investment advice.
The “S&P 500®,” “S&P 500® Dividend Aristocrats® Index” and “S&P MidCap 400®” are products of S&P Dow Jones Indices LLC and its affiliates and have been licensed for use by ProShare Advisors LLC. "S&P®" is a registered trademark of Standard & Poor’s Financial Services LLC (“S&P”), and “Dow Jones®" is a registered trademark of Dow Jones Trademark Holdings LLC (“Dow Jones”) and they have been licensed for use by S&P Dow Jones Indices LLC and its affiliates. ProShares ETFs based on these indexes are not sponsored, endorsed, sold or promoted by these entities or their affiliates, and they make no representation regarding the advisability of investing in ProShares ETFs. THESE ENTITIES AND THEIR AFFILIATES MAKE NO WARRANTIES AND BEAR NO LIABILITY WITH RESPECT TO PROSHARES.