Key Observations

Here’s the market recap for September: Interest rates went up and stock prices went down. No surprises there. Stocks are worth the present value of their future earnings, and higher interest rates mean that those future earnings are discounted at a higher rate. Does it always work that way? No.
- If rising interest rates are concurrent with an extremely strong economy, expected corporate earnings growth may overcome higher interest rates and stock prices can rise.
- Conversely, if falling interest rates are concurrent with a severe recession, interest rates may fall, but stock prices can also fall, as corporate earnings are expected to fall.
Our current “middle-of-the-road” economy, where we believe economic growth will hover between slightly positive and slightly negative and drive only middling corporate earnings, is precisely the environment where those higher rates could take a bite out of stock prices.
Getting back to September: The 10-year Treasury yield increased roughly 50 bps, and the S&P 500 fell 4.8%. Is the downward pressure over? Let’s say the 10-year Treasury plateaus at 5%. That would translate into a price-to-earnings ratio (P/E) of 17.5, based on the long-term historical relationship of P/E to treasury yields. The S&P 500’s P/E only fell to 19.5.
That P/E of 19.5 is, of course, the P/E of the entire S&P 500, but some stocks are more expensive than others. A seductively simple answer could be to invest in the S&P 500 on an equally weighted basis. It’s true that this can bring down valuations, but it might also degrade quality and return on assets could weaken. So, how can we try to prevent that?
The equally weighted S&P 500 Dividend Aristocrats Index could potentially deliver a compelling combination of equal weight and quality. P/E multiples have been nearly on par with the simple equal weighted S&P 500, but with roughly triple the return on assets. Return on assets is the engine that turns earnings into money—and dividends—for shareholders.
Chart of the Month
P/E and Return on Assets of the S&P Dividend Aristocrats vs. the S&P 500
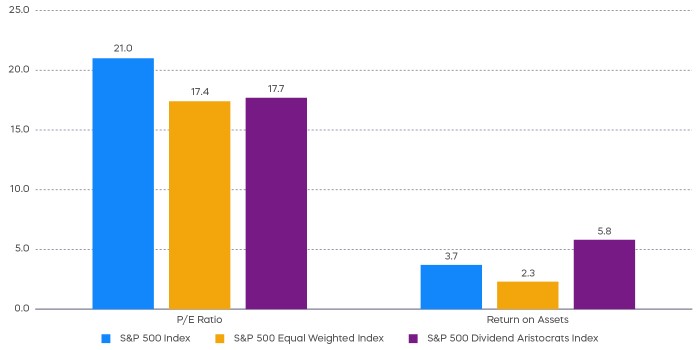
Source: Bloomberg, data as of 9/30/23. The price-to-earnings (P/E) ratio shows how much investors are paying for a dollar of a company's earnings. Return on assets, calculated by dividing a company’s net income by its total assets, is a metric of a company’s profitability. Index returns are for illustrative purposes only and do not reflect any management fees, transaction costs or expenses. Indexes are unmanaged, and one cannot invest directly in an index. Past performance does not guarantee future results.
Performance Recap
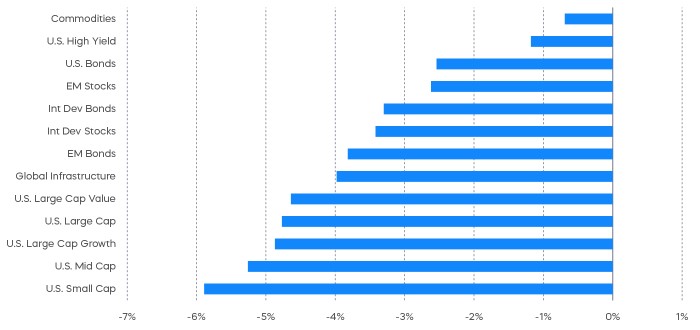
As long-term treasury yields increased, the risk-off sentiment persisted, with growth and small-cap stocks underperforming the most.
Asset Class Returns—September 2023
Asset Class Returns—Year to Date
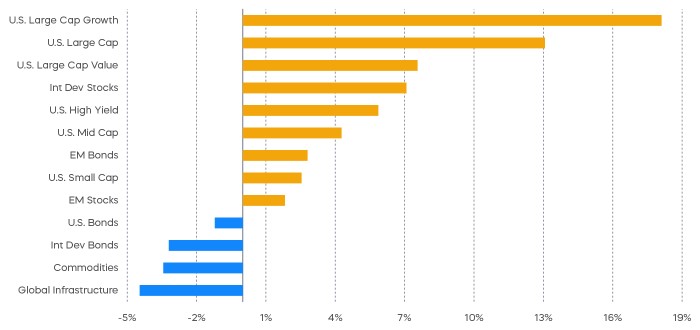
Source: Bloomberg. September returns 9/1/23‒9/30/23; year-to-date returns 1/1/23‒9/30/23. Index returns are for illustrative purposes only and do not reflect any management fees, transaction costs or expenses. Indexes are unmanaged, and one cannot invest directly in an index. Past performance does not guarantee future results.
Economic Calendar
Here’s a list of key and upcoming economic releases, which can serve as a guide to potential market indicators.
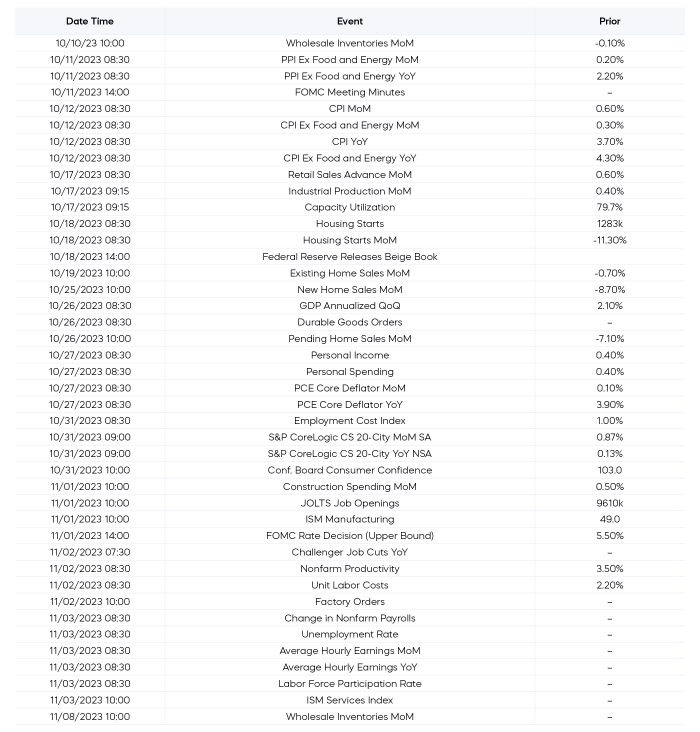
Source: Bloomberg, as of 10/3/23.
Equity Perspectives

Dividend Style Matters
The seemingly unrelenting march higher for Treasury yields worked against risk assets during September, and just about all equity segments and styles reported losses for the month. Ten-year Treasurys broke through 4.50% and rose to levels we haven’t seen in 15 years. This resulted in many investors fleeing equities for the allure of higher yields, as there’s seemingly little risk currently found in ultra-short duration bonds.
While dividend strategies continued to underperform the S&P 500 on a year-to-date basis, it’s a good time to maintain perspective. First, dividend style matters. High dividend yield strategies like the Dow Jones U.S. Select Dividend Index tend to hold more economically sensitive stocks and trade more like a bond proxy, which makes them especially sensitive to rising rates. Dividend growth strategies like the S&P 500 Dividend Aristocrats, however, are total return strategies generating returns from income growth and capital appreciation.
According to Morningstar, the S&P 500 Dividend Aristocrats Index has not only outperformed the S&P 500 (and ultra-short-term bonds) over time, but also has historically outperformed the Dow Jones U.S. Select Dividend Index during rising rate periods. This year is not different, with the Dividend Aristocrats outperforming high dividend yielders by almost 8%.
Valuations as a Potential Buy Signal?
Another key perspective to consider is what this year’s price action has done to valuations. Even using a simple valuation metric like the price-to-earnings ratio (P/E) can serve as a reasonable signal to frame future total return potential, with one big caveat: be patient. In the short term, stock prices tend to be driven by supply and demand, and sentiment. Fundamentals like earnings, cash flows and valuations tend to matter more in the longer term.
S&P 500 Dividend Aristocrats “On Sale”
Relative P/E Ratio of the S&P 500 Dividend Aristocrats vs. the S&P 500
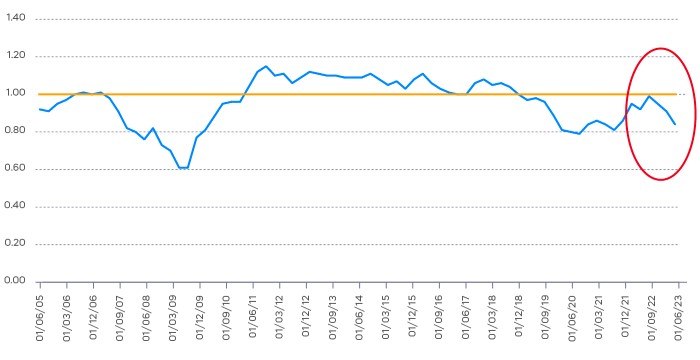
Source: Bloomberg and Standard & Poors, quarterly data 6/30/2005–9/30/2023.
Given that the S&P 500 has advanced over 13% year-to-date through September with falling earnings, while the Dividend Aristocrats have been flat with more stable earnings (Source: Morningstar and FactSet), as the chart above shows, the Aristocrats now trade at roughly 84% of the market’s P/E multiple.
That level of discount is not common, and prior to a few occurrences in 2020–2021, has not been seen in well over a decade. Higher-quality stocks like the S&P 500 Dividend Aristocrats have tended to trade at premium valuations to the market. When they have traded at discounted valuations to the S&P 500, it’s typically proven to be a good time to invest. In fact, any time the Dividend Aristocrats have traded at less than 90% of S&P 500 valuations, forward 3-year and 5-year returns for the Aristocrats have always been positive, and have beaten the S&P 500 in all instances except one (Source: Morningstar and Bloomberg, data from 05/02/05–09/30/23). While there’s not generally a bad time to invest in quality stocks, history may show that now could be a great time to invest in the Dividend Aristocrats.
Fixed Income Perspectives

Long-term Treasury yields continued to rise in September, weighing on fixed income returns. Investment grade credit spreads held steady while high yield spreads widened slightly during the month, propelling the performance of rate-hedged corporate bonds in fixed income.
Fixed Income Returns—September 2023
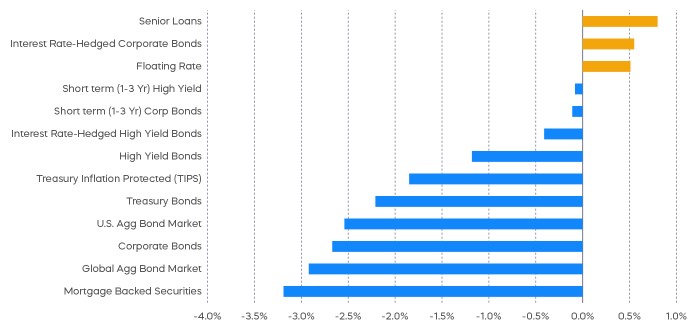
Source: Bloomberg. Data as of 9/30/23.
What’s Moving Markets?
Risk assets pulled back broadly after the September Federal Open Market Committee (FOMC) meeting. Based on the market reaction alone, one could think that the Fed was more hawkish about inflation than the market had expected, since the market typically only responds to news that is not yet priced in. Was that the case?
The Fed’s continued focus on inflation was reflected in the projected median Fed Funds Rate for 2024: Where in June the Fed forecasted a cut of 100 basis points for the next year, they now see a cut of only 50 basis points for 2024. If we look at what the market priced in before each meeting, however, the futures market was implying a cut of 150 basis points prior to the June meeting and a cut of 94 basis points prior to the September meeting. Aside from the fact that the market has favored more rate cuts than the Fed’s projection, between June and September, the market has already anticipated the 50 basis points change in median Fed Funds Rate. This is also consistent with the observation that the 2-year Treasury yield has been trading sideways after the September meeting.
Rate Cut in 2024
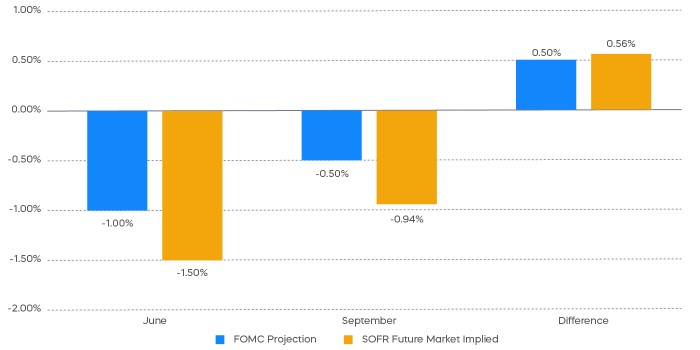
Source: Summary of Economic Projections, Bloomberg, data as of 9/30/23. SOFR is the Secured Overnight Financing Rate, which is a benchmark interest rate that replaced the London Interbank Offered Rate (LIBOR). Futures price at close of trading the day before FOMC.
On the other hand, the increase in the 10-year Treasury yield has gathered speed after the September FOMC. What could really have been upending markets has been the repricing of the term premium, which corresponds to the difference between short-term and long-term interest rates. We discussed this in our
2023 Mid-Year Outlook. Consider the spread between the 3-month T-bill and 30-year Treasury yields. The spread has narrowed significantly after widening to more than -150 bps earlier this year.
Spread between 3-Month and 30-Year Yield
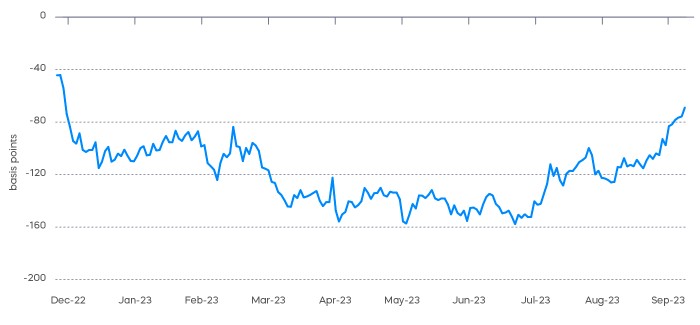
Source: Bloomberg, data as of 9/30/23.
Here’s the takeaway: Movements in long-term yields may decouple from movements in short-term yields. If the Fed holds interest rates at near current levels, we think any change in short-term yields should be limited. However, the past month serves as a reminder that volatility can still be found in long-term yields, as investors grapple with the long-term implications of the debt cycle.
Sources for data and statistics: Bloomberg, FactSet, Morningstar, and ProShares.
The different market segments represented in the performance recap charts use the following indexes: U.S. Large Cap: S&P 500 TR; U.S. Large Cap Growth: S&P 500 Growth TR; U.S. Large Cap Value: S&P 500 Value TR; U.S. Mid Cap: S&P Mid Cap TR; U.S. Small Cap: Russell 2000 TR; International Developed Stocks: MSCI Daily TR NET EAFE; Emerging Markets Stocks: MSCI Daily TR Net Emerging Markets; Global Infrastructure: Dow Jones Brookfield Global Infrastructure Composite; Commodities: Bloomberg Commodity TR; U.S. Bonds: Bloomberg U.S. Aggregate; U.S. High Yield: Bloomberg Corporate High Yield; International Developed Bonds: Bloomberg Global Agg ex-USD; Emerging Market Bonds: DBIQ Emerging Markets USD Liquid Balanced.
The S&P 500 is a benchmark index published by Standard & Poor's (S&P) representing 500 companies with large-cap market capitalizations. The S&P 500 Dividend Aristocrats Index targets companies that are currently members of the S&P 500 that have increased dividend payments each year for at least 25 years. The Dow Jones U.S. Select Dividend Index aims to represent the U.S.'s leading stocks by dividend yield. THESE ENTITIES AND THEIR AFFILIATES MAKE NO WARRANTIES AND BEAR NO LIABILITY WITH RESPECT TO PROSHARES.
This is not intended to be investment advice. Indexes are unmanaged, and one cannot invest directly in an index. Past performance does not guarantee future results.
Any forward-looking statements herein are based on expectations of ProShare Advisors LLC at this time. Whether or not actual results and developments will conform to ProShare Advisors LLC’s expectations and predictions, however, is subject to a number of risks and uncertainties, including general economic, market and business conditions; changes in laws or regulations or other actions made by governmental authorities or regulatory bodies; and other world economic and political developments. ProShare Advisors LLC undertakes no duty to update or revise any forward-looking statements, whether as a result of new information, future events or otherwise.
Investing involves risk, including the possible loss of principal. This information is not meant to be investment advice.
The “S&P 500®” and “S&P 500® Dividend Aristocrats® Index” are products of S&P Dow Jones Indices LLC and its affiliates and have been licensed for use by ProShare Advisors LLC. "S&P®" is a registered trademark of Standard & Poor’s Financial Services LLC (“S&P”), and “Dow Jones®" is a registered trademark of Dow Jones Trademark Holdings LLC (“Dow Jones”) and they have been licensed for use by S&P Dow Jones Indices LLC and its affiliates. ProShares ETFs based on these indexes are not sponsored, endorsed, sold or promoted by these entities or their affiliates, and they make no representation regarding the advisability of investing in ProShares ETFs. THESE ENTITIES AND THEIR AFFILIATES MAKE NO WARRANTIES AND BEAR NO LIABILITY WITH RESPECT TO PROSHARES.