Key Observations

July was full of good economic news:
- Inflation continued to decline and the economy held up quite nicely. CPI was 3.0% year-over-year and PPI Final Demand came in at 0.1%.[1] Skeptics point to the “upside-down” higher readings ex-food and energy after last year’s energy and eggs price spikes, but it would be a stretch to assert that inflation isn’t heading in the right direction.
- One-year breakeven inflation stands at an extremely benign 1.55% (according to Bloomberg, as of 7/31/23).
- Meanwhile, consumers seem to be feeling good, with the Conference Board’s Consumer Confidence reading coming in at a very strong 117 last month.
- All of this news was punctuated by surprisingly strong second quarter GDP growth of 2.4%.
Stocks rallied, as previous calls for a soft landing morphed into calls for “no-landing.” There is, however, reason to rein in the enthusiasm a bit.
Chart of the Month
Price-to-Earnings Multiples Have Increased in 2023
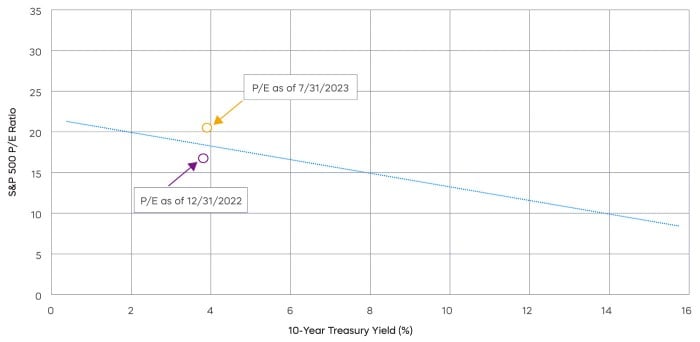
Source: Bloomberg, quarterly data from 12/31/62‒7/31/23. The price-to-earnings (P/E) ratio shows how much investors are paying for a dollar of a company's earnings. Past performance does not guarantee future results. Indexes are unmanaged, and one cannot invest directly in an index.
There were two key drivers for the rally we saw in July, only one of which may hold up:
- A stronger economy—one that avoids a hard landing, or any landing—will drive stronger corporate earnings. That seems fair.
- Falling inflation accelerates the path to Federal Reserve interest rate cuts driving P/E multiple expansions. This is where caution is warranted.
It is true that lower interest rates support higher P/E multiples, but which interest rates? P/E multiples are driven by longer-term interest rates much more than short-term interest rates.
Fed cuts are likely to bring shorter-term interest rates down—think 2-Year Treasury rates. But the 10-Year Treasury rate is more likely to remain stable or even drift modestly higher even as short-term rates fall. 10-year breakeven inflation stands at 2.3% (according to Bloomberg, as of 7/31/23). The long-term average real rate on the 10-year Treasury is about 2%, implying a 4.3% 10-Year yield. Perhaps on cue, July’s strong economic data pushed the 10-year yield above 4%. At 21X, the P/E of the S&P 500 is now higher than that implied by that historical relationship. That’s the bad news. The good news, however, is that 2023’s narrowly driven rally has left many stocks trading at more modest multiples.
Performance Recap
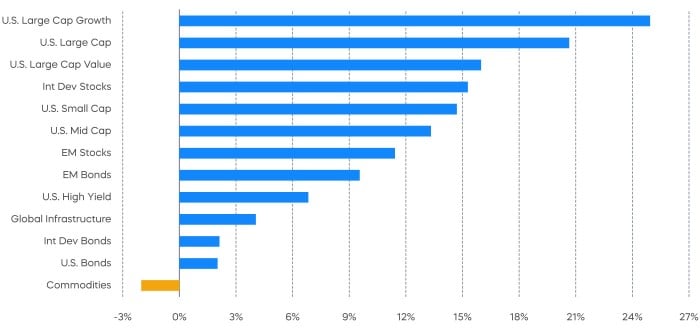
Since economic data surprised to the upside, markets rallied across the board, especially in commodities given the depressed price levels this year.
Asset Class Returns—July 2023
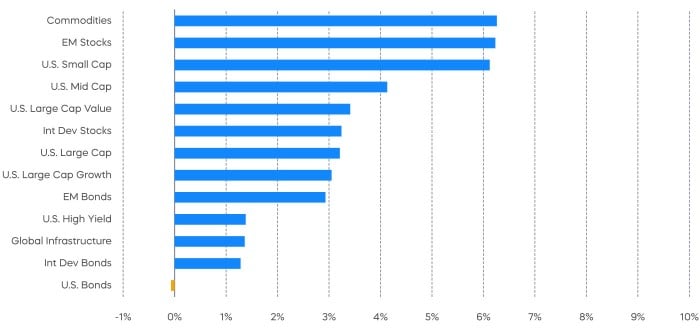
Asset Class Returns—Year to Date
Source: Bloomberg. July returns 7/1/23‒7/31/23; year-to-date returns 1/1/23‒7/31/23. Index returns are for illustrative purposes only and do not reflect any management fees, transaction costs or expenses. Indexes are unmanaged, and one cannot invest directly in an index. Past performance does not guarantee future results.
Economic Calendar
Here’s a list of key and upcoming economic releases, which can serve as a guide to potential market indicators.
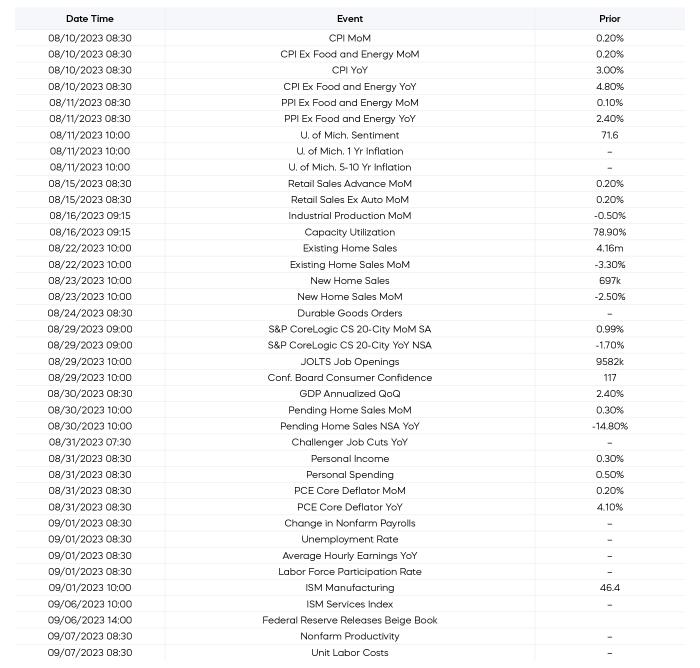
Source: Bloomberg, as of 8/1/23
Equity Perspectives
Where Did the Volatility Go?
Equity markets delivered robust performance in July, and notably, it came from segments other than just mega-cap technology stocks. After lagging badly all year, the S&P MidCap 400 and the S&P Small Cap 600 each rallied over 4% in July and outperformed the large caps of the S&P 500.
The narrowness of the rally in 2023 has been a dominant theme, and one that bulls were hoping would widen to sustain the market’s momentum—wish granted. It seems like the farther we get from last October’s market bottom, the less likely we are to re-test those lows.
Another data point we’ve been watching is the volatility of major market indexes. It is surprisingly low, given some of the caution flags that the economy and markets are waving. According to Standard & Poor’s, July’s annualized realized volatility for the S&P 500 was 8%, significantly below its 10-year average of 14.5%. Implied volatility, as measured by the VIX,
[2] is also well below its longer-term average.
Three Reasons for Dividend Growth Now
With the Fed intent on slowing the economy, stretched valuations, and corporate earnings contracting, investors looking to lean into this equity rally should be choosy. One way to play a bit of defense is to stick with high-quality companies that produce robust cash flows and that are trading at reasonable valuations. Below, we list three key reasons to consider a dividend growth strategy for the remainder of the year.
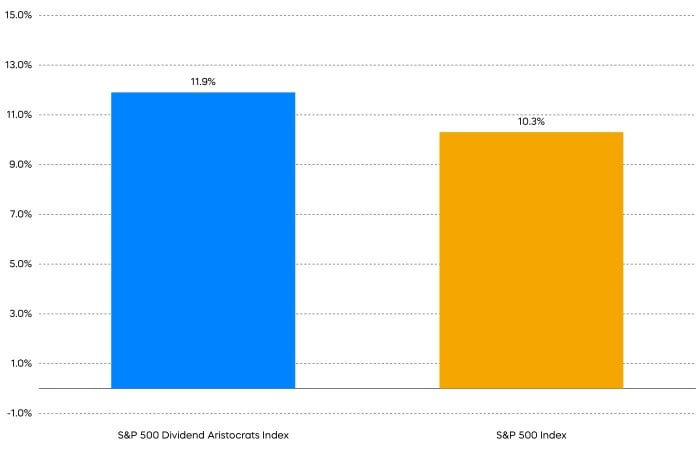
- A History of All-Weather Performance
Despite calmer waters of late, the past two years have witnessed two distinct periods of strong market performance and an extended market drawdown in 2022. Such episodic periods present a challenge for asset allocation, and strategies that can both participate and defend have proven useful for investors. The S&P 500 Dividend Aristocrats have historically delivered most of the S&P 500 gains, with less of its losses, and the last two years have been no different.
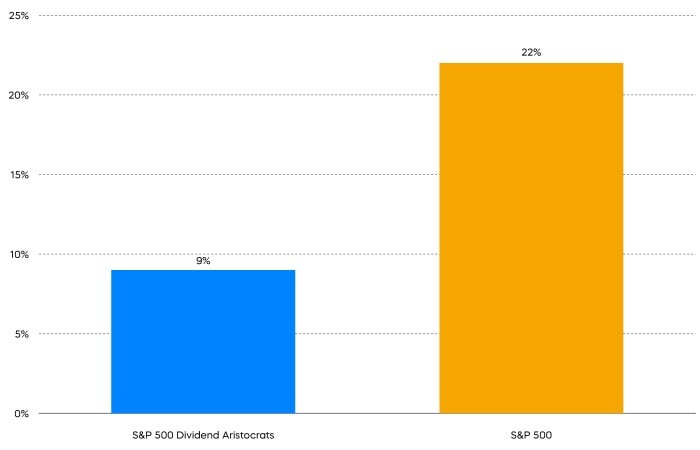
Two-Year Cumulative Returns
S&P 500 Dividend Aristocrats Index vs S&P 500
Two-Year Returns Volatility
S&P 500 Dividend Aristocrats Index vs S&P 500
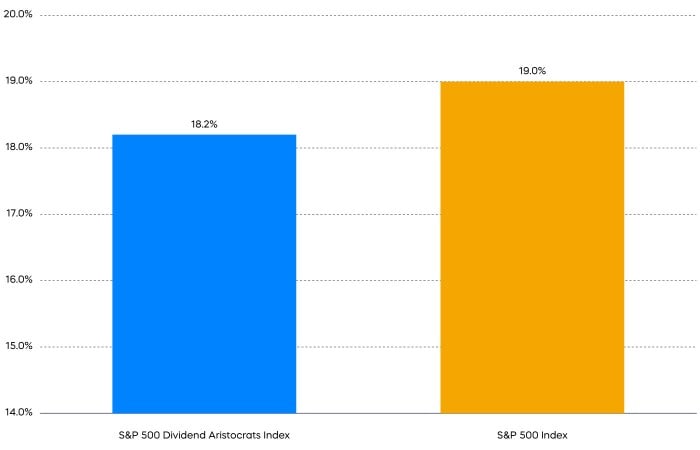
Source: Morningstar, data as of 7/31/23. Index returns are for illustrative purposes only and do not reflect any management fees, transaction costs or expenses. Indexes are unmanaged, and one cannot invest directly in an index. Past performance does not guarantee future results.
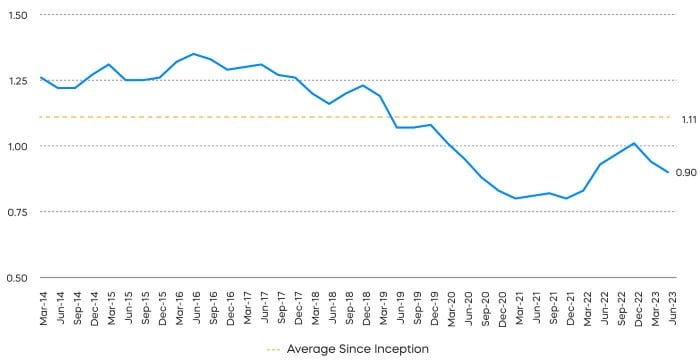
2. The S&P 500 Dividend Aristocrats Are “on Sale”
Higher-quality strategies like investing in the S&P 500 Dividend Aristocrats typically demand a premium valuation. Historically the Dividend Aristocrats have traded at a roughly 11% premium relative to the S&P 500. However, the narrow, tech-driven rally during the first half of 2023 has left the S&P 500 Dividend Aristocrats trading at a roughly 20% discount to its average relative valuation, as measured by price-to-book ratio.
Relative Price-to-Book Ratio of the
S&P 500 Dividend Aristocrats versus the S&P 500
Source: Bloomberg. Data as of June 30, 2023. The Price-to-Book Ratio compares a firm's market capitalization to its book value, and it can be used to help identify potentially undervalued companies.
3. A Key Time for Equal Weight
Recent outsized performance from the largest stocks by market capitalization has some concerned that the S&P 500 is too top heavy. The weight of the top-five stocks of the S&P 500 through July is now 23%, the highest level since 1980, according to Standard & Poor’s. Conversely, the smallest 250 of the 500 stocks represent only 11% of the value of the S&P 500, and thus have minimal impact on performance. This concentration can pose a challenge to diversification and risk management, leaving the index overly dependent on just a few names and vulnerable to a significant downturn from one or several of its top-weighted stocks.
An equally weighted approach like the S&P 500 Dividend Aristocrats Index uses offers an alternative. With 66 names, the top five holdings represent less than 10% of the index. Each one of the 66 stocks in the Dividend Aristocrats has the potential to contribute its fair share to performance.
Top Five Stock Weightings Through July 2023
S&P 500 Stock Weightings Through July 2023
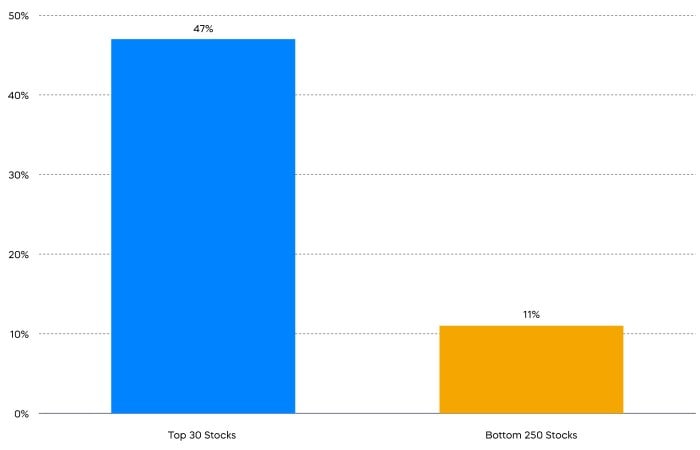
Source: FactSet, data as of 7/31/23.
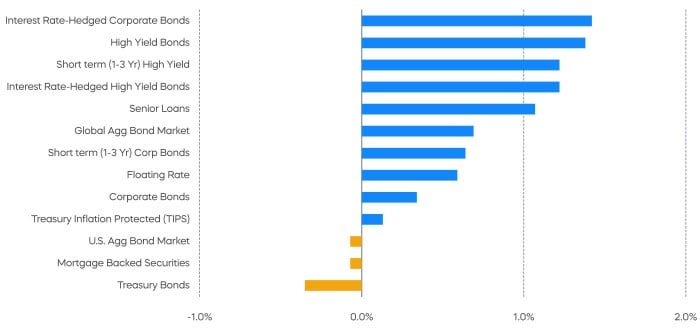
Fixed Income Perspectives

Interest rates increased during the month of July, making Treasury bonds the worst performers and interest rate hedged bonds top performers.
Source: Bloomberg. Data as of 7/31/23.
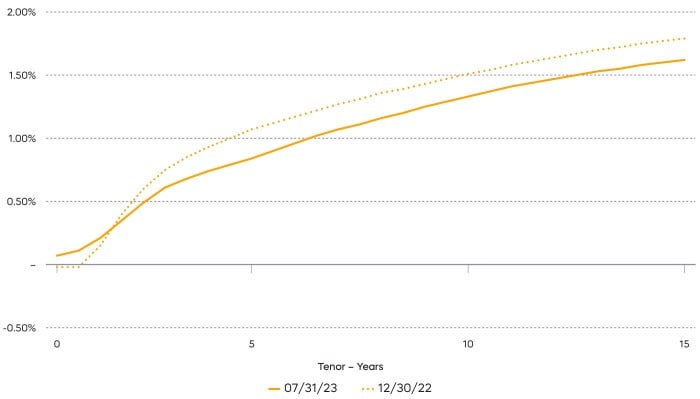
Build Income for Goldilocks
With the economy surprising to the upside, and markets seeming to price out a recession altogether, it is becoming increasingly difficult to invest for price returns. Prices today already reflect a positive outlook. Fortunately for long-term investors, a bond portfolio’s yield is typically a great predictor of the holding period total return, because the interest income from bonds can be a significant component of total return. With a slowing Federal Reserve and resilient economy, a sideways market can be a goldilocks environment for simply earning yield from bonds.
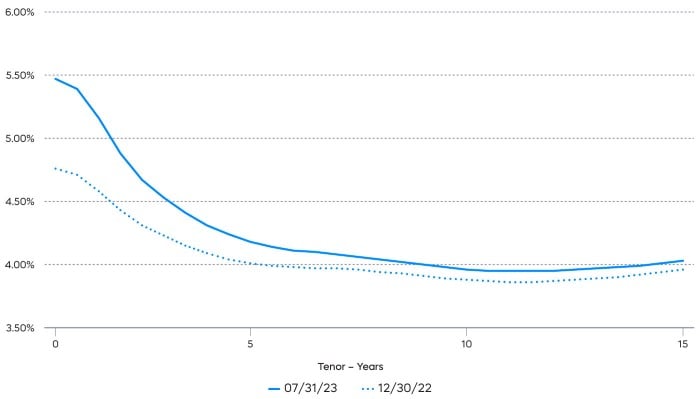
Treasury Actives Yield Curve
U.S. Corporate A+, A, and A- Z-Spread
Source: Bloomberg, data as of 7/31/23.
In our Mid-Year Outlook, we discussed the relative value of investment grade versus high yield. But in our 2023 Outlook from January, we identified another important phenomenon for investors building income—the Treasury yield curve is downward sloping, while the corporate bond spread curve is upward sloping.
Compared to where we started the year, Treasury yields have increased while credit spreads have tightened slightly. But it’s remarkable to see that the shape of these two curves has stayed the same. If yield curve and credit spreads were to hold steady, which may be the case in a goldilocks environment, the combination of short-term interest rates and long-term credit spreads could continue generating higher income.
Sources for data and statistics: Bloomberg, FactSet, Morningstar, and ProShares.
[1] The Consumer Prive Index (“CPI”) is a measure of the average change over time in the prices paid by urban consumers for a market basket of consumer goods and services. The Producer Price Index for Final Demand (“PPI Final Demand”) measures the average change in prices received by domestic producers of goods, services, and construction sold for personal consumption, capital investment, government, and export.
[2] The CBOE Volatility Index, or VIX, is an index that represents the market’s expectations for volatility over the next 30 days. Some investors use the VIX as a gauge of the level of potential risk or fear in the market.
The different market segments represented in the performance recap charts use the following indexes: U.S. Large Cap: S&P 500 TR; U.S. Large Cap Growth: S&P 500 Growth TR; U.S. Large Cap Value: S&P 500 Value TR; U.S. Mid Cap: S&P Mid Cap TR; U.S. Small Cap: Russell 2000 TR; International Developed Stocks: MSCI Daily TR NET EAFE; Emerging Markets Stocks: MSCI Daily TR Net Emerging Markets; Global Infrastructure: Dow Jones Brookfield Global Infrastructure Composite; Commodities: Bloomberg Commodity TR; U.S. Bonds: Bloomberg U.S. Aggregate; U.S. High Yield: Bloomberg Corporate High Yield; International Developed Bonds: Bloomberg Global Agg ex-USD; Emerging Market Bonds: DBIQ Emerging Markets USD Liquid Balanced.
The S&P 500 is a benchmark index published by Standard & Poor's (S&P) representing 500 companies with large-cap market capitalizations. The S&P 500 Dividend Aristocrats Index targets companies that are currently members of the S&P 500 that have increased dividend payments each year for at least 25 years. THESE ENTITIES AND THEIR AFFILIATES MAKE NO WARRANTIES AND BEAR NO LIABILITY WITH RESPECT TO PROSHARES.
This is not intended to be investment advice. Indexes are unmanaged, and one cannot invest directly in an index. Past performance does not guarantee future results.
Any forward-looking statements herein are based on expectations of ProShare Advisors LLC at this time. Whether or not actual results and developments will conform to ProShare Advisors LLC’s expectations and predictions, however, is subject to a number of risks and uncertainties, including general economic, market and business conditions; changes in laws or regulations or other actions made by governmental authorities or regulatory bodies; and other world economic and political developments. ProShare Advisors LLC undertakes no duty to update or revise any forward-looking statements, whether as a result of new information, future events or otherwise.
Investing involves risk, including the possible loss of principal. This information is not meant to be investment advice.
The “S&P 500®” and “S&P 500® Dividend Aristocrats® Index” are products of S&P Dow Jones Indices LLC and its affiliates and have been licensed for use by ProShare Advisors LLC. "S&P®" is a registered trademark of Standard & Poor’s Financial Services LLC (“S&P”), and “Dow Jones®" is a registered trademark of Dow Jones Trademark Holdings LLC (“Dow Jones”) and they have been licensed for use by S&P Dow Jones Indices LLC and its affiliates. ProShares ETFs based on these indexes are not sponsored, endorsed, sold or promoted by these entities or their affiliates, and they make no representation regarding the advisability of investing in ProShares ETFs. THESE ENTITIES AND THEIR AFFILIATES MAKE NO WARRANTIES AND BEAR NO LIABILITY WITH RESPECT TO PROSHARES.