Key Observations

Inflation Outlook - Good
As the second half of 2023 unfolds – here’s the good news: Inflation looks increasingly under control. Tight monetary policy combined with a little help from challenges in the banking sector have brought down inflation expectations substantially.
One-Year Breakeven Inflation
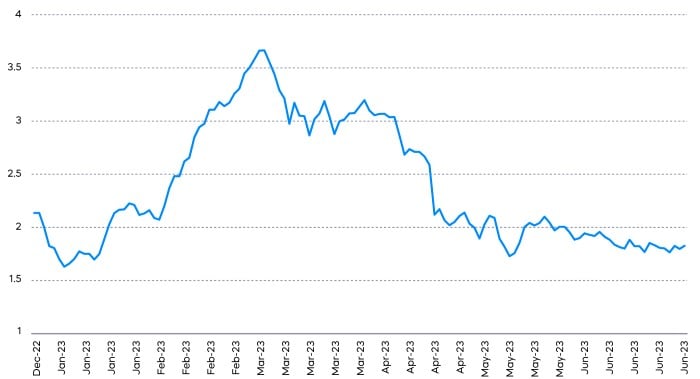
One-year breakeven inflation fell from an early-year peak of over 3.5% to 1.8% at the end of June. That’s below the Fed’s target of 2%. Of course, some of this decline is simply the rolling forward of expectations over time. One-year expectations back in February pointed to inflation in February of 2024 – which could still come in at approximately 3%, on the way to around 2% mid-2024. Still, since expectations are a key driver of realized inflation, it’s unambiguously a good sign to see expected inflation below 2% just a year from now.
A key reason for the Fed’s ability to pause interest rate hikes without derailing this progress is that real interest rates have risen notably this year. Reduced inflation expectations means that even a static Fed Funds rate has increased in real terms. Now that nominal shorter term treasury rates have risen further, real rates are materially higher. It’s a powerful virtuous cycle for bringing down inflation, but it’s also a driver of reduced economic growth.
Economic Outlook – Meh
Notwithstanding the recent upward revision to Q1 GDP from 1.3% to 2%, there are plenty of signs of a cooling economy:
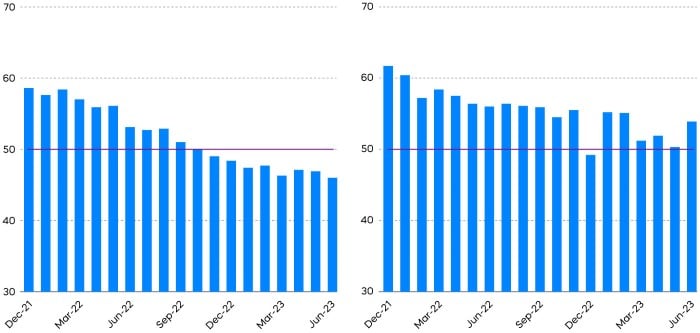
The manufacturing sector has been weak for quite some time. The ISM Manufacturing survey fell below the key 50 level in late 2022 – with readings above 50 indicating economic expansion and readings below indicating contraction. The ISM Services survey has held up better but is still substantially below the levels seen in 2022. Still, we are not in the camp of forecasting a hard landing for the economy, we’ll go with “Meh”. Here are some positive signals:
- 339k positive change in nonfarm payrolls in the most recent report.
- The latest retail sales report surprised with a .3% month-over-month increase.
- The most recent conference board consumer confidence reading of 109.7 – a notable upside surprise.
Bloomberg reports a consensus estimate for US real GDP growth of 1.3% for 2023 and .7% for 2024. That’s sounds quite fair to us. But it’s important to point out that in practical terms whether GDP growth comes in at a positive 1% or slips to a negative 1% likely makes little difference to the equity markets.
It’s All About Earnings
A meh economy suggests a meh environment for stocks, but let’s be more specific. With all the volatility around shorter-term real and nominal interest rates so far this year, the long end of the curve has been remarkably stable. The 10-year bond began this year with a yield of 3.88% with ten-year breakeven inflation at 2.29 percent. The end of June found those numbers at 3.83% and 2.23%, respectively. Stability of longer-term interest rates, and GDP growth likely not too far from either side of zero suggests that P/E (price-to-earnings) multiples are likely to remain range bound. That leaves earnings as the key driver of near-term stock prices. The story is not a great one.
Earnings growth has slipped into negative territory in the last two quarters. Consensus forecasts have followed suit – now pointing to a drop in earnings of a bit over 1%, year-over-year for 2023. Here’s a bit of a surprise. Tech sector earnings have not been immune to this trend. You might think that for a P/E of 30X – the current P/E of the S&P 500 tech sector - you’d be getting some earnings growth – but not so much. Meanwhile dividend growth stocks as tracked by the S&P 500 Dividend Aristocrats, are trading at a P/E of 18X and have delivered positive earnings growth in both of those last two quarters.
Finally, for those looking for diversification opportunities, in the face of crypto exchange challenges, crypto-related bank challenges, regulatory challenges, and tight monetary policy, bitcoin has risen 88% this year, but is still quite a way below its 2021 highs.
Performance Recap
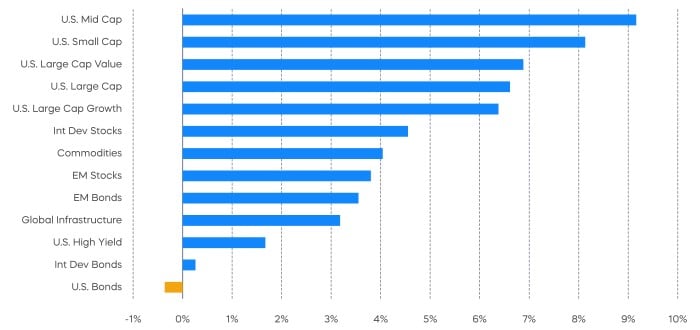
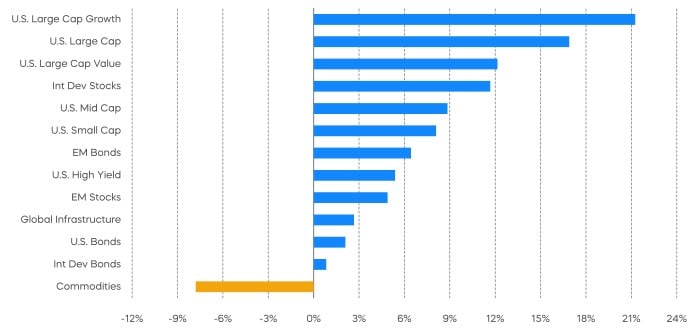
Green dominated in June, though, for a change, US large cap growth was not at the top of the charts.
Asset Class Returns - June 2023
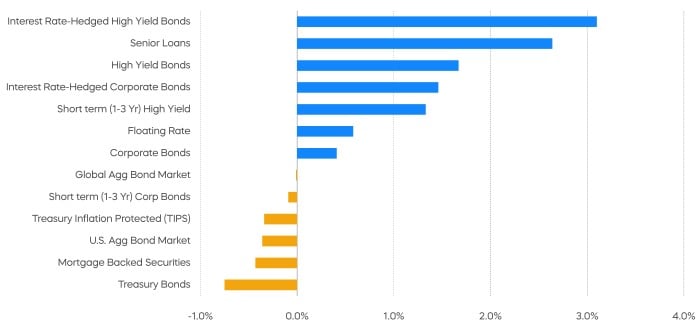
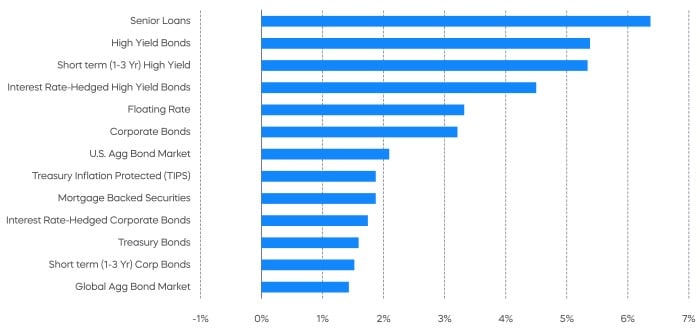
Asset Class Returns - YTD
Economic Calendar

Equity Perspectives

Equity investors are feeling more optimistic at the half-way point of 2023 than they have in some time. We know this because investor sentiment readings have been rapidly improving. The American Association of Individual Investors Investor Sentiment Survey reports that 46% of its members feel the market will be bullish over the next six months. This is markedly higher than the historical bullish average of 38%, and only 26% at the start of the year. The pickup in optimism is understandable – most equity segments have delivered positive performance this year. In fact, June was the S&P 500’s strongest month of the year, and even small and mid-cap stocks joined the rally after missing most of the mega-cap led gains earlier in the year. Equity volatility levels remain below their historical averages. While we don’t aim to dampen the mood, we note that the decidedly mixed economic outlook and the contrarian nature of sentiment readings require a mild helping of caution to the optimistic tone. We offer the following perspectives for the remainder of the year.
Favor Dividend Growth over High Dividend Yield
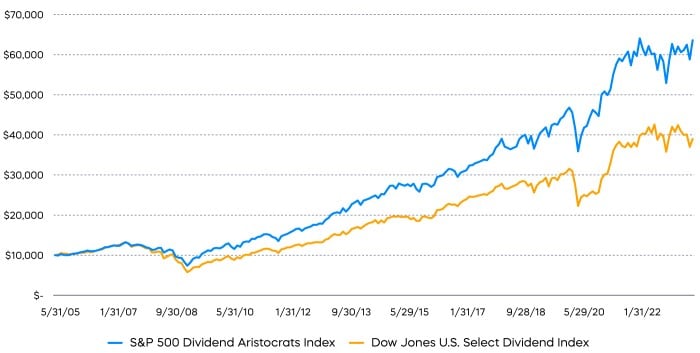
Many strategists came into 2023 thinking defensive oriented dividend strategies would be best positioned to withstand a shaky equity outlook. With corporate earnings slowing and the potential for a hard landing, stocks that pay dividends have historically cushioned some of the blow. Dividend strategies outperformed the broader market in 2022. But as we often say, not all dividend strategies are created equal. It’s a simple mantra, but bears repeating; dividend growth strategies often have materially different performance and risk profiles than high dividend yielding strategies. Through June, the S&P 500 Dividend Aristocrats Index has returned 5.9% in 2023 while the Dow Jones U.S. Select Dividend Index returned -4.3%. This pattern of outperformance has also been evident over time. Some of the return differential can be attributed to differences in sector exposure. High dividend yielding strategies for example have tended to be heavily exposed to stocks from the utilities, financials, and energy sectors which have all significantly underperformed the market this year. But quality is also a significant factor. High yielding stocks have tended to be lower quality than those that grow dividends. They typically have had higher debt levels and dividend payout ratios meaning they have less financial flexibility when the economy slows. Higher yielding stocks may therefore be vulnerable to dividend cuts. Look for this trend to potentially continue as the Fed continues to slowdown the economy with more potential rate hikes.
Dividend Growth Has Outperformed High Dividend Yield
Dividend Growth Has Demonstrated Earnings Resiliency
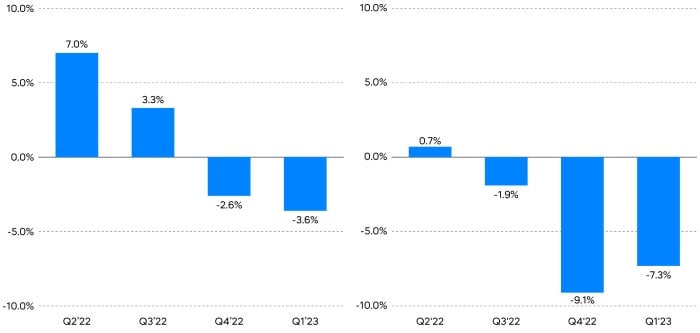
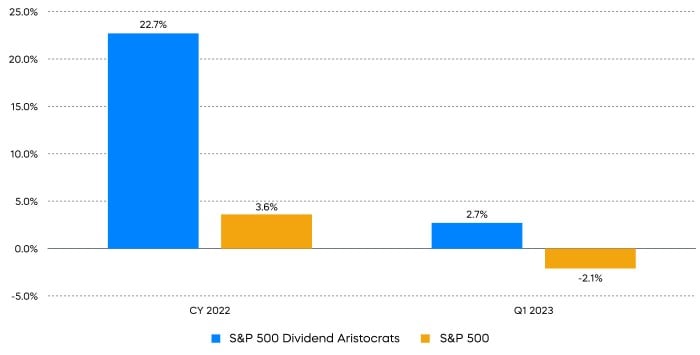
Another hallmark of a quality company is their ability to deliver more stable earnings. As we noted in the front section, corporate earnings growth has been slowing and turned negative for both Q4 of 2022 and Q1 of 2023. Q2 2023 earnings are also forecast to be negative. Investors seem comfortable with looking beyond the recent earnings declines to more optimistic forecasts in 2024. That may be fine if we avoid the hard landing scenario, but the extent of the economic slowdown on corporate earnings remains unclear. With earnings expected to remain front-and-center as a potential market catalyst, it may be wise to focus on strategies that have been delivering resilient earnings. The S&P 500 Dividend Aristocrats have historically delivered more stable earnings growth than the broad market, and that has been on display of late.
Aristocrats Delivered More Resilient Earnings Growth
Be Selective with Technology Exposure
The dominance of technology stocks thus far shouldn’t be surprising. With economic growth clearly slowing investors are putting premiums on market segments that are expected to deliver attractive growth profiles. Meanwhile, tech stocks offer the highest estimated revenue growth of any sector for calendar year 2024. However, trailing 12-month price-to-earnings multiples for tech stocks have climbed steadily higher since the beginning of the year. They now stand at a lofty 33x earnings, meaningfully higher than the 10-year average multiple of 24x.
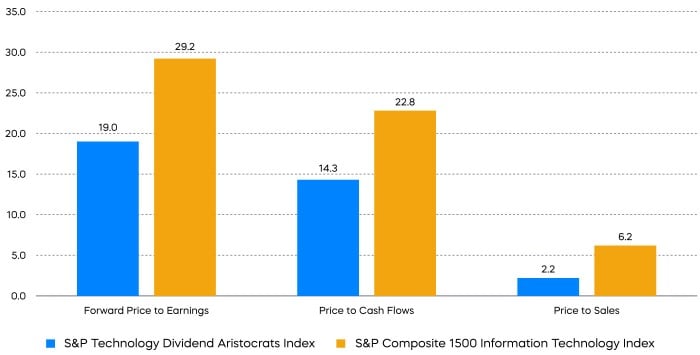
There are alternatives to cap-weighted technology strategies. The equal-weighted S&P Technology Dividend Aristocrats Index is a collection of technology related stocks that have grown their dividend for at least seven consecutive years. These well-established tech names have tended to offer a rare combination: robust growth at reasonable valuations.
Technology Aristocrats: Growth at a Reasonable Price
Fixed Income Perspectives

Having raised interest rates by 5 percent and committing to further actions until inflation reaches its target, the Fed has made substantial progress towards slowing inflation. Nearly a year and half into the Fed’s hiking cycle to contain inflation, the question for fixed income investors is this: will interest rate return to pre-pandemic levels once inflation subsides, or will it settle into a more normal environment?
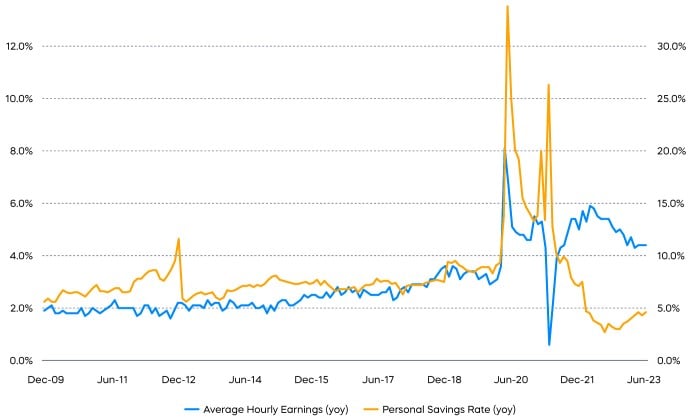
Given the speed and the magnitude of the tightening, both headline and core inflation are trending lower. More importantly, inflation expectations have once again become anchored. Yet, the Fed is forecasting that inflation won’t return to its 2% target prior to the end of 2024. The service sector has been particularly resilient, supported by wage growth above pre-pandemic levels and a personal savings rate below the pre-pandemic level.
Consumption Remains Strong
In contrast, some interest rate sensitive areas of the economy have been put under stress. The sharp rise in interest rates have changed the depositors’ behavior, and as a result small regional banks are losing their cheap source of funding. While regional banks have largely been able to stabilize their fundings since the bank failures earlier in the year, they have had to resort to borrowing with higher costs through FHLB and brokered deposits. A further increase in interest rates may prove to be exponentially more painful.
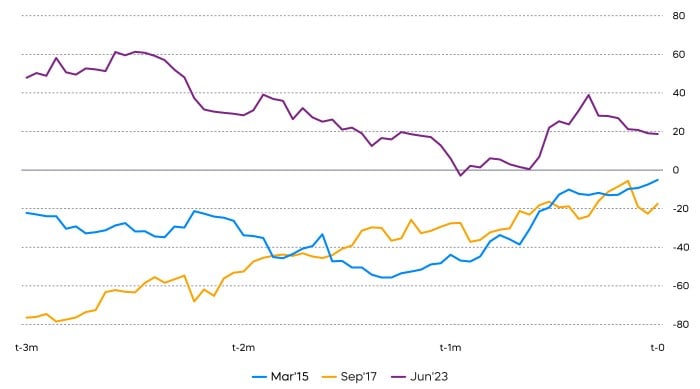
It's worth noting that a “skip” has been highly unusual in recent history. Since the Fed adopted open and transparent communication in the 90s, the Fed has preferred sticking to a planned course of rate hikes, unless incoming economic data strongly hint at cause for concern. In the ’15 to ’18 hiking cycle, economic data surprised to the downside leading up to the decision to pause mid-cycle, while the Fed raised rates consecutively without exception in the ’04 to ’06 cycle. The recent “skip” amid positive economic surprises may reflect caution from the policy makers given how much tightening has already occurred.
Citi Economic Surprise Index (months leading up to pause)
One useful framework to analyze the level of long-term interest rates is decomposing it into path of real short-term interest rates, expected inflation, and term premium. Term premium accounts for the excess yield investors demand for holding a longer-term bond, which has usually been a positive amount. Investors may demand more compensation when there are high inflation expectations, uncertainties about the level of interest rates, or if there is a supply demand imbalance.
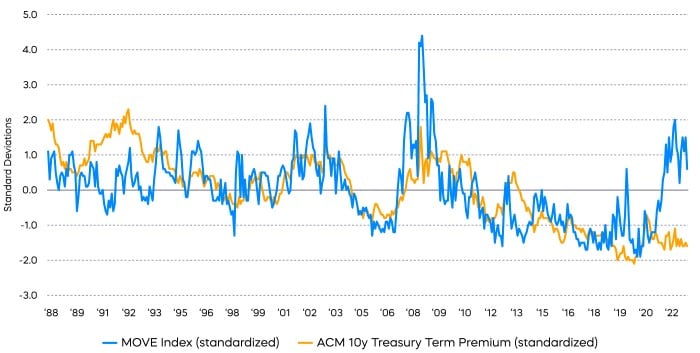
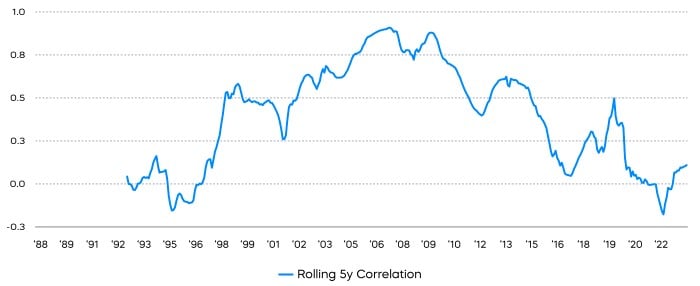
For instance, the Fed’s ACM Term Premium for 10-year treasury has historically shown a strong correlation with the MOVE Index, which tracks market-implied interest rate volatility. Higher implied volatility or more uncertainty has corresponded to a higher level of term premium. Recently, however, the relationship has diverged. This indicates that an environment of higher interest rate volatility is not yet priced into the level of long-term bond yields.
Term Premium & Rate Volatility Diverge
Part of this story is that low inflation expectations have already been priced in, as long-term breakeven inflation has been anchored throughout the post-pandemic inflationary period. Still, quantitative easing clearly suppressed the term premium. If we return to a more normal interest rate environment, term premium may also normalize, leading long-term interest rates higher.
The primary implication for fixed income portfolios is to shorten duration1 while awaiting more policy directions later in the year. Lowering duration, whether through shorter maturities or interest rate hedges, also benefits from an inverted yield curve. Since short-term interest rates have become higher than long-term interest rates recently, investors will be compensated with more income for taking less interest rate risks. Although short-term interest rates will inevitably stop rising or begin falling towards the end of the hiking cycle, there is currently ample cushion to stay invested in the short-term: the 3-month and 10-year treasury yield gap stood at -148 basis points at the end of June.
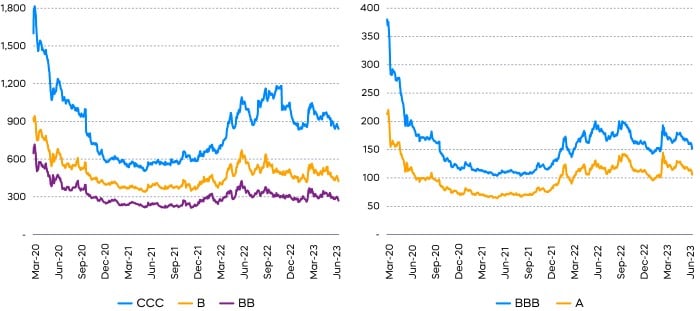
Adding high quality credit risk can further enhance yield in a prudent manner. Looking at the high yield space, the CCC-rated spreads are quite wide and reflect concerns for a potential recession, since there is substantial default risk in CCC-rated securities. However, B and BB denominated bonds, which make up most of the high yield universe, have retraced most of their selloffs in 2022. Compared to the tightest spread levels in 2021, BB spreads widened 57 basis points from a low of 213 basis points. Meanwhile, A-rated bond spreads widened 42 basis points from a low of just 64 basis points. That’s a notably larger relative move for investment grade bonds whose spreads typically move in a much tighter band than high yield which presents investment grade bonds as a potentially attractive choice as we enter the second half of 2023.
Fixed Income Performance Recap
The different market segments represented in the performance recap charts use the following indexes: U.S. Large Cap: S&P 500 TR; U.S. Large Cap Growth: S&P 500 Growth TR; U.S. Large Cap Value: S&P 500 Value TR; U.S. Mid Cap: S&P Mid Cap TR; U.S. Small Cap: Russell 2000 TR; International Developed Stocks: MSCI Daily TR NET EAFE; Emerging Markets Stocks: MSCI Daily TR Net Emerging Markets; Global Infrastructure: Dow Jones Brookfield Global Infrastructure Composite; Commodities: Bloomberg Commodity TR; U.S. Bonds: Bloomberg U.S. Aggregate; U.S. High Yield: Bloomberg Corporate High Yield; International Developed Bonds: Bloomberg Global Agg ex-USD; Emerging Market Bonds: DBIQ Emerging Markets USD Liquid Balanced.
The S&P 500 is a benchmark index published by Standard & Poor's (S&P) representing 500 companies with large-cap market capitalizations. The S&P 500 Dividend Aristocrats Index targets companies that are currently members of the S&P 500 that have increased dividend payments each year for at least 25 years. The Dow Jones U.S. Select Dividend Index is designed to represent the U.S.’s leading stocks by dividend yield. The S&P Composite 1500® Information Technology comprises those companies included in the S&P Composite 1500 that are classified as members of the GICS® Information Technology sector. THESE ENTITIES AND THEIR AFFILIATES MAKE NO WARRANTIES AND BEAR NO LIABILITY WITH RESPECT TO PROSHARES.
This is not intended to be investment advice. Indexes are unmanaged, and one cannot invest directly in an index. Past performance does not guarantee future results.
Any forward-looking statements herein are based on expectations of ProShare Advisors LLC at this time. Whether or not actual results and developments will conform to ProShare Advisors LLC’s expectations and predictions, however, is subject to a number of risks and uncertainties, including general economic, market and business conditions; changes in laws or regulations or other actions made by governmental authorities or regulatory bodies; and other world economic and political developments. ProShare Advisors LLC undertakes no duty to update or revise any forward-looking statements, whether as a result of new information, future events or otherwise.
Investing involves risk, including the possible loss of principal. This information is not meant to be investment advice.
The “S&P 500®” and “S&P 500® Dividend Aristocrats® Index” are products of S&P Dow Jones Indices LLC and its affiliates and have been licensed for use by ProShare Advisors LLC. "S&P®" is a registered trademark of Standard & Poor’s Financial Services LLC (“S&P”), and “Dow Jones®" is a registered trademark of Dow Jones Trademark Holdings LLC (“Dow Jones”) and they have been licensed for use by S&P Dow Jones Indices LLC and its affiliates. ProShares ETFs based on these indexes are not sponsored, endorsed, sold or promoted by these entities or their affiliates, and they make no representation regarding the advisability of investing in ProShares ETFs. THESE ENTITIES AND THEIR AFFILIATES MAKE NO WARRANTIES AND BEAR NO LIABILITY WITH RESPECT TO PROSHARES.