Key Observations

Back in March, it seemed clear to many observers that interest rates were going to keep falling. The banking “thing” kicked-off and a recession seemed imminent. Two months later, those banking issues seem to have been more like sector-specific headwinds. Two-year Treasury yields have recovered nearly half of their decline, and yields have risen across the Treasury curve.
Chart of the Month
Two-Month Change in Treasury Yields
3/31/23–5/31/23
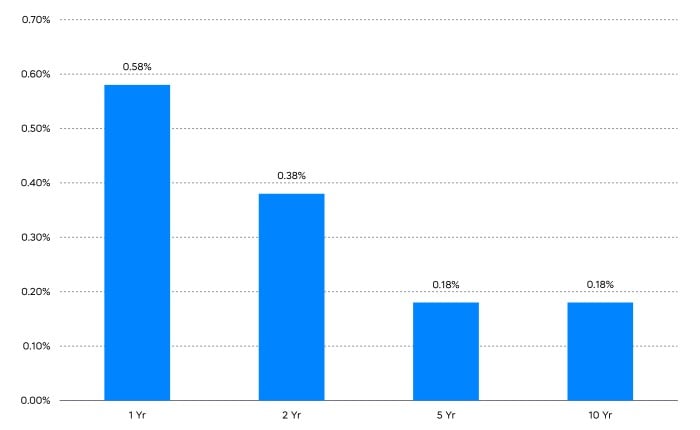
Source: Bloomberg
A strong May employment report emphasized continued tightness in the labor market, with unemployment at 3.4%, and average hourly wages increased 4.4% year-over-year. Inflation remained stubborn, with core CPI rising 5.5% year-over-year and the PCE core deflator rising 4.7% year-over-year.1
Headwinds abound. The Bloomberg consensus forecast for GDP growth is just 1.1% for 2023 and an even more meager 0.8% for 2024. That same consensus predicts unemployment rising to 4.6% and inflation falling to 2.5% by 2024. Nevertheless, the bond market’s performance over the last couple of months should serve as a reminder of how challenging forecasting can be.
Turning to the equity market, strategists increasingly noted the potential attractiveness of dividend stocks. The considerable uncertainty regarding the direction of interest rates, however, makes the choice of what kind of dividend stocks particularly important.
Average Performance During Rising/Falling Interest Rate Periods
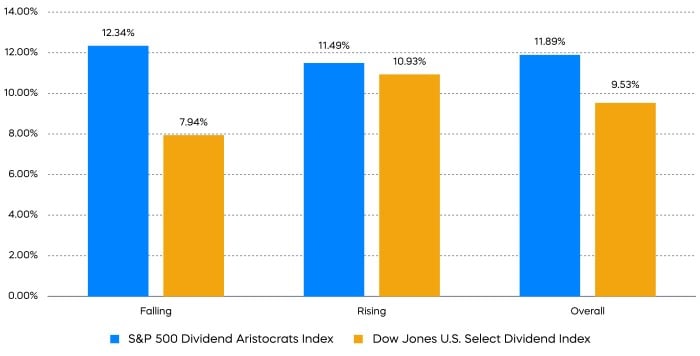
Source: Bloomberg, data from 4/29/05–3/31/23.
Dividend growth stocks, such as the S&P 500 Dividend Aristocrats, have outperformed high dividend yield stocks, like the Dow Jones U.S. Select Dividend Index, in both rising and falling interest rate periods. That potential all-weather approach may come in handy.
Performance Recap
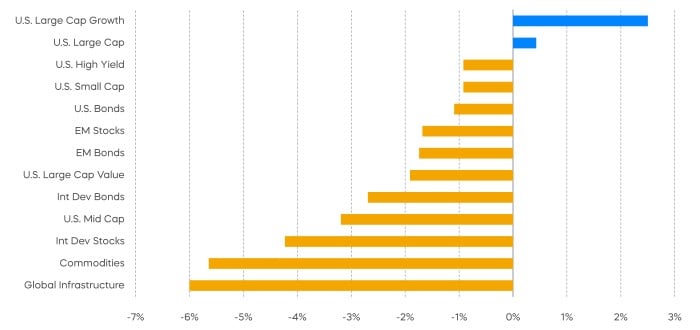
Tech-driven U.S. growth stocks powered through an otherwise challenging narrative.
Asset Class Returns—May 2023
Asset Class Returns—Year-to-Date 2023
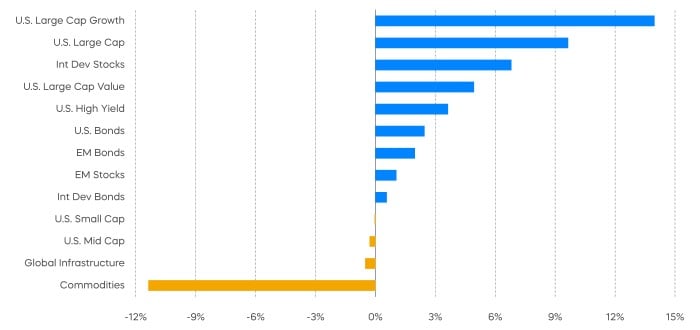
Source: Bloomberg. May returns 5/1/23‒5/31/23; year-to-date returns 1/1/23‒5/31/23. Index returns are for illustrative purposes only and do not reflect any management fees, transaction costs or expenses. Indexes are unmanaged, and one cannot invest directly in an index. Past performance does not guarantee future results.
Economic Calendar
Here’s a list of key and upcoming economic releases, which can serve as a guide to potential market indicators.
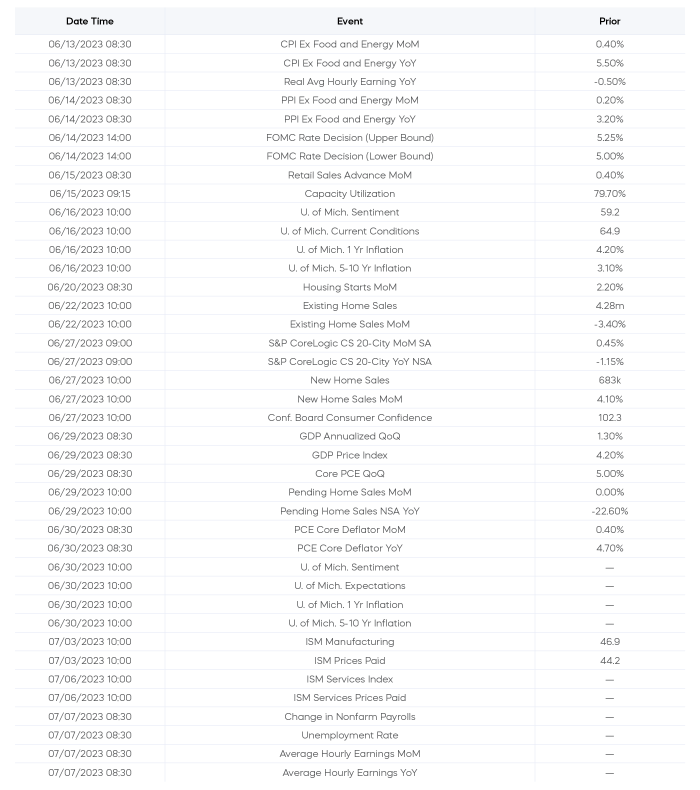
Source: Bloomberg, as of 6/1/23.
Equity Perspectives

A Narrow Market
As we head to the midway point of an eventful 2023, investors may be breathing a small sigh of relief. After all, we’re gaining clarity on two of the market’s biggest concerns of late:
- A bill to suspend the debt ceiling and avoid a default is headed to President Biden’s desk, and he is expected to sign it.
- And, the Fed has indicated it may pause rate hikes, at least for now.
Year-to-date returns for headline indexes have been strong. S&P 500 returns are approaching 10% and the growth-heavy NASDAQ-100 Index is doing even better, with returns of almost 31%.
A closer look at returns, however, reveals that market leadership has been very narrow. Just nine stocks—all of which are technology or technology-related names—have contributed over 100% of the S&P 500’s year-to-date returns. The extreme strength of growth and technology-related stocks, especially mega-caps, is masking weakness in almost every other segment. As investors anticipate a slowing economy, they have been flocking to segments of the market that have been delivering growth. Pockets of growth—stocks with exposure to artificial intelligence, for example—have had such strong moves that their valuations are resembling tech bubbles of past.
Technology Growth at a Reasonable Price
A potential opportunity for investors looking for quality growth at more reasonable prices is technology stocks that grow dividends. Increasingly, profitable tech stocks with mature business models—producing plentiful free cash flow—have been returning capital to shareholders via a growing dividend.
The equal-weighted S&P Technology Dividend Aristocrats Index is a collection of technology related stocks that have grown their dividend for at least seven consecutive years. These well-established tech names tend to offer a rare combination: robust growth at reasonable valuations.
Technology Aristocrats: Growth at a Reasonable Price
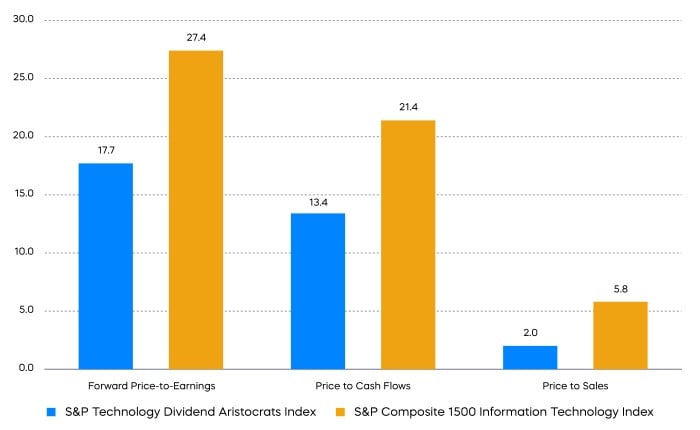
Source: FactSet; data as of 5/31/2023. Forward price-to-earnings (forward P/E) is a version of price-to-earnings (P/E) that uses forecasted earnings for the P/E calculation as a means of determining expectations for whether earnings will increase or decrease in the future. This is not a forecast of a fund’s future performance. Price-to-cash flow measures the value of a stock’s price relative to its operating cash flow per share. Price-to-sales uses a company's market capitalization and revenue to determine whether the stock seems to be valued properly. Past performance does not guarantee future results. Indexes are unmanaged, and one cannot invest directly in an index.
Fixed Income Perspectives

Prices fell as interest rates rose in May, with longer-duration bonds hit the most.
Fixed Income Returns—YTD
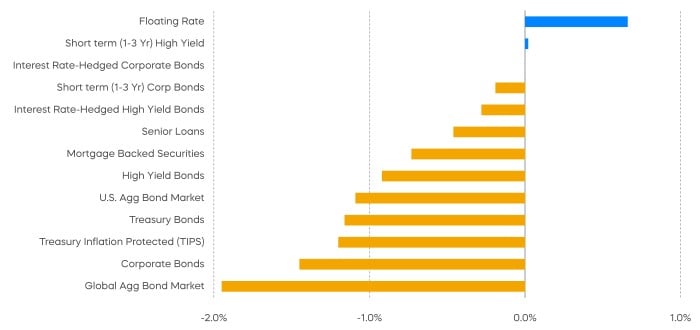
Source: Bloomberg. Data as of 5/31/23.
While equity market volatility has been receding in recent months, bond market volatility has remained elevated. This has led to further divergence between the VIX Index and the MOVE Index, which track volatility in the equity and the bond market respectively.
Increasing Divergence between VIX and MOVE Indexes

Source: Bloomberg, data from 2/28/20–5/31/23.
Are the equity and the bond markets reaching different conclusions about the economy? The source for the disparity could be uncertainty around the Federal Reserve’s path of policy rates. Even if the Fed pauses rate hikes soon, the future path of interest rates may be less predictable.
Counting intra-day moves, the market-implied rate cuts for the second half of 2023 swung by 70 basis points in the month of May alone—the equivalent to nearly three 25-basis point moves. Between the push and pull of tight monetary policy and sticky inflation, the bond market is having an especially tough time pricing what the future may look like.
Implied Rate Cuts for Second Half of 2023
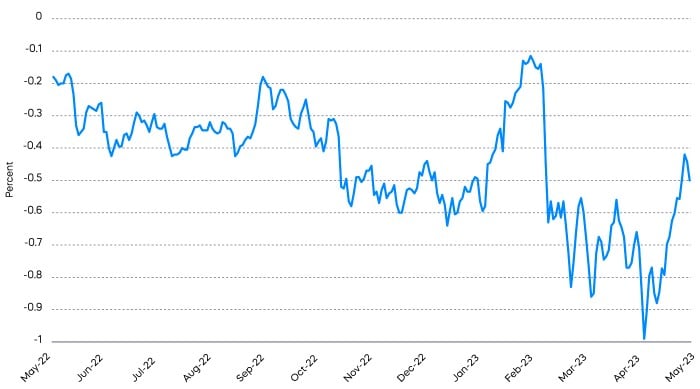
Source: Bloomberg, data from 5/31/22–5/31/23.
For investors looking to reduce risk by shifting from stocks to bonds, there is a bit of an irony. Equity market volatility is down, at just about 75% of its century-to-date average, while bond market volatility is at nearly 150% of its century-to-date average. It prompts the question: why head to the bond market for bond-like returns with equity-like risk?
Sources for data and statistics: Bloomberg, FactSet, Morningstar, and ProShares.
[1] The Consumer Price Index (CPI) measures monthly changes in prices paid by consumers in the United States. The Personal Consumption Expenditures (PCE), also known as consumer spending, measures peoples spending on goods and services in the United States. PCE must incorporate a deflator (the PCE deflator) and real values in order to determine the amount of periodic price change.
The different market segments represented in the performance recap charts use the following indexes: U.S. Large Cap: S&P 500 TR; U.S. Large Cap Growth: S&P 500 Growth TR; U.S. Large Cap Value: S&P 500 Value TR; U.S. Mid Cap: S&P Mid Cap TR; U.S. Small Cap: Russell 2000 TR; International Developed Stocks: MSCI Daily TR NET EAFE; Emerging Markets Stocks: MSCI Daily TR Net Emerging Markets; Global Infrastructure: Dow Jones Brookfield Global Infrastructure Composite; Commodities: Bloomberg Commodity TR; U.S. Bonds: Bloomberg U.S. Aggregate; U.S. High Yield: Bloomberg Corporate High Yield; International Developed Bonds: Bloomberg Global Agg ex-USD; Emerging Market Bonds: DBIQ Emerging Markets USD Liquid Balanced.
The S&P 500 is a benchmark index published by Standard & Poor's (S&P) representing 500 companies with large-cap market capitalizations. The S&P 500 Dividend Aristocrats Index targets companies that are currently members of the S&P 500 that have increased dividend payments each year for at least 25 years. The Dow Jones U.S. Select Dividend Index is designed to represent the U.S.’s leading stocks by dividend yield. The S&P Composite 1500® Information Technology comprises those companies included in the S&P Composite 1500 that are classified as members of the GICS® Information Technology sector. THESE ENTITIES AND THEIR AFFILIATES MAKE NO WARRANTIES AND BEAR NO LIABILITY WITH RESPECT TO PROSHARES.
This is not intended to be investment advice. Indexes are unmanaged, and one cannot invest directly in an index. Past performance does not guarantee future results.
Any forward-looking statements herein are based on expectations of ProShare Advisors LLC at this time. Whether or not actual results and developments will conform to ProShare Advisors LLC’s expectations and predictions, however, is subject to a number of risks and uncertainties, including general economic, market and business conditions; changes in laws or regulations or other actions made by governmental authorities or regulatory bodies; and other world economic and political developments. ProShare Advisors LLC undertakes no duty to update or revise any forward-looking statements, whether as a result of new information, future events or otherwise.
Investing is currently subject to additional risks and uncertainties related to COVID-19, including general economic, market and business conditions; changes in laws or regulations or other actions made by governmental authorities or regulatory bodies; and world economic and political developments.
Investing involves risk, including the possible loss of principal. This information is not meant to be investment advice.
The “S&P 500®” and “S&P 500® Dividend Aristocrats® Index” are products of S&P Dow Jones Indices LLC and its affiliates and have been licensed for use by ProShare Advisors LLC. "S&P®" is a registered trademark of Standard & Poor’s Financial Services LLC (“S&P”), and “Dow Jones®" is a registered trademark of Dow Jones Trademark Holdings LLC (“Dow Jones”) and they have been licensed for use by S&P Dow Jones Indices LLC and its affiliates. ProShares ETFs based on these indexes are not sponsored, endorsed, sold or promoted by these entities or their affiliates, and they make no representation regarding the advisability of investing in ProShares ETFs. THESE ENTITIES AND THEIR AFFILIATES MAKE NO WARRANTIES AND BEAR NO LIABILITY WITH RESPECT TO PROSHARES.