A Tale of Two Economies
Key Observations

The key question of 2023—will there be a hard or soft landing—depends very much on which economy one is looking at: the goods economy or the service economy.
Chart of the Month
Side-by-Side Capacity Utilization versus Unemployment Rate
Source: Bloomberg and U.S. Bureau of Labor Statistics. Data from 11/1/72–11/31/22.
A look at U.S. capacity utilization, a measure focused on U.S. manufacturing, points to the potential for a soft landing. It’s right on its long-term average of 80. Readings above 80 have historically pointed toward higher inflation. No overheating here. This almost certainly would have been one of the key exhibits for “team-transitory” a year ago. Then there’s the unemployment rate to look at. It’s well under its long-term average, and wage inflation, the stickiest inflation, has been running around 5%. Higher unemployment, perhaps the simplest way to define a hard landing, would seem to be a requirement.
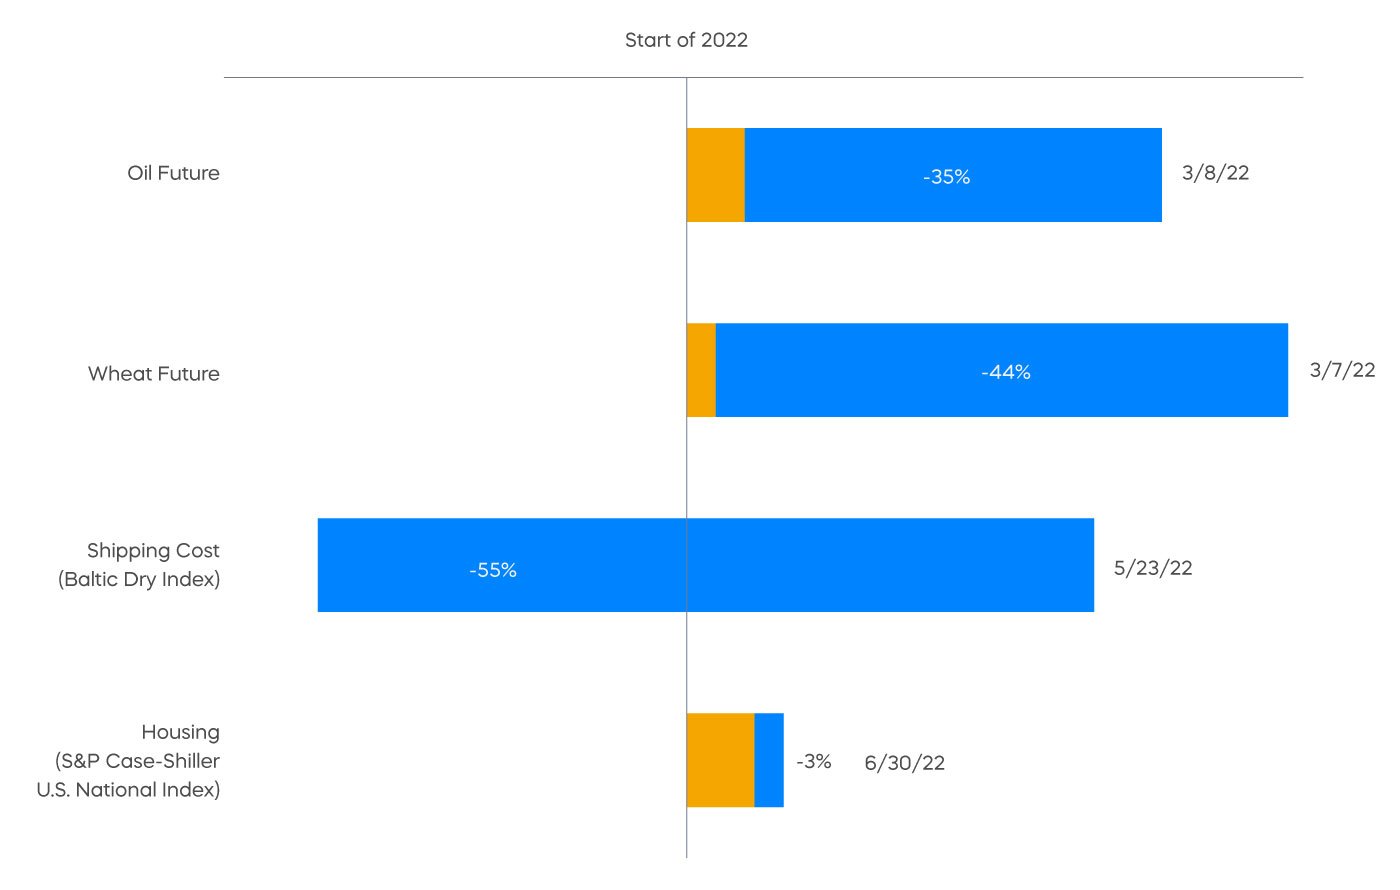
Consider us to be in the soft-landing camp. We believe there should be enough inflation relief from things other than wages to limit the needed increase in the unemployment rate. Here, for example, are a few noteworthy items whose prices have already fallen substantially.
2022 Year-End Price Changes Since Recent Peaks
Source: Bloomberg. Data as of 12/31/22.
Are there “known unknowns” that could prevent a soft landing? Of course. The war in Ukraine continues to risk supply shocks. And the outcome of Chinese reopening cuts both ways—a challenged reopening could disrupt recovering supply chains, while a gangbusters reopening could renew price pressure on goods. Still, if a hard landing typically follows a period of an overheated goods and services economy, we believe the fact that we have only one of two in the U.S. should keep it soft(ish).
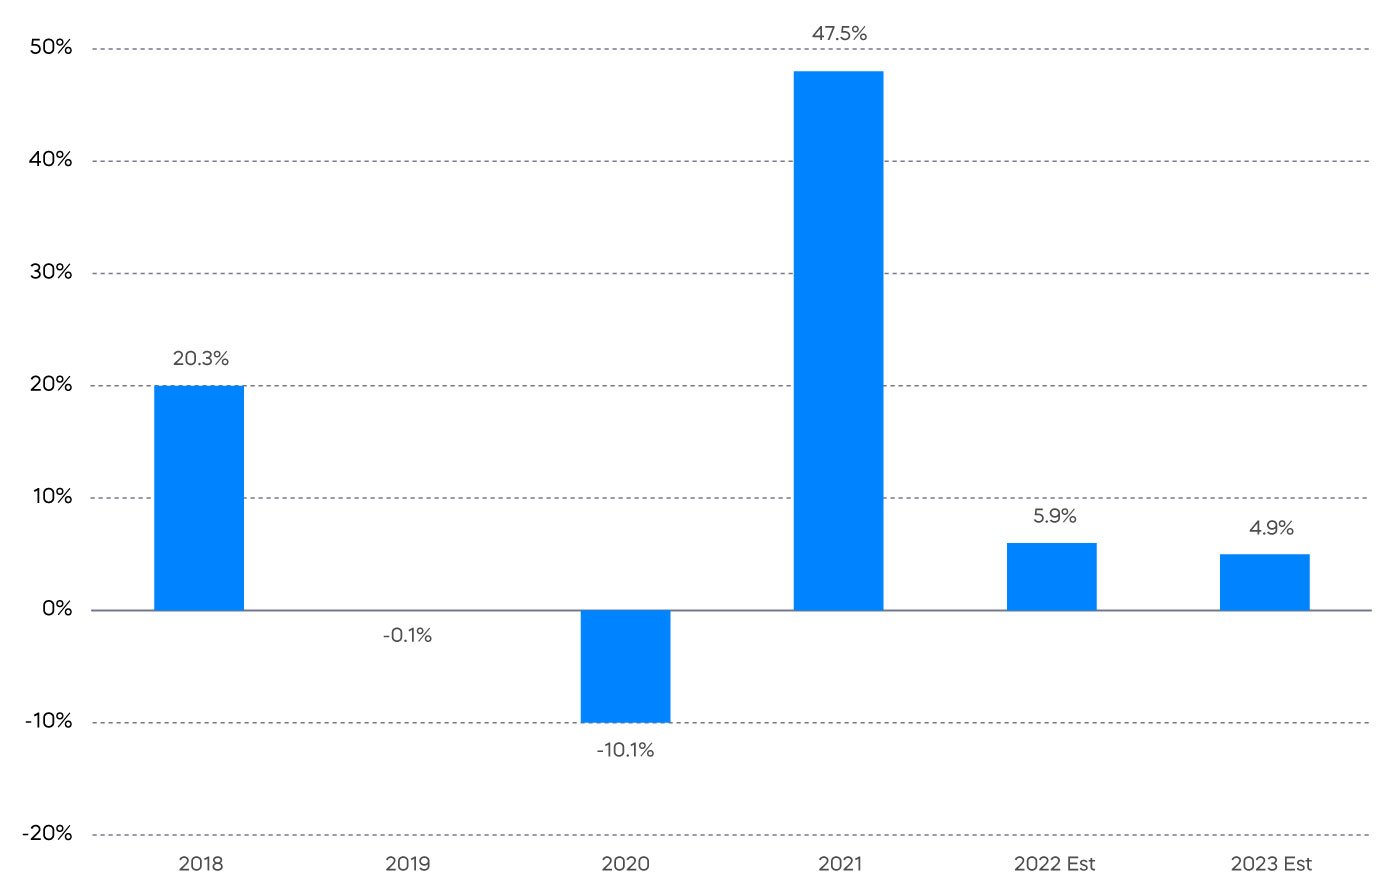
Focus on Earnings
2018–2023 S&P 500 Year-Over-Year Earnings Growth
Source: FactSet. Data as of 1/3/23.
In a year in which the S&P 500 fell over 18%, it may come as a bit of surprise that the S&P 500 delivered positive earnings growth in 2022. It was nothing near 2021’s snapback, and a little less than inflation, but was positive nonetheless. The S&P 500’s fall was driven by shrinking price-to-earnings multiples. Price-to-earnings (PE) shows how much investors are paying for a dollar of a company's earnings. What might 2023 bring? It is correct that a substantial driver of shrinking PE multiples in 2022 was rising interest rates. However, it is also important to note that PE multiples are driven primarily by changes in longer-term interest rates. The 10-year Treasury yield rose well over 2% in 2022 and now stands just a bit below 4%.
Here’s the good news. With longer-term inflation expectations running close to 2%, a 4% 10-year Treasury yield (2% above inflation) is right on its historical average. So even if the Fed hikes rates a bit more, 10-year yields might just stay around 4%, and cause no further damage to PE multiples. The converse is also true. Even if 1-year to 2-year Treasury yields start to come down reflecting eventual Fed cuts—the 10-year Treasury yield would likely hang in there around 4%—providing no benefit to PE multiples. That’s a long way of saying that we think PE multiples will likely be stable in 2023. That 4.9% consensus earnings growth estimate, a number that will likely be not much more than inflation, seems like a decent guess at the price return of the S&P 500. Throw a 1.5% to 2% dividend on top, and you have a high-single-digit return for the S&P 500 in the soft-landing scenario.
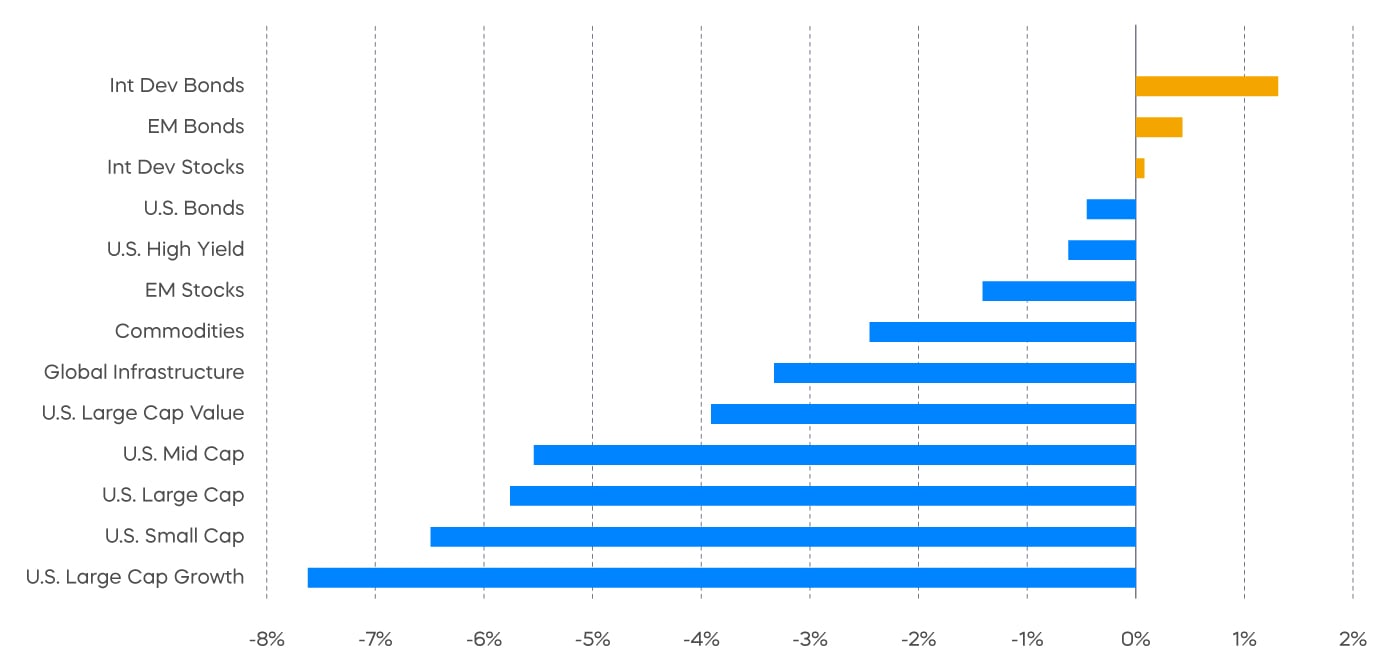
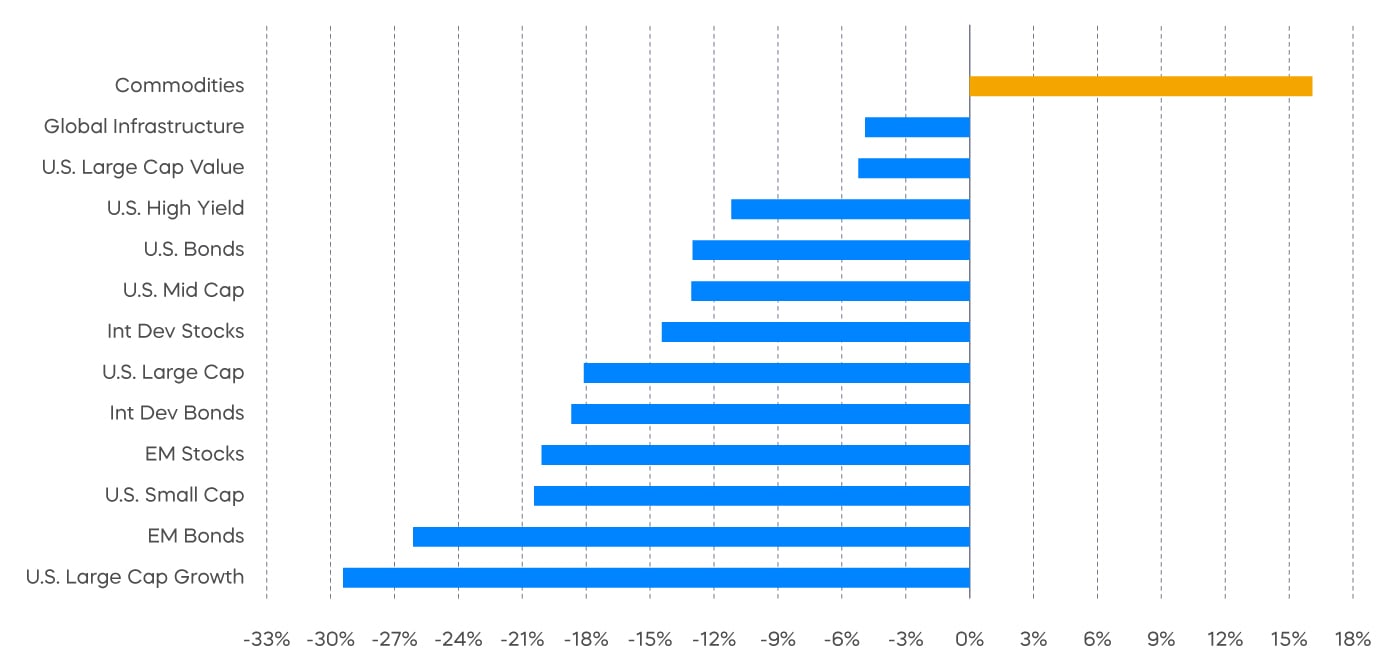
Performance Recap
A red month, capping a red year.
Asset Class Returns—December 2022
Asset Class Returns—Full Year 2022
Source: Bloomberg. December returns 12/1/22‒12/31/22; full year returns 1/1/22‒12/31/22. Past performance does not guarantee future results. Indexes are unmanaged, and one cannot invest directly in an index.
Economic Calendar
Here’s a list of upcoming key economic releases, which can serve as a guide to potential market indicators.
Source: Bloomberg, as of 1/1/23.
Equity Perspectives
Year-end market reviews often reveal the futility of making predictions. For example, this time last year, rapidly building inflation was often described as transitory. Fed rate hikes were expected to be gradual. The focus was on how the economy would normalize post-pandemic, not necessarily on the strains from an ongoing major military conflict. Alas, events worked out a bit differently than expected.
Focus on the Fundamentals
Our outlook last year noted a dim view of fixed income in anticipation of rates rising, and we had a more optimistic view on equities, especially dividend growth strategies. While we were correct on the former, we missed the mark on the latter. But perhaps we earned partial credit. Dividend strategies produced mildly negative returns in 2022 as rates rose in a stunningly rapid manner, but substantially outperformed the broad market. The point here is that you can win the race with the right horse, even if the race doesn’t go as planned.
Will the winning horses for 2022 repeat in the new year? The potential is certainly there. The focus for equity markets in 2023 will likely remain on the Fed and fundamentals. Despite clear signs that inflation is slowing, the Fed isn’t quite done playing catch-up with rate hikes. Many market observers believe that as the lagged effect of restrictive monetary policy continues to manifest, fundamentals like corporate earnings will deteriorate. An economic slowdown seems almost inevitable. The only question seems to be the adjective that will be used to describe it: a soft landing or a deep recession? Either way, higher-quality dividend growth stocks with defensive characteristics once again appear well positioned to outperform in what could be a volatile equity environment. Following are a couple of reasons why.
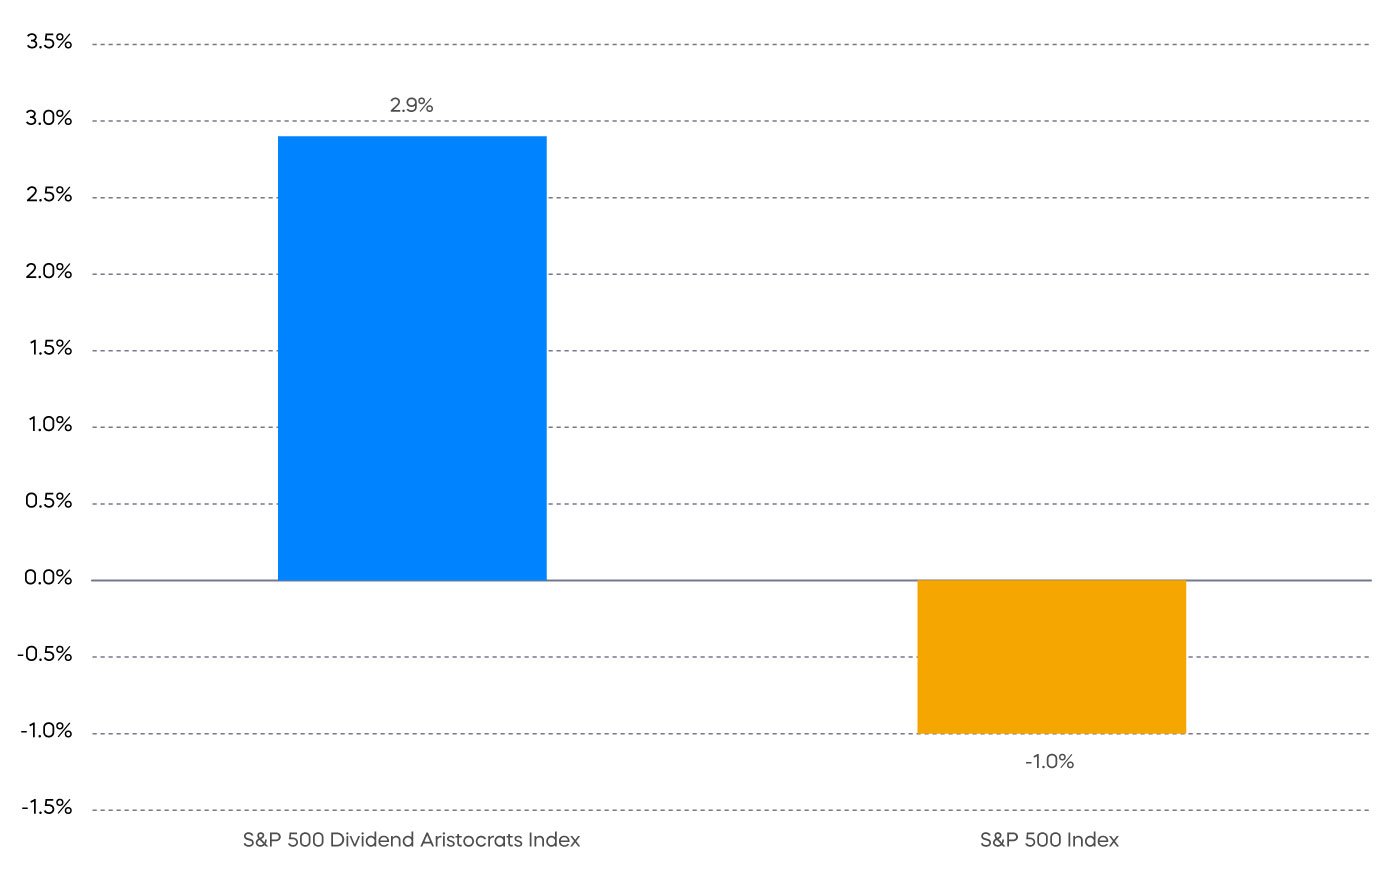
Pricing Power
S&P 500 profit margins are under pressure. After steadily rising for several years and peaking at almost 13% in 2021, rising input costs and supply chain issues have begun to erode corporate profit margins. According to FactSet, S&P 500 margins declined 1% year-over-year during Q3 2022 and are expected to decline for the full calendar year 2022. Further margin pressure may be in store if inflation remains sticky. Some segments of the market may continue to hold up better on this front than others. Thus far, the S&P 500 Dividend Aristocrats have bucked the trend and increased margins in 2022. Companies that can exhibit pricing power are generally better suited to withstand margin pressure.
Q3 2022 versus Q3 2021 Change in Net Profit Margins
Source: FactSet. Data as of 9/30/22. Margin refers to net profit margin, which is an indicator of a company's financial health that measures how much net income is generated as a percentage of revenues received. Past performance does not guarantee future results. Indexes are unmanaged, and one cannot invest directly in an index.
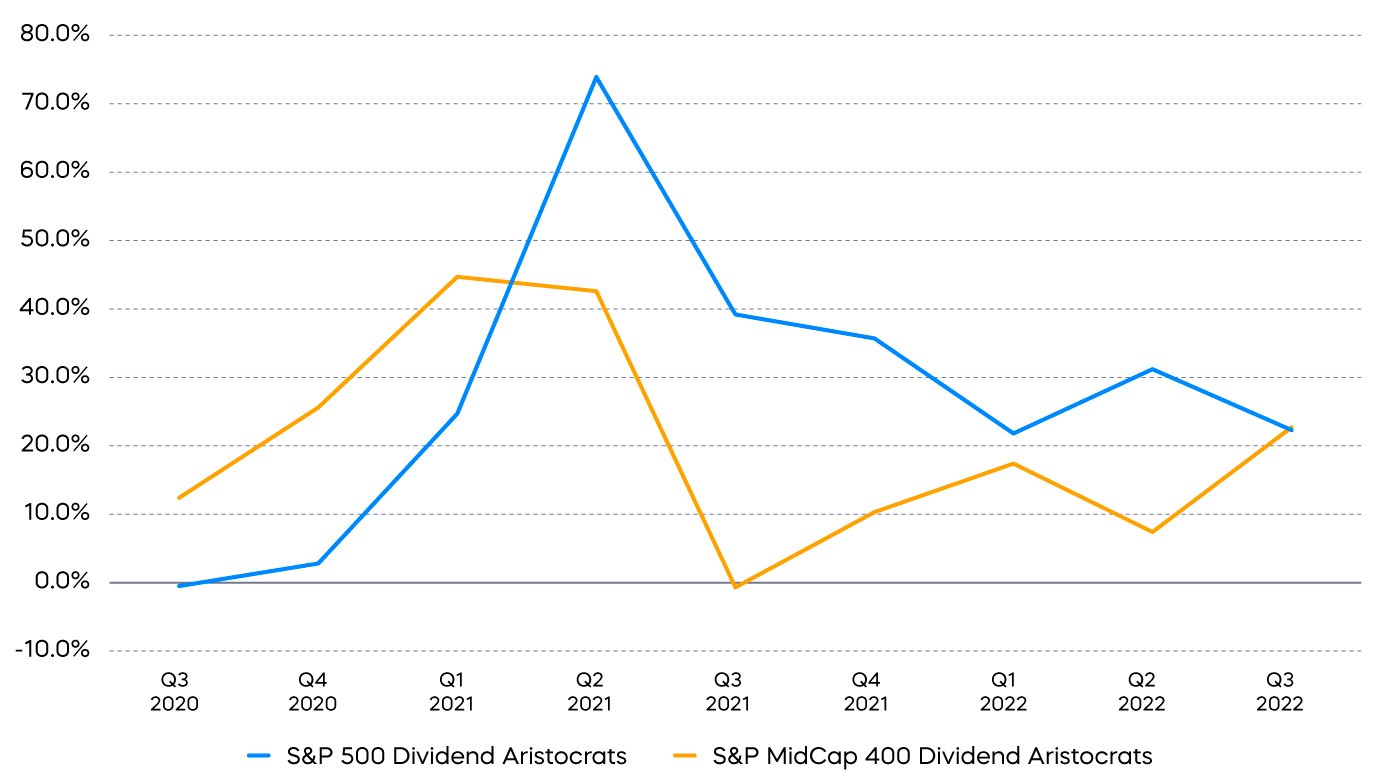
Resilient Earnings
Consensus earnings expectations are for the S&P 500 to deliver approximately $233 of earnings per share in calendar 2023, or roughly 5% growth from expected 2022 amounts, according to FactSet. That seems reasonable enough at first glance, but many believe those estimates need to come down—perhaps substantially in a hard landing scenario. Why? Look at the trend. Earnings growth for Q4 is expected to be -3%. Further, 2022’s expected earnings have grown, but turn negative if one removes the energy sector. In effect, energy has been doing most of the heavy lifting. Given the robust growth rates in 2022, energy seems unlikely to repeat its stellar performance in 2023. Large- and mid-cap Dividend Aristocrat strategies have delivered better, more resilient earnings growth without a large impact from energy stocks.
Resilient Earnings Growth of the Dividend Aristocrats
Source: FactSet. Data from 7/1/20–9/30/22. Past performance does not guarantee future results. Indexes are unmanaged, and one cannot invest directly in an index.
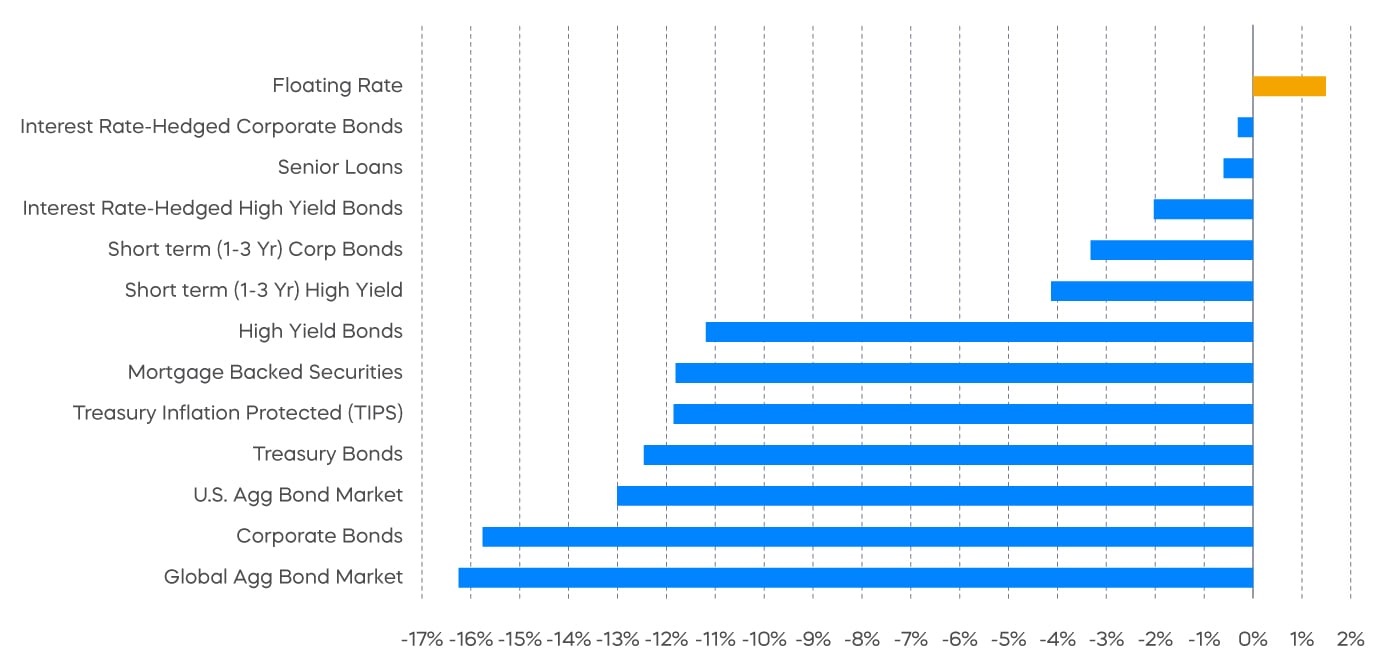
Fixed Income Perspectives
Among the common investment headlines of late has been “the failure of the 60/40 portfolio.” When a weakening economy drags down equity prices, bond yields, at least longer-term bond yields, are supposed to fall. But because longer-term yields had been artificially suppressed since the Great Recession and further suppressed in the pandemic, the normalization (i.e., rising longer-term interest rates and falling bond prices) coincided with falling equity prices. With credit spreads also widening, just about every fixed income segment fell in 2022. For extra credit, take note of the losses in TIPS. Inflation expectations fell in 2022 while Treasury yields rose—a double-whammy for TIPS.
Fixed Income Returns—Full Year 2022
Source: Bloomberg, data from 1/1/22–12/31/22. Past performance does not guarantee future results. Indexes are unmanaged, and one cannot invest directly in an index.
What’s Next
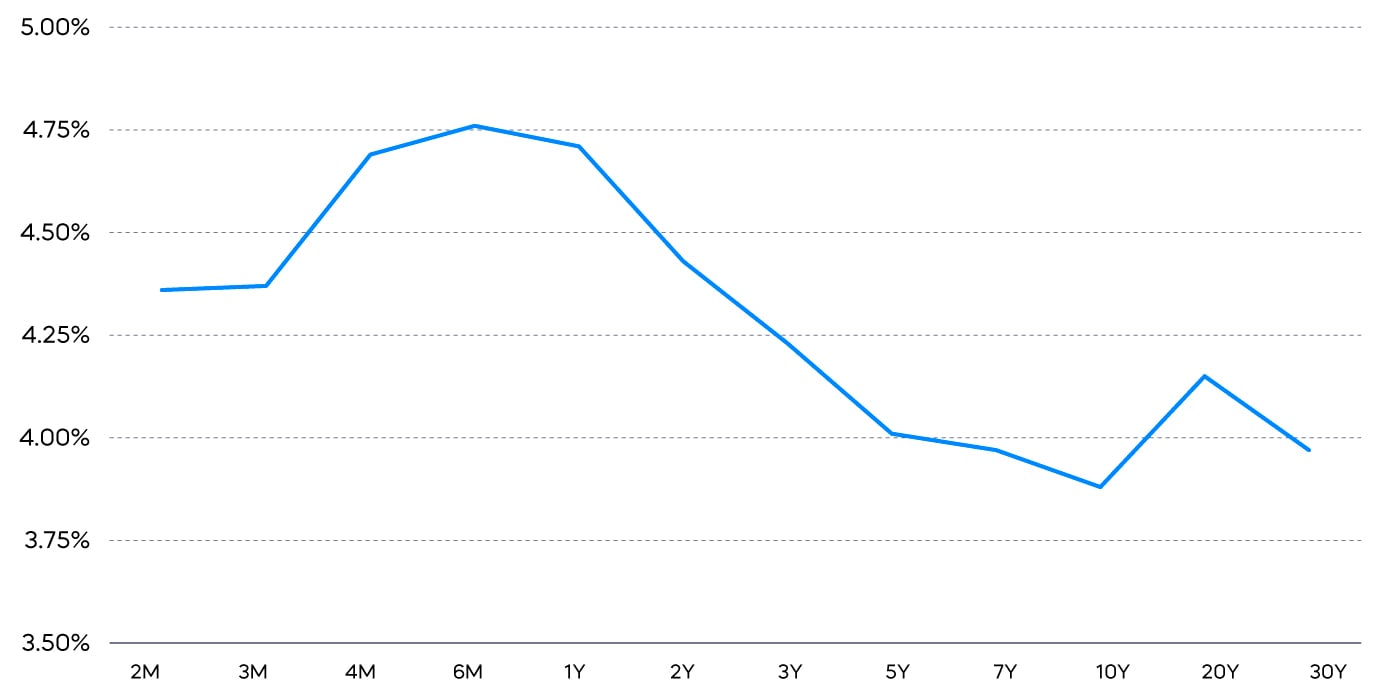
Imagine a world where inflation is at the Fed’s target of 2% and the economy is doing just fine. In that world, Fed Funds should be 2% and the 10-year Treasury yield should be 4%. That’s probably not the world of 2023, but it may be the world of 2024. In 2023, the Fed appears to have a little bit of hiking left to do. With the 10-year Treasury yield just a bit below 4%, long-term rates may drift modestly higher in 2023—perhaps even a bit higher than 4% since inflation expectations aren’t quite all the way down to 2%.
U.S. Treasury Yield Curve as of 12/30/22, Starting from 2-Month to 10-Year
Source: Bloomberg.
For a little while longer, investors in U.S. Treasurys may be able to take advantage of short-term yields—think 6-month to 2-year maturities—that are notably higher than longer-term Treasurys. Yes, there is reinvestment risk. But we believe those longer-term yields could be, if anything, slightly higher a year from now.
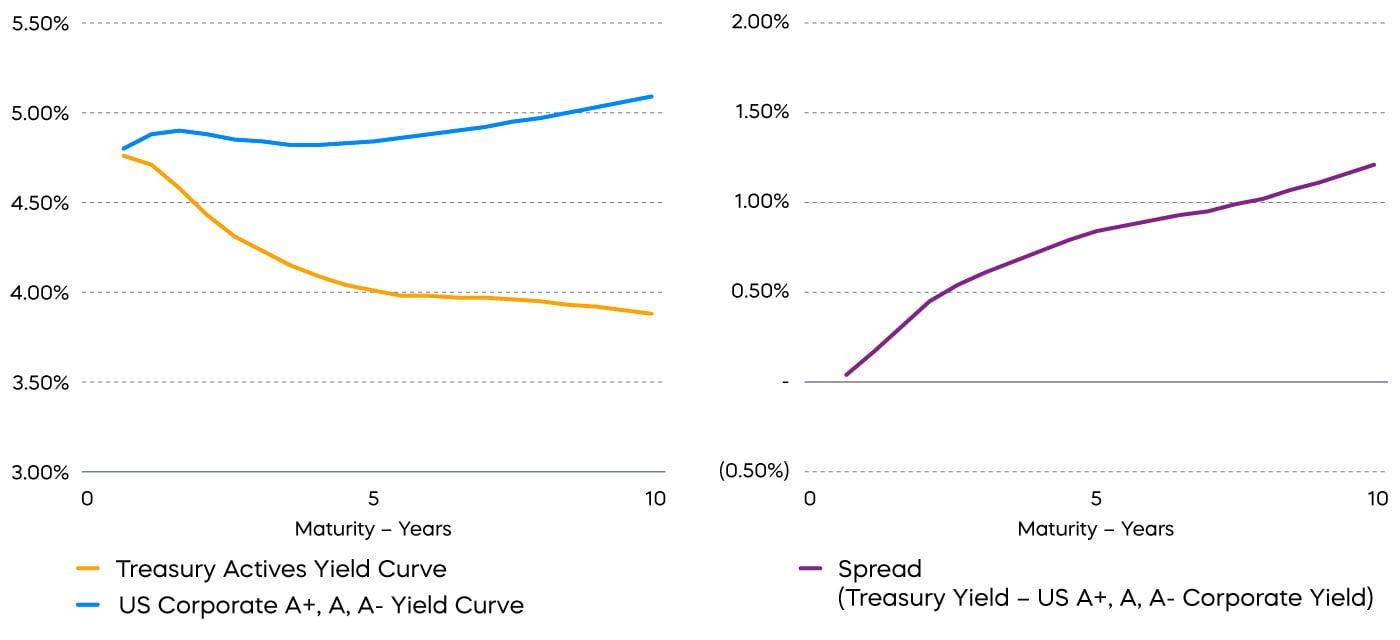
While taking longer duration risk in U.S. Treasurys may not make sense right now, the corporate bond opportunity is a bit trickier. While the U.S. Treasury curve is inverted, the corporate bond curve is not. The spread between corporate bond yields and Treasurys is notably wider for longer maturities.
Single A Corporate Bond Spread, as of 12/30 from 6-Month to 10-Year
Source: Bloomberg.
The combination of an inverted Treasury curve and wider longer-term corporate bond spreads presents a potentially unique opportunity. A corporate bond investor could buy longer-term corporate bonds to take advantage of the wider spreads, and hedge the Treasury-rate risk. Since the Treasury curve is inverted, the hedge could actually make money, while still delivering protection from rising longer-term Treasury yields.
Thematic Perspectives
A Scarcity of Growth
Rapidly rising interest rates put the brakes on nearly all categories of growth and thematic-oriented strategies during 2022. The S&P 500 Growth Index lost just under 30% and fared far worse than the broad market. Growth strategies—especially those that lack current profitability—may continue to struggle as monetary policy remains restrictive. But selected winners will undoubtedly emerge as the interest rate picture eventually stabilizes.
The key is to be selective and focus on durable growth strategies that have the potential to perform well regardless of the economic backdrop. With growth opportunities likely to be scarce in the near term, those that succeed may earn market premiums. A few themes we believe are likely to fit that description are energy transition, the accelerated adoption of electric vehicles and resultant shortage of battery metals, and the continued emergence of online retail.
Energy Transition
The global clean energy transition is shaping up to be potentially a trillion-dollar opportunity. Governments around the world have introduced legislation that will mandate a reduction in the amount of carbon emissions, many with the goal of reaching net zero by 2050. Reaching those goals will be an enormous challenge and require huge amounts of capital spending.
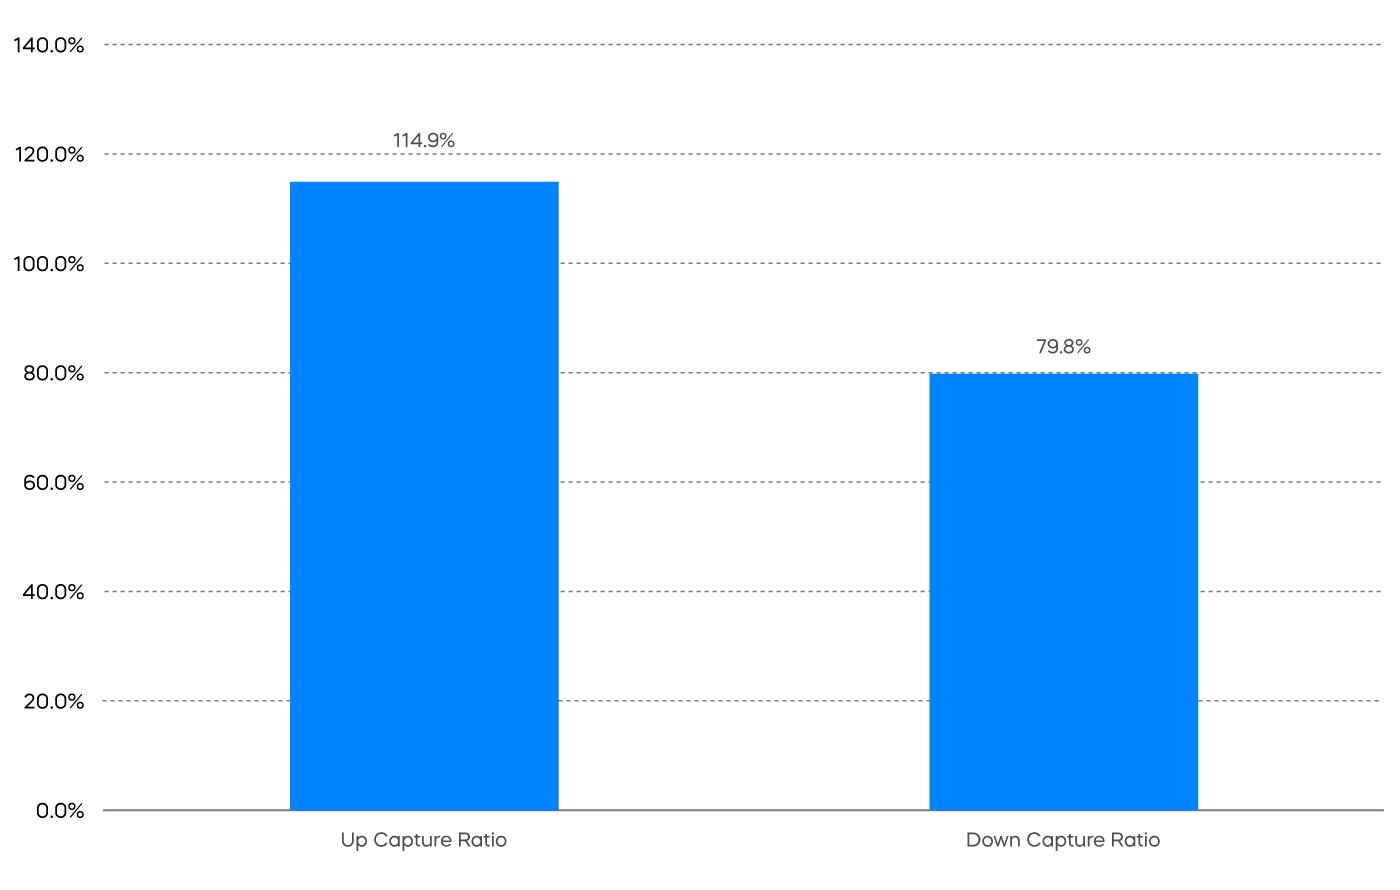
Capitalizing on the investment opportunity presented by the race to net zero also presents several challenges. For one, the transition will take decades and our existing energy infrastructure network that supports fossil fuel usage isn’t going away anytime soon. A listed infrastructure strategy like the DJ Brookfield Global Infrastructure Composite Index, which has significant exposure to energy infrastructure, has been a potential refuge in a difficult equity market. With global growth slowing and inflation likely to remain persistent, the index’s resilient performance, supported by stable long-term cash flows, could remain a timely strategy.
Infrastructure Could Be a Timely Real-Asset Strategy
Source: Morningstar. Data from 1/1/2022–12/31/22. Performance quoted represents past performance and does not guarantee future results. Indexes are unmanaged, and one cannot invest directly in an index. Up and down capture are relative to the MSCI World Index. “Up capture ratio” measures the performance of a fund or index relative to a benchmark when that benchmark has risen. Likewise, “down capture ratio” measures performance during periods when the benchmark has declined. Ratios are calculated by dividing monthly returns for the fund’s index by the monthly returns of the primary index during the stated time period and multiplying that factor by 100.
A second way to potentially capitalize on energy transition is through an index-based strategy like the S&P Kensho Cleantech Index. The index attempts to solve a key challenge of clean energy investing by capturing a diverse set of opportunities—like energy capture, generation and production, installation, and storage—in one strategy.
Soaring Demand for Battery Metals
Commodities were one of the few bright spots in 2022. Aside from obvious winners like oil and natural gas, another category of commodities has seen its prices increase rapidly: core battery metals like lithium, cobalt and nickel. Lithium, for example, saw its price increase 219% in 2022 and increase 10x over the last decade (Source: S&P Capital IQ, data through 10/31/22).
These metals are key to producing the lithium-ion batteries used to power electric vehicles. Electric vehicle demand appears to explode over the coming years, and recent news of Tesla missing vehicle delivery targets could prove temporary.
|
Global Passenger EV Sales Are Increasing
|
… But Still Represent a Tiny Fraction of Total Passenger Vehicles on the Road Today
|
|
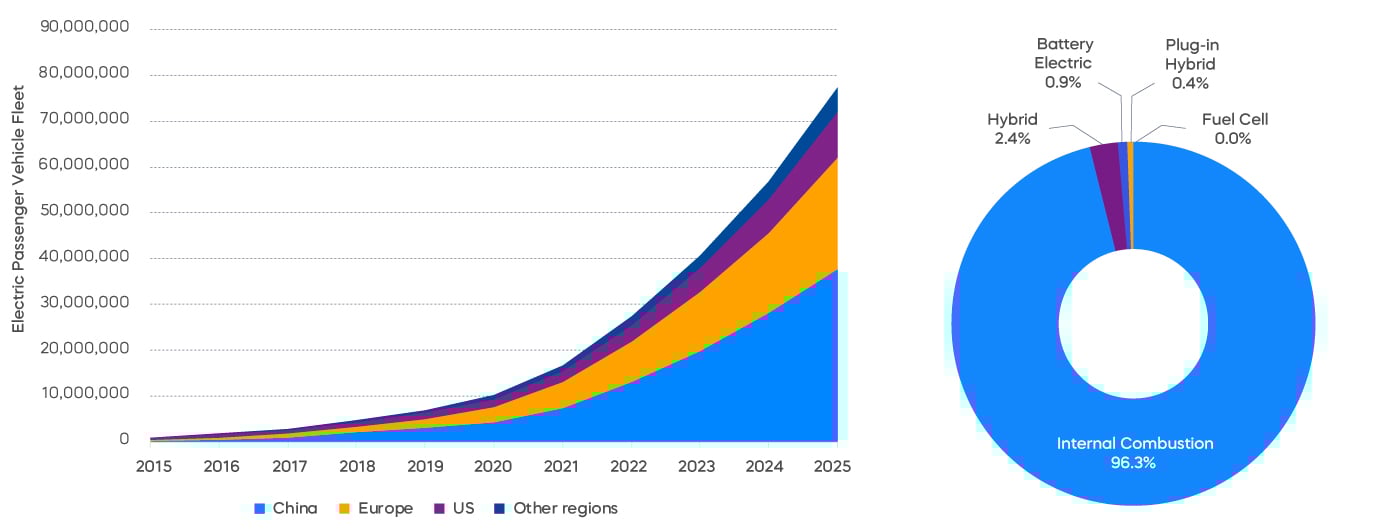
|
Source: BloombergNEF, “Electric Vehicle Outlook 2022.”
An upcoming supply shortage of battery metals, forecasted to be acute for lithium by 2030, may continue to keep prices high. The investment implication may not be obvious, but it is intriguing nonetheless. The miners of core battery metals—as represented by the S&P Global Core Battery Metals Index—have the potential to benefit from the metals supply-and-demand imbalance for years to come. Furthermore, the miners have advantageous investment characteristics like high barriers to entry and limited competition, and they are generally profitable today.
Re-Acceleration of Online Retail
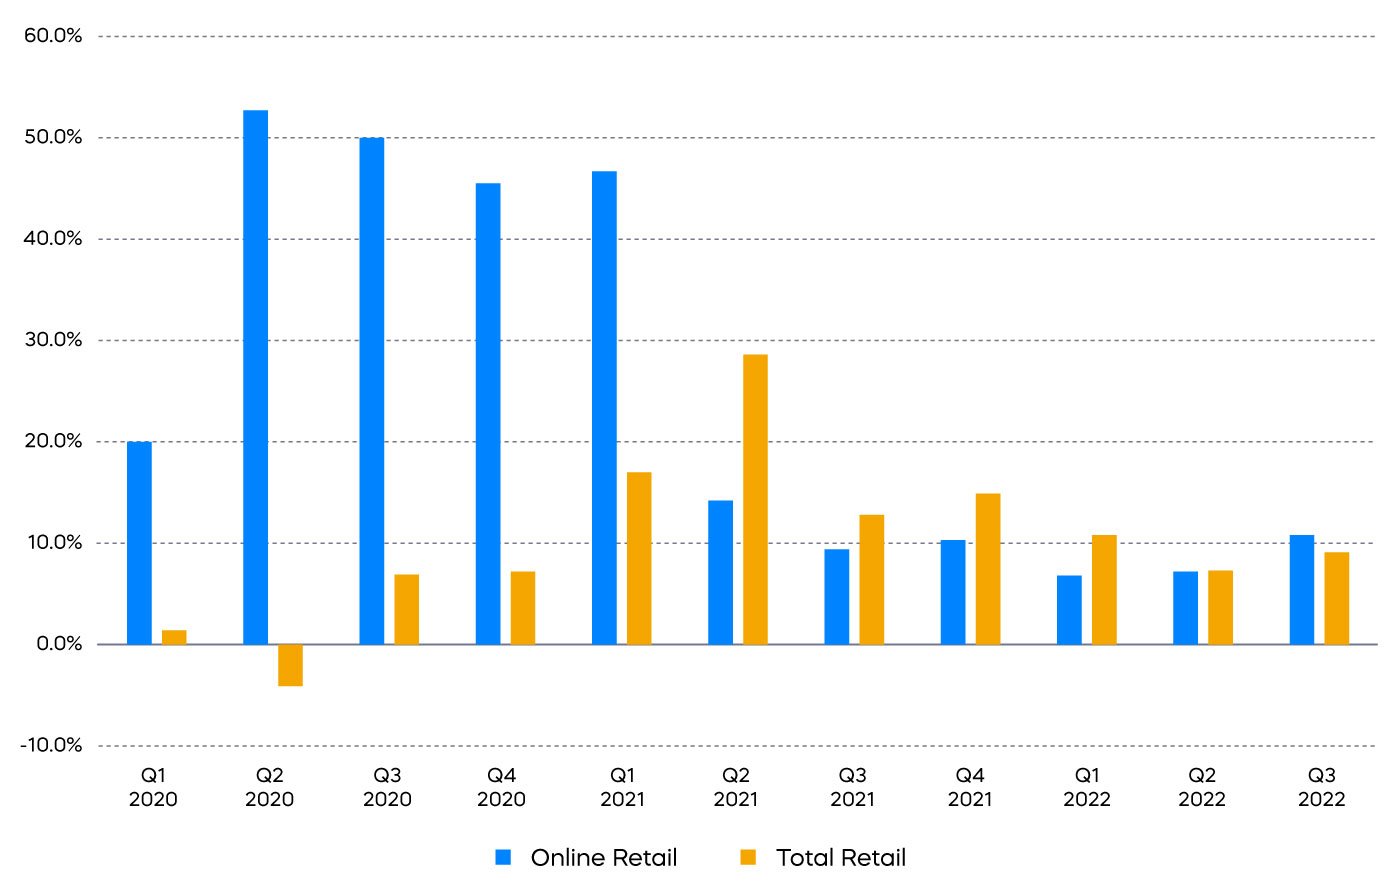
Online retail had a significant moment in the sun at the onset of the pandemic. Lockdowns essentially forced consumers to purchase goods online, and as a result, online retail saw huge quarter-over-quarter rates. As the economy re-opened, the pent-up demand to head back to the mall was all but inevitable. Overall retail sales and traditional retailers found their footing, at least temporarily. But for how long remains the key question.
Over the last year, total retail sales have been slowing while online retail has been re-accelerating. The Q3 2021 numbers marked the first time since Q1 2021 in which online growth again surpassed total retail. It’s reasonable to expect more of the same in 2023, and we could see a return to headlines about traditional store closings, as margins remain under pressure and economic growth slows.
Quarterly Growth Rates for Online Retail May Re-Accelerate
Source: U.S. Census Bureau. Data from 1/1/20–9/30/22.
Sources for data and statistics: Bloomberg, FactSet, Morningstar, and ProShares.
The different market segments represented in the performance recap charts use the following indexes: U.S. Large Cap: S&P 500 TR; U.S. Large Cap Growth: S&P 500 Growth TR; U.S. Large Cap Value: S&P 500 Value TR; U.S. Mid Cap: S&P Mid Cap TR; U.S. Small Cap: Russell 2000 TR; International Developed Stocks: MSCI Daily TR NET EAFE; Emerging Markets Stocks: MSCI Daily TR Net Emerging Markets; Global Infrastructure: Dow Jones Brookfield Global Infrastructure Composite; Commodities: Bloomberg Commodity TR; U.S. Bonds: Bloomberg U.S. Aggregate; U.S. High Yield: Bloomberg Corporate High Yield; International Developed Bonds: Bloomberg Global Agg ex-USD; Emerging Market Bonds: DBIQ Emerging Markets USD Liquid Balanced.
The S&P 500 is a benchmark index published by Standard & Poor's (S&P) representing 500 companies with large-cap market capitalizations. The S&P 500 Dividend Aristocrats Index targets companies that are currently members of the S&P 500 that have increased dividend payments each year for at least 25 years. The S&P 500 Growth Index serves as a proxy for growth companies included in the S&P 500, identifying them using three factors: sales growth, the ratio of earnings change to price, and momentum. The Dow Jones Brookfield Global Infrastructure Composite Index consists of companies domiciled globally that qualify as "pure-play" infrastructure companies, companies whose primary business is the ownership and operation of infrastructure assets. The S&P Kensho Cleantech Index is designed to track the performance of companies focused on building the technologies or products that enable the generation of energy in a clean manner. The S&P Global Core Battery Metals Index is composed of companies which derived positive revenue and had positive production value, in aggregate, from the mining of lithium, nickel or cobalt. THESE ENTITIES AND THEIR AFFILIATES MAKE NO WARRANTIES AND BEAR NO LIABILITY WITH RESPECT TO PROSHARES.
This is not intended to be investment advice. Indexes are unmanaged, and one cannot invest directly in an index. Past performance does not guarantee future results.
Any forward-looking statements herein are based on expectations of ProShare Advisors LLC at this time. Whether or not actual results and developments will conform to ProShare Advisors LLC’s expectations and predictions, however, is subject to a number of risks and uncertainties, including general economic, market and business conditions; changes in laws or regulations or other actions made by governmental authorities or regulatory bodies; and other world economic and political developments. ProShare Advisors LLC undertakes no duty to update or revise any forward-looking statements, whether as a result of new information, future events or otherwise.
Investing is currently subject to additional risks and uncertainties related to COVID-19, including general economic, market and business conditions; changes in laws or regulations or other actions made by governmental authorities or regulatory bodies; and world economic and political developments.
Investing involves risk, including the possible loss of principal. This information is not meant to be investment advice.
The “S&P 500®,” “S&P 500® Dividend Aristocrats® Index,” “S&P 400® Dividend Aristocrats® Index,” “Dow Jones Brookfield Global Infrastructure Composite Index,” “S&P Kensho Cleantech Index” and “S&P Global Core Battery Metals Index” are products of S&P Dow Jones Indices LLC and its affiliates and have been licensed for use by ProShares. "S&P®" is a registered trademark of Standard & Poor’s Financial Services LLC (“S&P”), and “Dow Jones®" is a registered trademark of Dow Jones Trademark Holdings LLC (“Dow Jones”) and they have been licensed for use by S&P Dow Jones Indices LLC and its affiliates. ProShares based on these indexes are not sponsored, endorsed, sold or promoted by these entities or their affiliates, and they make no representation regarding the advisability of investing in ProShares. THESE ENTITIES AND THEIR AFFILIATES MAKE NO WARRANTIES AND BEAR NO LIABILITY WITH RESPECT TO PROSHARES.