Key Observations

Chart of the Month
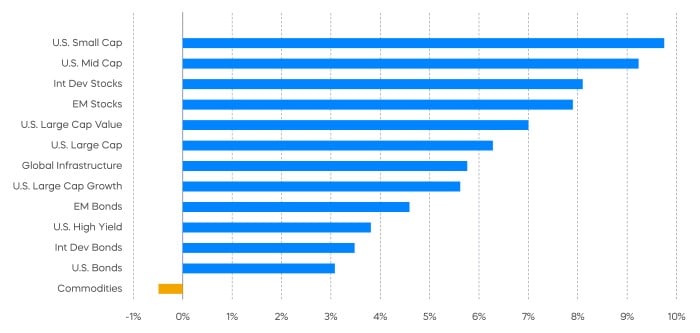
Performance Recap
Here’s a list of upcoming key economic releases, which can serve as a guide to potential market indicators.

Equity Perspectives

The magnitude of January’s equity rally seems to have caught investors off guard. The S&P 500 clearly had some momentum coming off its most recent low on October 12, however sentiment readings implied that few investors expected such a robust January effect.
Of course, actual results often differ from expectations. January produced strong returns across equity market segments, styles and sectors. Perhaps most interesting is that market leadership essentially reversed the patterns we saw in 2022. The Nasdaq-100 Index—one of 2022’s worst performers with losses of 32.4%—led all major equity averages in January by posting returns of 10.7% (Source: Morningstar, as of 2/1/23). Consumer discretionary and communication services were the two worst performing sectors last year, but they were the two strongest performers in January. This all happened before the Fed’s latest rate increase and less-hawkish tone.
The question on everyone’s minds is whether the nascent rally has more legs, and if so, will it ultimately take us out of the bear market. Several major-market averages have shown signs of life and bullish trading patterns have emerged. But the S&P 500 rallied on at least three occasions in 2022 before flaming out and turning lower.
The bullish narrative seems to have grown stronger during the first five weeks of 2023. Inflation has been retreating, the Fed’s tightening appears to be nearing the end after its latest 25 basis point increase, and China is re-opening. Perhaps the Fed can slow inflation without breaking the economy. Even more, we’re in a seasonally strong period for equity returns and in the third year of a presidential term—historically the best year. While that narrative is compelling, a prudent approach remains warranted.
For one, several economic indicators have continued to weaken. According to the PMI data released by S&P Global in late January, the U.S. manufacturing sector continued to decline at the start of 2023. More broadly, several recession indicators are flashing red. The Conference Board’s latest release of their leading economic index declined almost 4% over the latest six-month period. The yield curve also remains deeply inverted. With the S&P 500 trading at roughly its 10-year averages, valuations cannot be described as cheap. And on the question of corporate earnings—perhaps the biggest potential near-term mover of markets aside from the Fed—the picture remains clouded. As we said previously, early earnings reports for the S&P 500 during Q4 have been flat as compared to the prior year. However, expectations are for a decline of near 5%, when all is said and done.
The point here is that the outlook is decidedly cloudy, and that asset allocators should remain vigilant and may want to focus on high-quality, all-weather strategies that can perform well under a variety of market conditions.
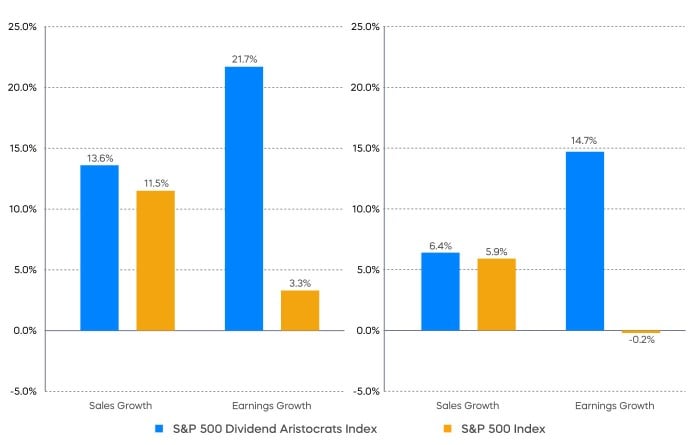
Technology investors have had a wild ride over the last several years. After leading the markets with strong returns from 2019 through 2021, the S&P Technology Select Sector Index declined over 27% in 2022. As the era of ultra-low interest rates continues to normalize, we’ve argued that investors should be more selective with their technology allocation. We believe that low-to-no profit tech at rich multiples are likely remain challenged. In contrast, more established technology names offer a desirable combination: profits and dividends.
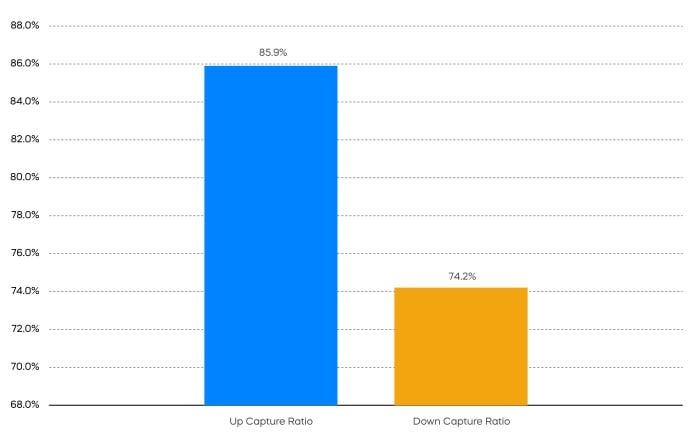
One potential solution to consider is a dividend growth focused approach like the S&P Technology Dividend Aristocrats. Like their peers from the well-known S&P 500 Dividend Aristocrats Index, the S&P Technology Dividend Aristocrats are high-quality stocks that have grown their dividends consecutively for an extended number of years. Relative to the Nasdaq-100 Index—a common proxy for growth and tech—they have delivered an attractive combination of upside and downside capture that may be just right for the times.
Fixed Income Perspectives
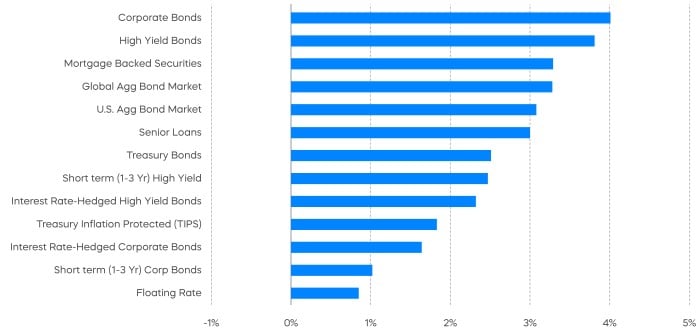
All fixed income segments were in the green for the month of January, as Treasury Yields fell and corporate bond spreads narrowed.
Breakeven Inflation Expectations
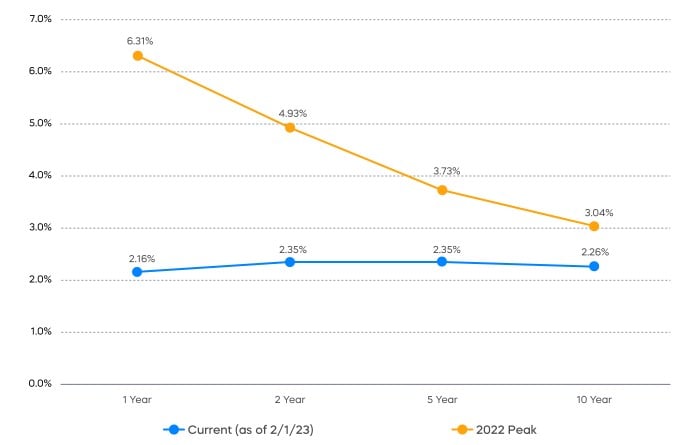
The decrease in breakeven inflation, even just one year away, to near the Fed’s 2% inflation target deserves a tentative victory lap. Chair Powell was careful to point out that if the current run-rate of inflation doesn’t follow suit, those expectations could rise, but the path seems to be a solid one.
The Treasury yield curve now peaks just six months from now—roughly the market’s assessment of a peak in Fed Funds. Holders of longer-duration Treasurys shouldn’t get too excited about a Fed retreat just over the horizon. The recent rally in longer-duration Treasurys may have already run its course.
The long-term average real yield on the 10-Year U.S. Treasury is about 2%, now that Quantitative Tightening is well on its way to allowing longer-term Treasury yields to find their “natural” level. The simple of math of 2+2 (2% inflation plus 2% real yield) points to a 4% 10-Year Treasury yield. We saw a high of 4.22% last October, and the current rally has brought us to just below 3.5%. That may define the range for a while, leaving coupon clipping the most likely outcome for Treasury investors in 2023.
The different market segments represented in the performance recap charts use the following indexes: U.S. Large Cap: S&P 500 TR; U.S. Large Cap Growth: S&P 500 Growth TR; U.S. Large Cap Value: S&P 500 Value TR; U.S. Mid Cap: S&P Mid Cap TR; U.S. Small Cap: Russell 2000 TR; International Developed Stocks: MSCI Daily TR NET EAFE; Emerging Markets Stocks: MSCI Daily TR Net Emerging Markets; Global Infrastructure: Dow Jones Brookfield Global Infrastructure Composite; Commodities: Bloomberg Commodity TR; U.S. Bonds: Bloomberg U.S. Aggregate; U.S. High Yield: Bloomberg Corporate High Yield; International Developed Bonds: Bloomberg Global Agg ex-USD; Emerging Market Bonds: DBIQ Emerging Markets USD Liquid Balanced.
The S&P 500 is a benchmark index published by Standard & Poor's (S&P) representing 500 companies with large-cap market capitalizations. The S&P 500 Dividend Aristocrats Index targets companies that are currently members of the S&P 500 that have increased dividend payments each year for at least 25 years. The S&P Technology Dividend Aristocrats is a benchmark index published by Standard & Poor's (S&P) representing technology companies that have increased dividend payments each year for at least seven years. The Nasdaq-100 Index is a basket of the 100 largest, most actively traded U.S companies listed on the Nasdaq stock exchange. THESE ENTITIES AND THEIR AFFILIATES MAKE NO WARRANTIES AND BEAR NO LIABILITY WITH RESPECT TO PROSHARES.
This is not intended to be investment advice. Indexes are unmanaged, and one cannot invest directly in an index. Past performance does not guarantee future results.
Any forward-looking statements herein are based on expectations of ProShare Advisors LLC at this time. Whether or not actual results and developments will conform to ProShare Advisors LLC’s expectations and predictions, however, is subject to a number of risks and uncertainties, including general economic, market and business conditions; changes in laws or regulations or other actions made by governmental authorities or regulatory bodies; and other world economic and political developments. ProShare Advisors LLC undertakes no duty to update or revise any forward-looking statements, whether as a result of new information, future events or otherwise.
Investing is currently subject to additional risks and uncertainties related to COVID-19, including general economic, market and business conditions; changes in laws or regulations or other actions made by governmental authorities or regulatory bodies; and world economic and political developments.
Investing involves risk, including the possible loss of principal. This information is not meant to be investment advice.
The “S&P 500®,” “S&P 500® Dividend Aristocrats® Index” and “S&P Technology Dividend Aristocrats Index” are products of S&P Dow Jones Indices LLC and its affiliates and have been licensed for use by ProShare Advisors LLC. "S&P®" is a registered trademark of Standard & Poor’s Financial Services LLC (“S&P”), and “Dow Jones®" is a registered trademark of Dow Jones Trademark Holdings LLC (“Dow Jones”) and they have been licensed for use by S&P Dow Jones Indices LLC and its affiliates. Nasdaq® is a registered trademark of Nasdaq, Inc. and is licensed for use by ProShare Advisors LLC. ProShares ETFs based on these indexes are not sponsored, endorsed, sold or promoted by these entities or their affiliates, and they make no representation regarding the advisability of investing in ProShares ETFs. THESE ENTITIES AND THEIR AFFILIATES MAKE NO WARRANTIES AND BEAR NO LIABILITY WITH RESPECT TO PROSHARES.