Lower Treasury Yields Equal Higher P/E’s
KEY OBSERVATIONS

November was a great month for stocks and bonds. The S&P 500® was up 5.6% and the U.S. aggregate bond index was up 3.8%. What’s behind this unexpected combination?
Mathematically, bond prices went up because yields went down. December saw the U.S. 10-year Treasury yield fall from 4.1% to 3.6%. That’s the kind of interest rate move—and increase in the price of bonds—that’s generally supposed to offset falling stock prices and provide some diversification.
Stocks rallied, however. The math here is also straightforward. Lower Treasury yields typically drive Price-to-Earnings (P/E) multiples higher, because future earnings are discounted at a lower interest rate. The S&P 500’s P/E ratio went from 18.7X at the beginning of the month to 19.7X at the end of the month. That means that roughly 5.3% of the S&P 500’s 5.6% gain came from the higher P/E. S&P 500 earnings barely budged, and if earnings don’t budge, stocks can act much like bonds. But that is a big if.
Chart of the Month
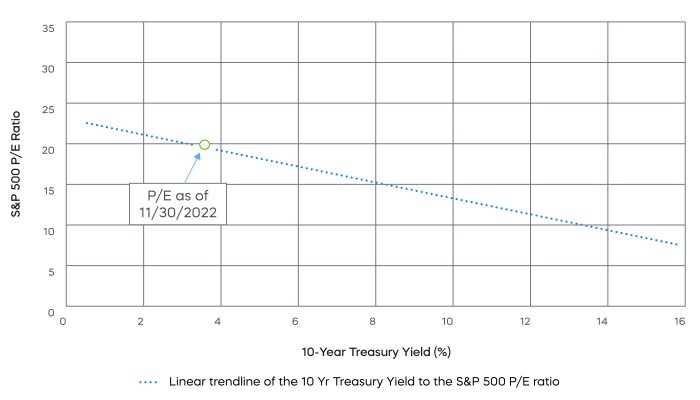
Over just a one-month period, whether looking backwards or forwards, corporate earnings and earnings expectations might not move much. However, falling bond yields over longer periods of time can be associated with falling stock prices, because those falling bond yields can reflect deteriorating economic conditions that drive down corporate earnings. Under such conditions, P/E ratios may rise, but not stock prices.
Here are two takeaways as we head into 2023. First, there may not be much left of this bond rally—particularly for longer-term bonds. Second, even if low or falling bond yields support high P/E’s, earnings could be very important in 2023.
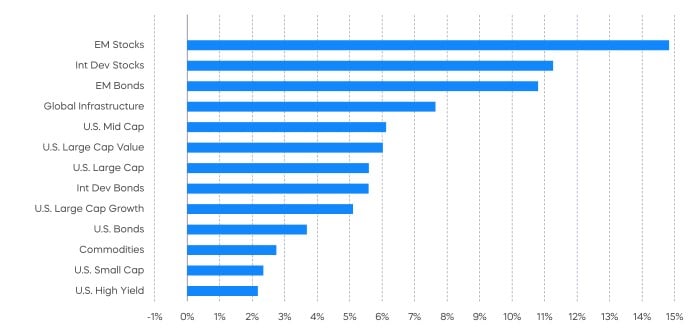
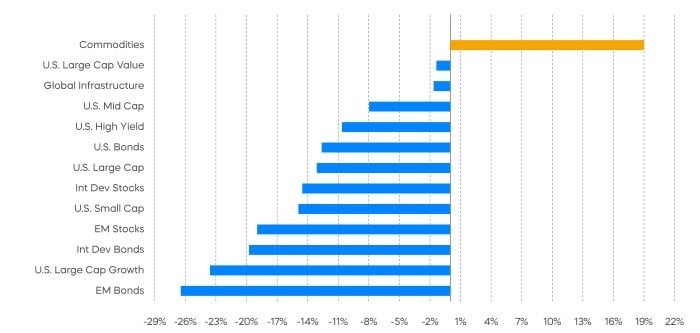
Performance Recap
Most market segments were solidly green for the month of November.
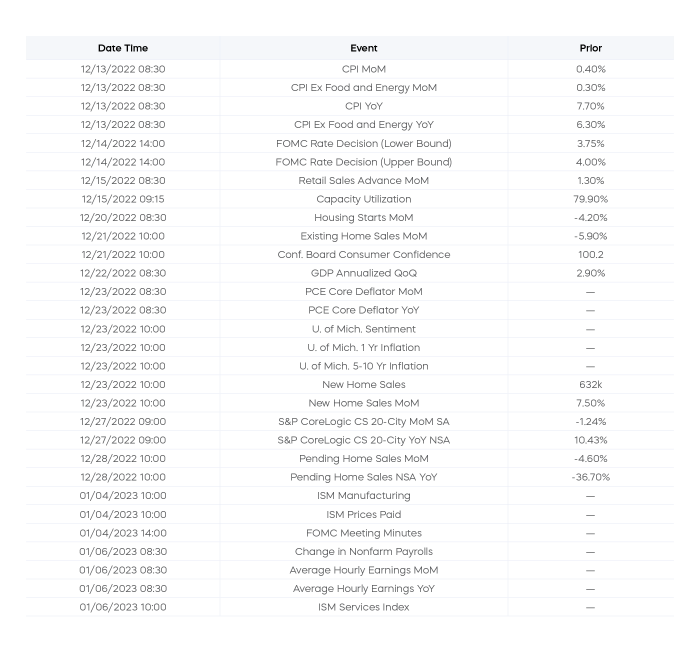
Here’s a list of upcoming key economic releases, which can serve as a guide to potential market indicators.
EQUITY PERSPECTIVES

November delivered widespread gains for stocks across just about all market caps, sectors and styles. Even growth stocks—which remain deeply in the red for the year overall—delivered positive performance in November. A few notable developments helped fuel the rally.
The latest CPI release provided evidence that we may be past peak inflation. Also, yields have fallen substantially since peaking in late October. For example, the 10-year Treasury yield has fallen approximately 50 basis points after topping out at 4.22%. And finally, to close the month, Fed Chair Powell indicated that smaller Fed rate hikes could be ahead, starting as soon as December.
Is the rally sustainable though? While historically this has been a seasonally strong period for stock returns, caution remains warranted. From a technical perspective, the current rally has the S&P 500 right at its 200-day moving average—a notable development. But the prior two times this year when the S&P attempted to break through this level, it was turned away. Technicals aside, two factors are likely to have an outsize impact on the markets for the foreseeable future: the Fed and fundamentals.
Despite indicating a slower pace, Fed Chair Powell reminded investors that rates will remain restrictive for longer. On the fundamentals side, earnings have been weakening along with margins. We believe dividend growth strategies, which have been amongst the market’s few bright spots, may continue to be well positioned going forward.
Growth and technology stocks have been amongst the worst performing market segments this year. In fact, the S&P Growth Index’s losses of almost 24% through November remain the market’s laggard in terms of style. But does a potential end to the Fed hiking cycle provide an entry point?
Perhaps, but be selective in your approach. With rates expected to be higher for a longer time, we think the high-valuation/profits-optional style of growth investing, which thrived when rates were near zero, is unlikely to return anytime soon. Instead, investors may want to focus on growth companies with actual profits and cash flows that may be at discounted valuations.
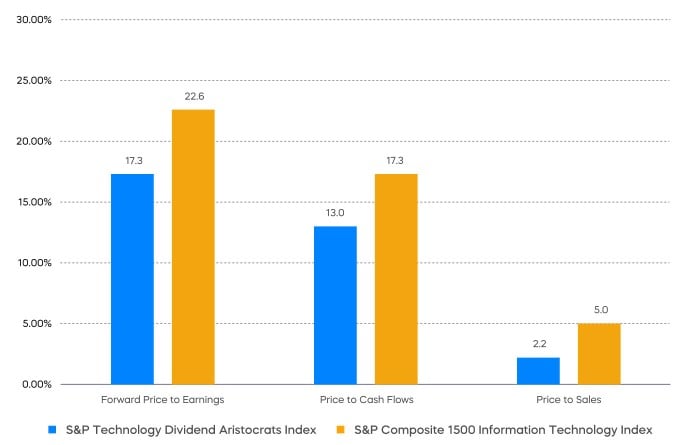
One approach to consider in a choppy market is the S&P® Technology Dividend Aristocrats®. While some investors may not associate technology with dividends, now may be the time.
Not only has the technology sector been the market's largest source of dividends, but it has also been the sector growing its dividends at the fastest rate (Source: FactSet, 12/1/21–12/31/21). That growth has been possible because of abundant profits and free cash flow. All 40 members of the Technology Dividend Aristocrats, which are required to have grown their dividends for a minimum of seven consecutive years, have been profitable. Many in the broader technology sector haven’t been. The Technology Dividend Aristocrats delivered just over 10% earnings growth for the third quarter and are projected to deliver 8% growth for the year, with both measures well ahead of the broad market. They are also trading at attractive valuations. Add up these factors, and we believe that profitable, reasonably priced, dividend growing technology stocks could be a compelling opportunity.
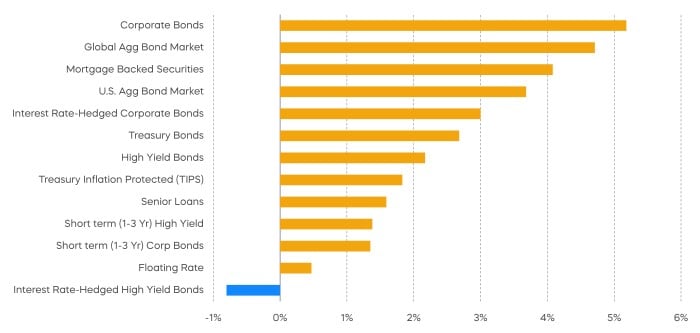
Fixed Income Commentary
Virtually all fixed-income segments were in the green for the month of November, as Treasury yields fell, and corporate bond spreads narrowed.
Much as stocks and bonds often move in opposite directions, historically, corporate bond spreads move in the opposite direction of Treasury yields. Since falling Treasury yields often accompany weak economic conditions, corporate bond spreads typically widen to reflect a more challenging repayment environment. What happened in November? The distinctly different behavior of investment-grade spreads and high-yield spreads provides some insight.
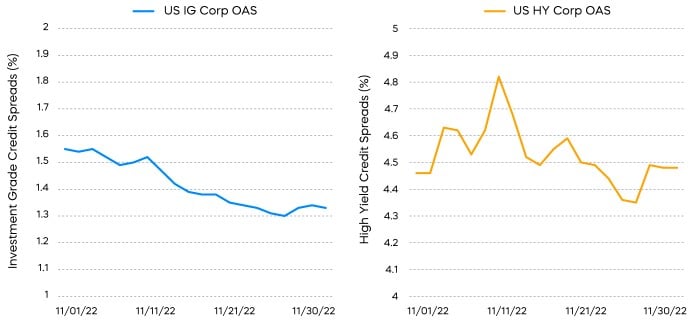
Investment-grade spreads narrowed but high-yield spreads did not. Most corporate bonds are fixed-coupon bonds. Much like fixed-rate mortgages, fixed-coupon bond payments don’t change. Let’s imagine that there is a mild recession in 2023. Some persistent inflation may drive top-line sales growth for many companies, while bottom-line earnings may shrink if costs rise more than revenues. However, those fixed-coupon bond payments get a little easier to pay off. In personal terms, a few years of inflation can make an individual’s mortgage the least of their worries, while they might struggle to afford a vacation.
Here’s where that distinction between investment-grade and high-yield spreads can be illuminating. Investment-grade borrowers have much more cushion to pay off their debts than high-yield borrowers. So even if margins shrink, they can still be “inflating away” their debt. High-yield borrowers with much less cushion may see shrinking margins not just reduce their earnings, but also put stress on their ability to make their debt payments.
Sources for data and statistics: Bloomberg, FactSet, Morningstar, and ProShares.
The different market segments represented in the performance recap charts use the following indexes: U.S. Large Cap: S&P 500 TR; U.S. Large Cap Growth: S&P 500 Growth TR; U.S. Large Cap Value: S&P 500 Value TR; U.S. Mid Cap: S&P Mid Cap TR; U.S. Small Cap: Russell 2000 TR; International Developed Stocks: MSCI Daily TR NET EAFE; Emerging Markets Stocks: MSCI Daily TR Net Emerging Markets; Global Infrastructure: Dow Jones Brookfield Global Infrastructure Composite; Commodities: Bloomberg Commodity TR; U.S. Bonds: Bloomberg U.S. Aggregate; U.S. High Yield: Bloomberg Corporate High Yield; International Developed Bonds: Bloomberg Global Agg ex-USD; Emerging Market Bonds: DBIQ Emerging Markets USD Liquid Balanced.
The S&P 500 is a benchmark index published by Standard & Poor's (S&P) representing 500 companies with large-cap market capitalizations. The S&P 500 Dividend Aristocrats Index targets companies that are currently members of the S&P 500 that have increased dividend payments each year for at least 25 years. The S&P 500 Growth Index serves as a proxy for growth companies included in the S&P 500, identifying them using three factors: sales growth, the ratio of earnings change to price, and momentum. The S&P Technology Dividend Aristocrats is a benchmark index published by Standard & Poor's (S&P) representing technology companies that have increased dividend payments each year for at least seven years. THESE ENTITIES AND THEIR AFFILIATES MAKE NO WARRANTIES AND BEAR NO LIABILITY WITH RESPECT TO PROSHARES.
This is not intended to be investment advice. Indexes are unmanaged, and one cannot invest directly in an index. Past performance does not guarantee future results.
Any forward-looking statements herein are based on expectations of ProShare Advisors LLC at this time. Whether or not actual results and developments will conform to ProShare Advisors LLC’s expectations and predictions, however, is subject to a number of risks and uncertainties, including general economic, market and business conditions; changes in laws or regulations or other actions made by governmental authorities or regulatory bodies; and other world economic and political developments. ProShare Advisors LLC undertakes no duty to update or revise any forward-looking statements, whether as a result of new information, future events or otherwise.
Investing is currently subject to additional risks and uncertainties related to COVID-19, including general economic, market and business conditions; changes in laws or regulations or other actions made by governmental authorities or regulatory bodies; and world economic and political developments.
Investing involves risk, including the possible loss of principal. This information is not meant to be investment advice.
The “S&P 500®" and “S&P® Technology Dividend Aristocrats® Index” are products of S&P Dow Jones Indices LLC and its affiliates and have been licensed for use by ProShares. "S&P®" is a registered trademark of Standard & Poor’s Financial Services LLC (“S&P”), and “Dow Jones®" is a registered trademark of Dow Jones Trademark Holdings LLC (“Dow Jones”) and they have been licensed for use by S&P Dow Jones Indices LLC and its affiliates. ProShares based on these indexes are not sponsored, endorsed, sold or promoted by these entities or their affiliates, and they make no representation regarding the advisability of investing in ProShares. THESE ENTITIES AND THEIR AFFILIATES MAKE NO WARRANTIES AND BEAR NO LIABILITY WITH RESPECT TO PROSHARES.