Key Observations
August kicked off with a surprise. A weak labor report sent bonds rallying across the entire yield curve. The market’s takeaway seemed to follow a familiar narrative: a weakening economy increases the odds of rate cuts by the Federal Reserve, and those cuts will push down both short- and long-term interest rates. But markets aren’t that simple, and yields don’t have to move in lockstep. The yield curve can steepen, flatten, or even see short- and longer-term yields move in opposite directions. In fact, much of the behavior where short- and long-term interest rates generally moved in the same direction was shaped by Quantitative Easing. As the bond market navigates the post-QE era, its next move may not follow the same script.
Some recent history: Prior to the Great Financial Crisis, the Fed controlled the fed funds rate, but across the yield curve, all other interest rates were determined by market forces. Starting in late 2008, Quantitative Easing—the purchasing of longer-term bonds by the Fed—let central bankers intercede in the bond market and push longer term interest rates down. Those combined tools—QE plus the fed funds rate—were hugely powerful, and did indeed simultaneously drive down interest rates across the curve. Fast forward to just a few years ago. With the economy emerging from the pandemic, the Fed began raising rates while working to unwind Quantitative Easing by selling longer-term bonds, a process referred to as Quantitative Tightening. As a result, interest rates rose across the curve.
QE or Not QE... 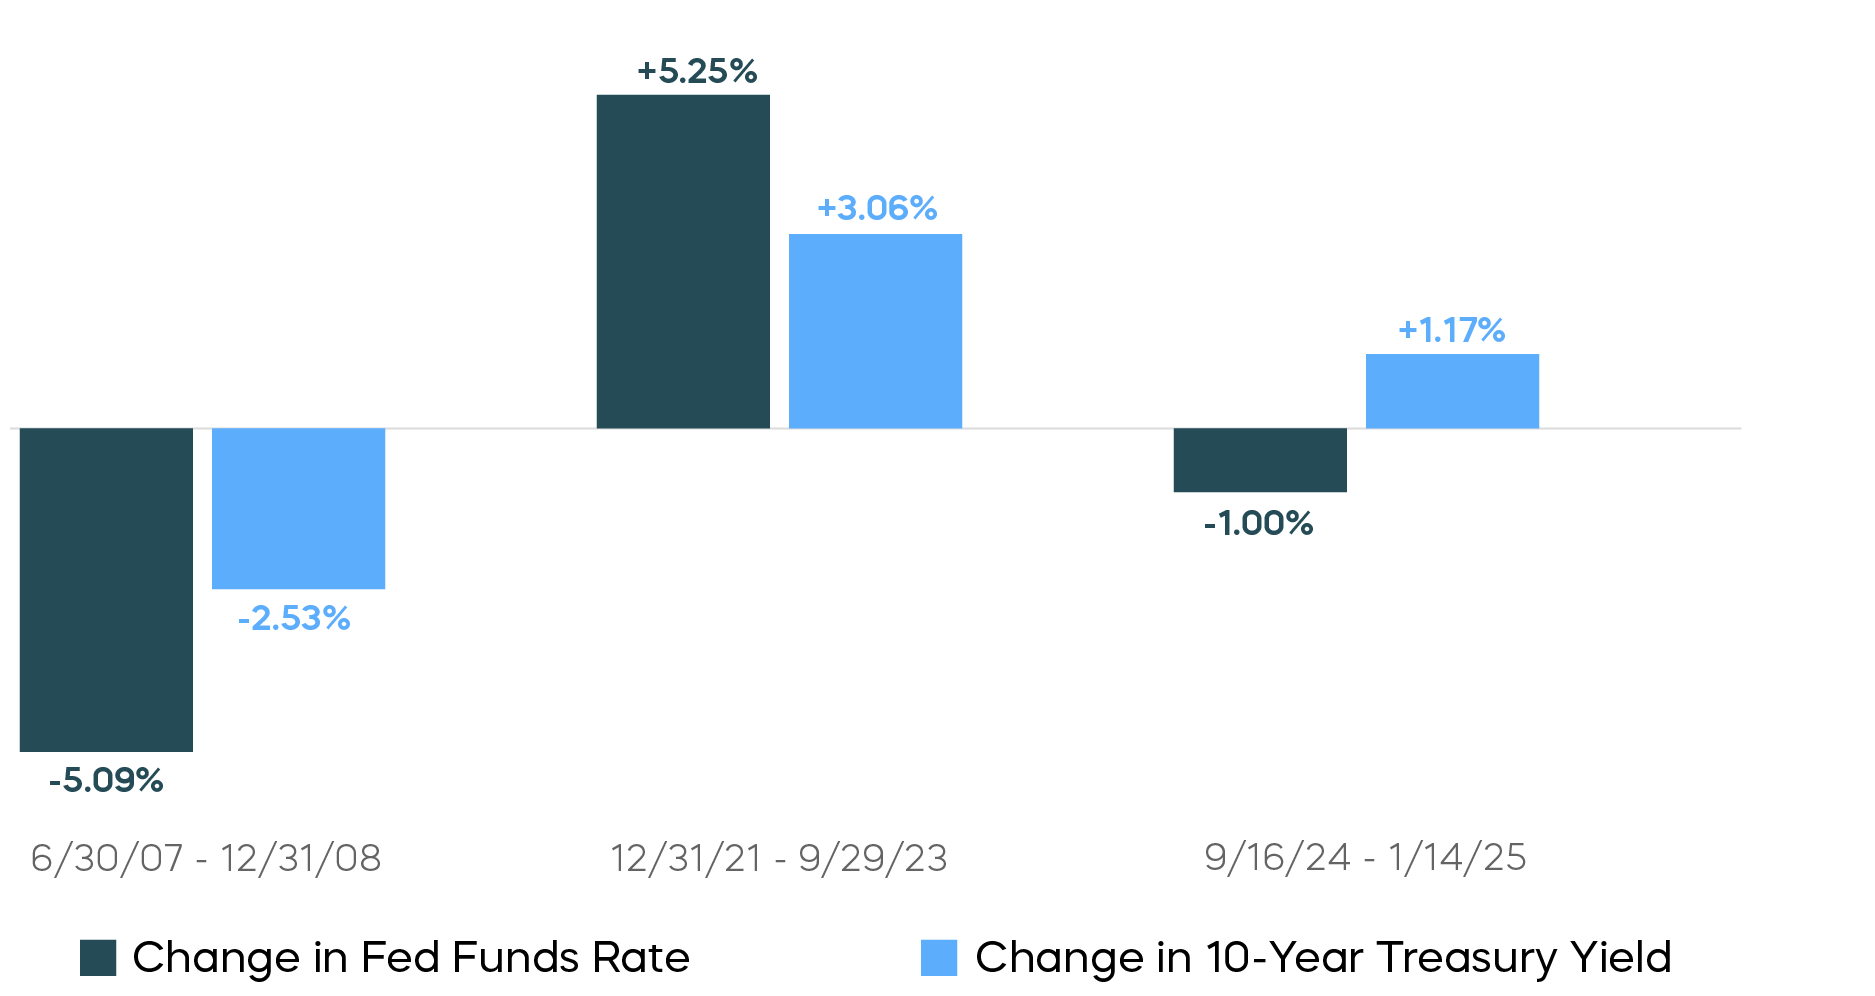 Source: Bloomberg. Data as of 8/7/25.
What’s the duality today? Will short- and long-term yields move together or diverge? We see some evidence of the latter. Particularly after a bit of a rally in longer-term bonds, if the Fed cuts rates and stimulates the economy, longer term interest rates may rise a bit. Also, let’s not forget that the day before this month’s jobs report surprise, inflation—measured by the PCE price index—came in hot. And what about those tariffs?
Lastly, for those who doubt divergence can take place, well, it just did. In the second half of 2024, when the Fed cut the fed funds rate by 100 bps, it was met by a roughly 100 bps rise in the 10-year Treasury yield. That is why we suggest looking beyond bonds to equity income opportunities.
But here’s the other side of the coin: Longer-term Treasury yields are no longer near zero. And if the latest job report turns out to be a harbinger of a weak economy or recession, then Fed cuts could be met with falling longer-term yields, and bond prices could rise, allowing bonds, for the first time in a long time, to diversify equity risk.
Asset Class Perspectives
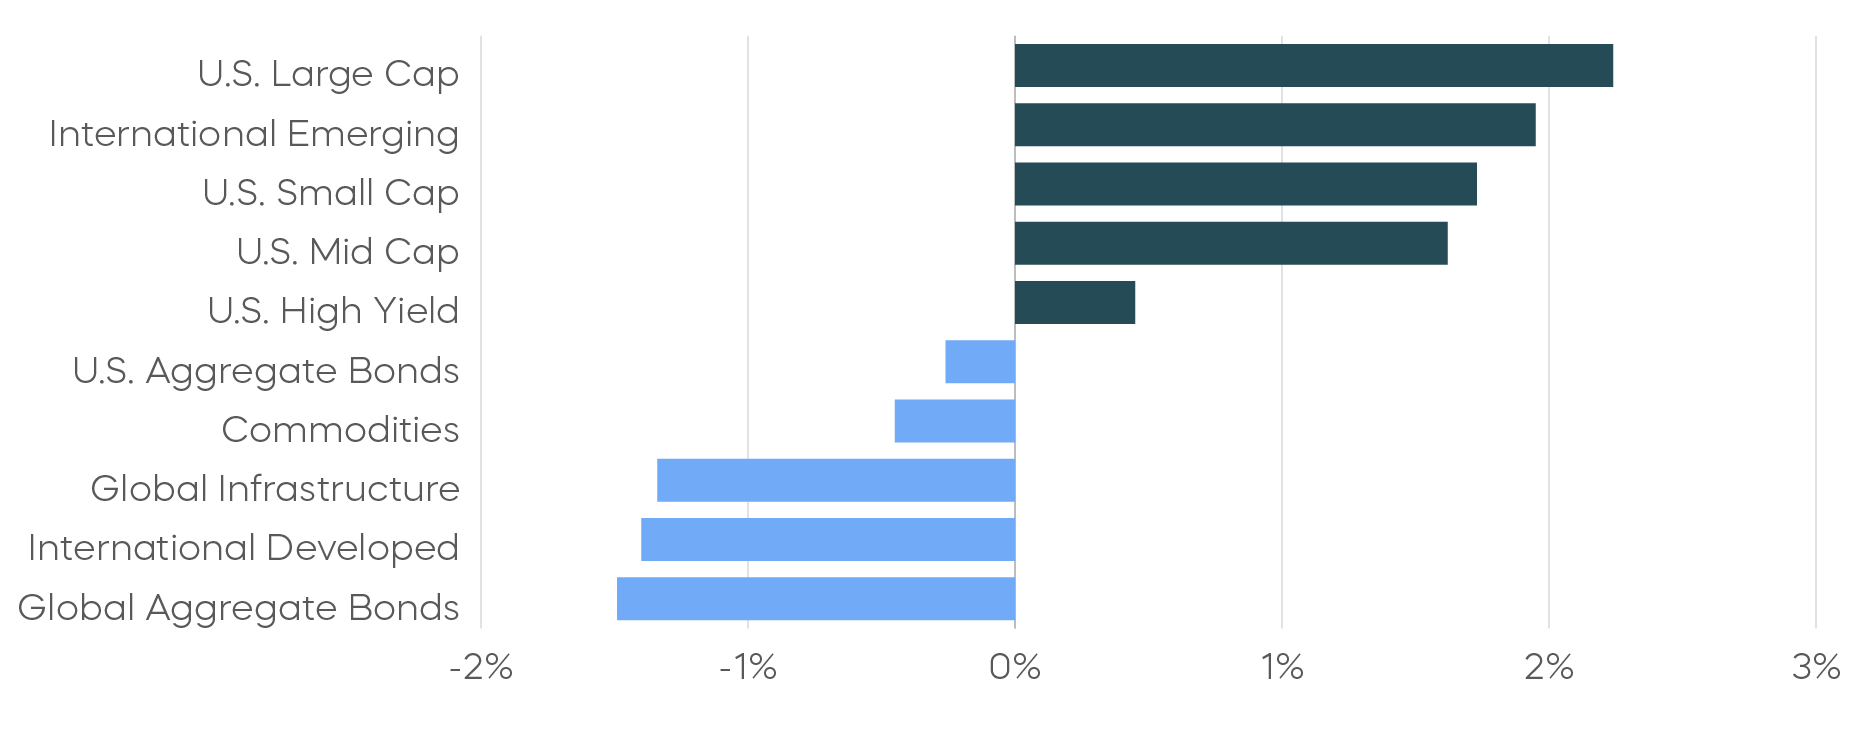
Asset Class Returns—July 2025
Asset Class Returns—Year-to-Date
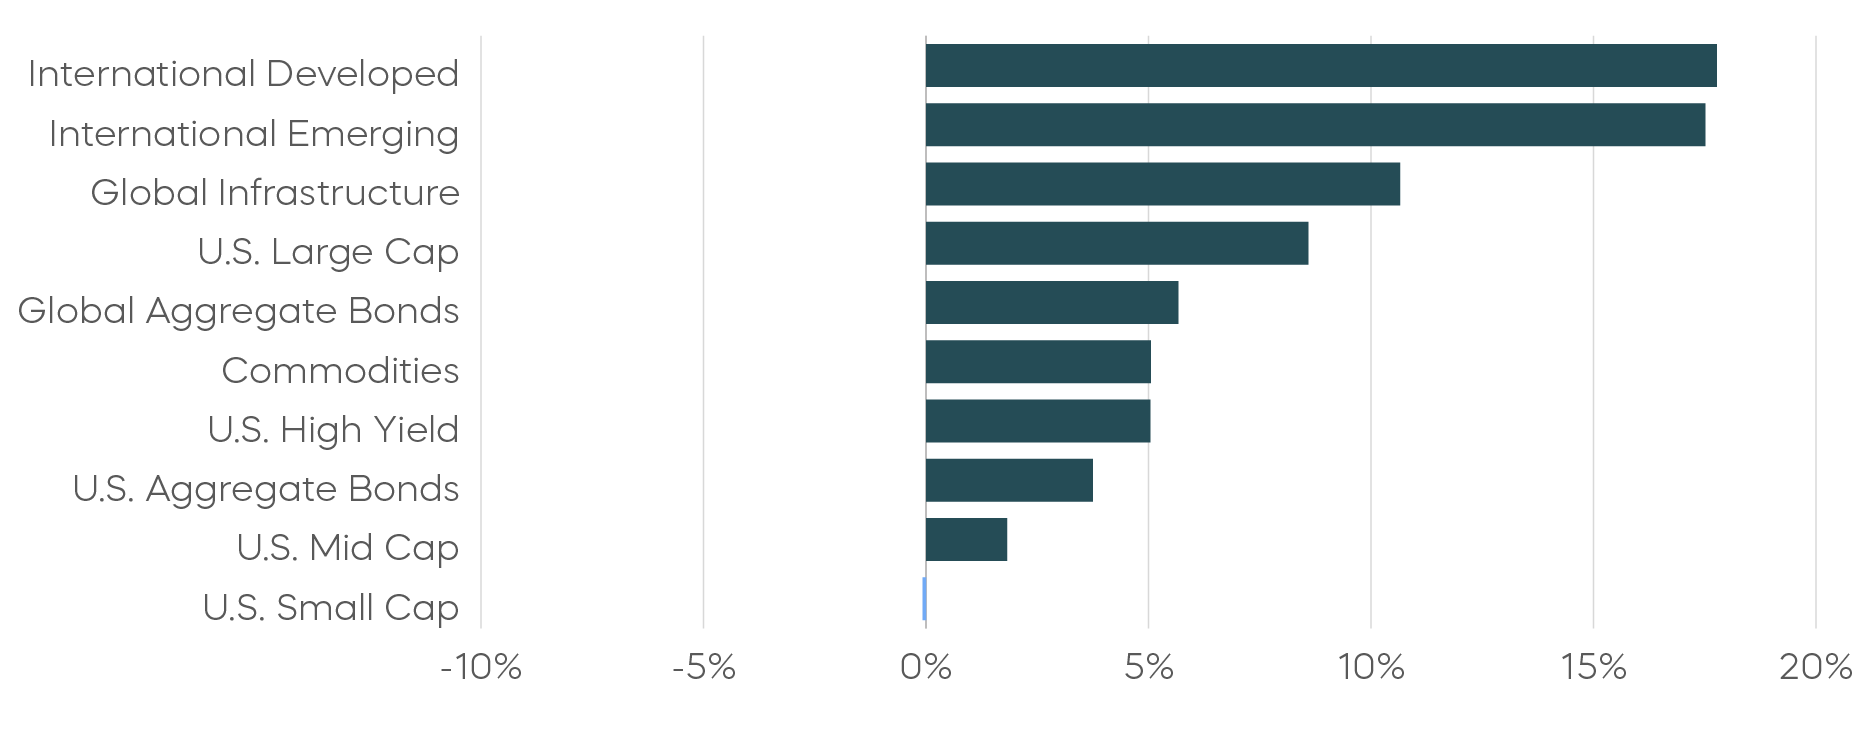
Source: Bloomberg. July returns 7/1/25–7/31/25; year-to-date returns 1/1/25‒7/31/25. Index returns are for illustrative purposes only and do not reflect any management fees, transaction costs or expenses. Indexes are unmanaged, and one cannot invest directly in an index. Past performance does not guarantee future results.
The following are observations on a range of asset classes. For each, green indicates a constructive backdrop, yellow indicates a neutral environment, and red would indicate a challenging backdrop. 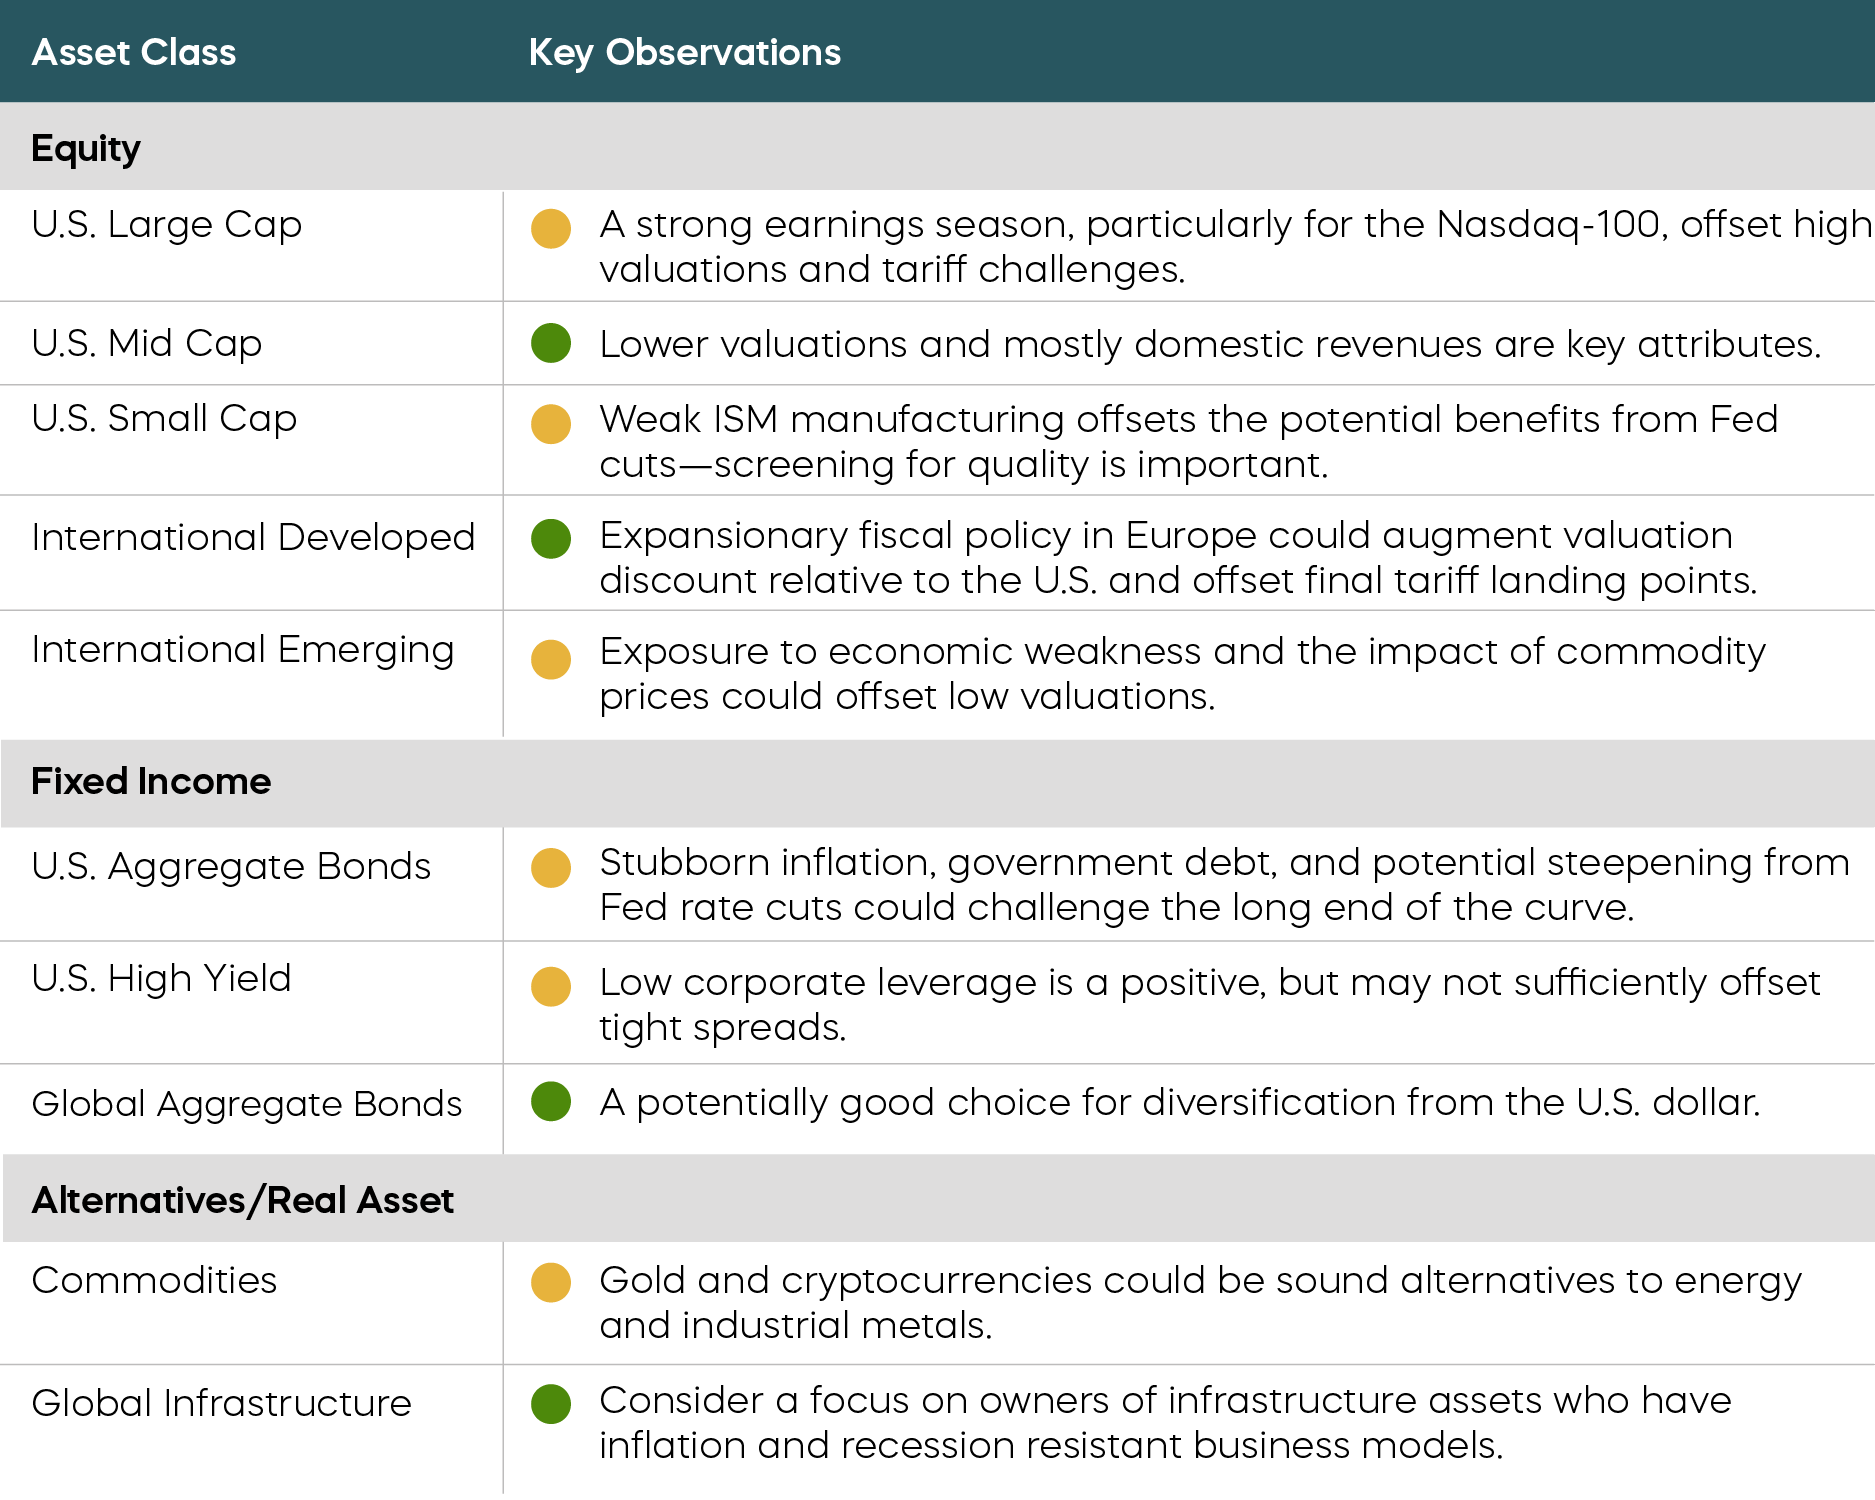
Economic Calendar
 Source: Bloomberg. Data as of 8/4/25.
Equity Perspectives
A Modern-Day Growth and Income Approach
Follow the Earnings Growth
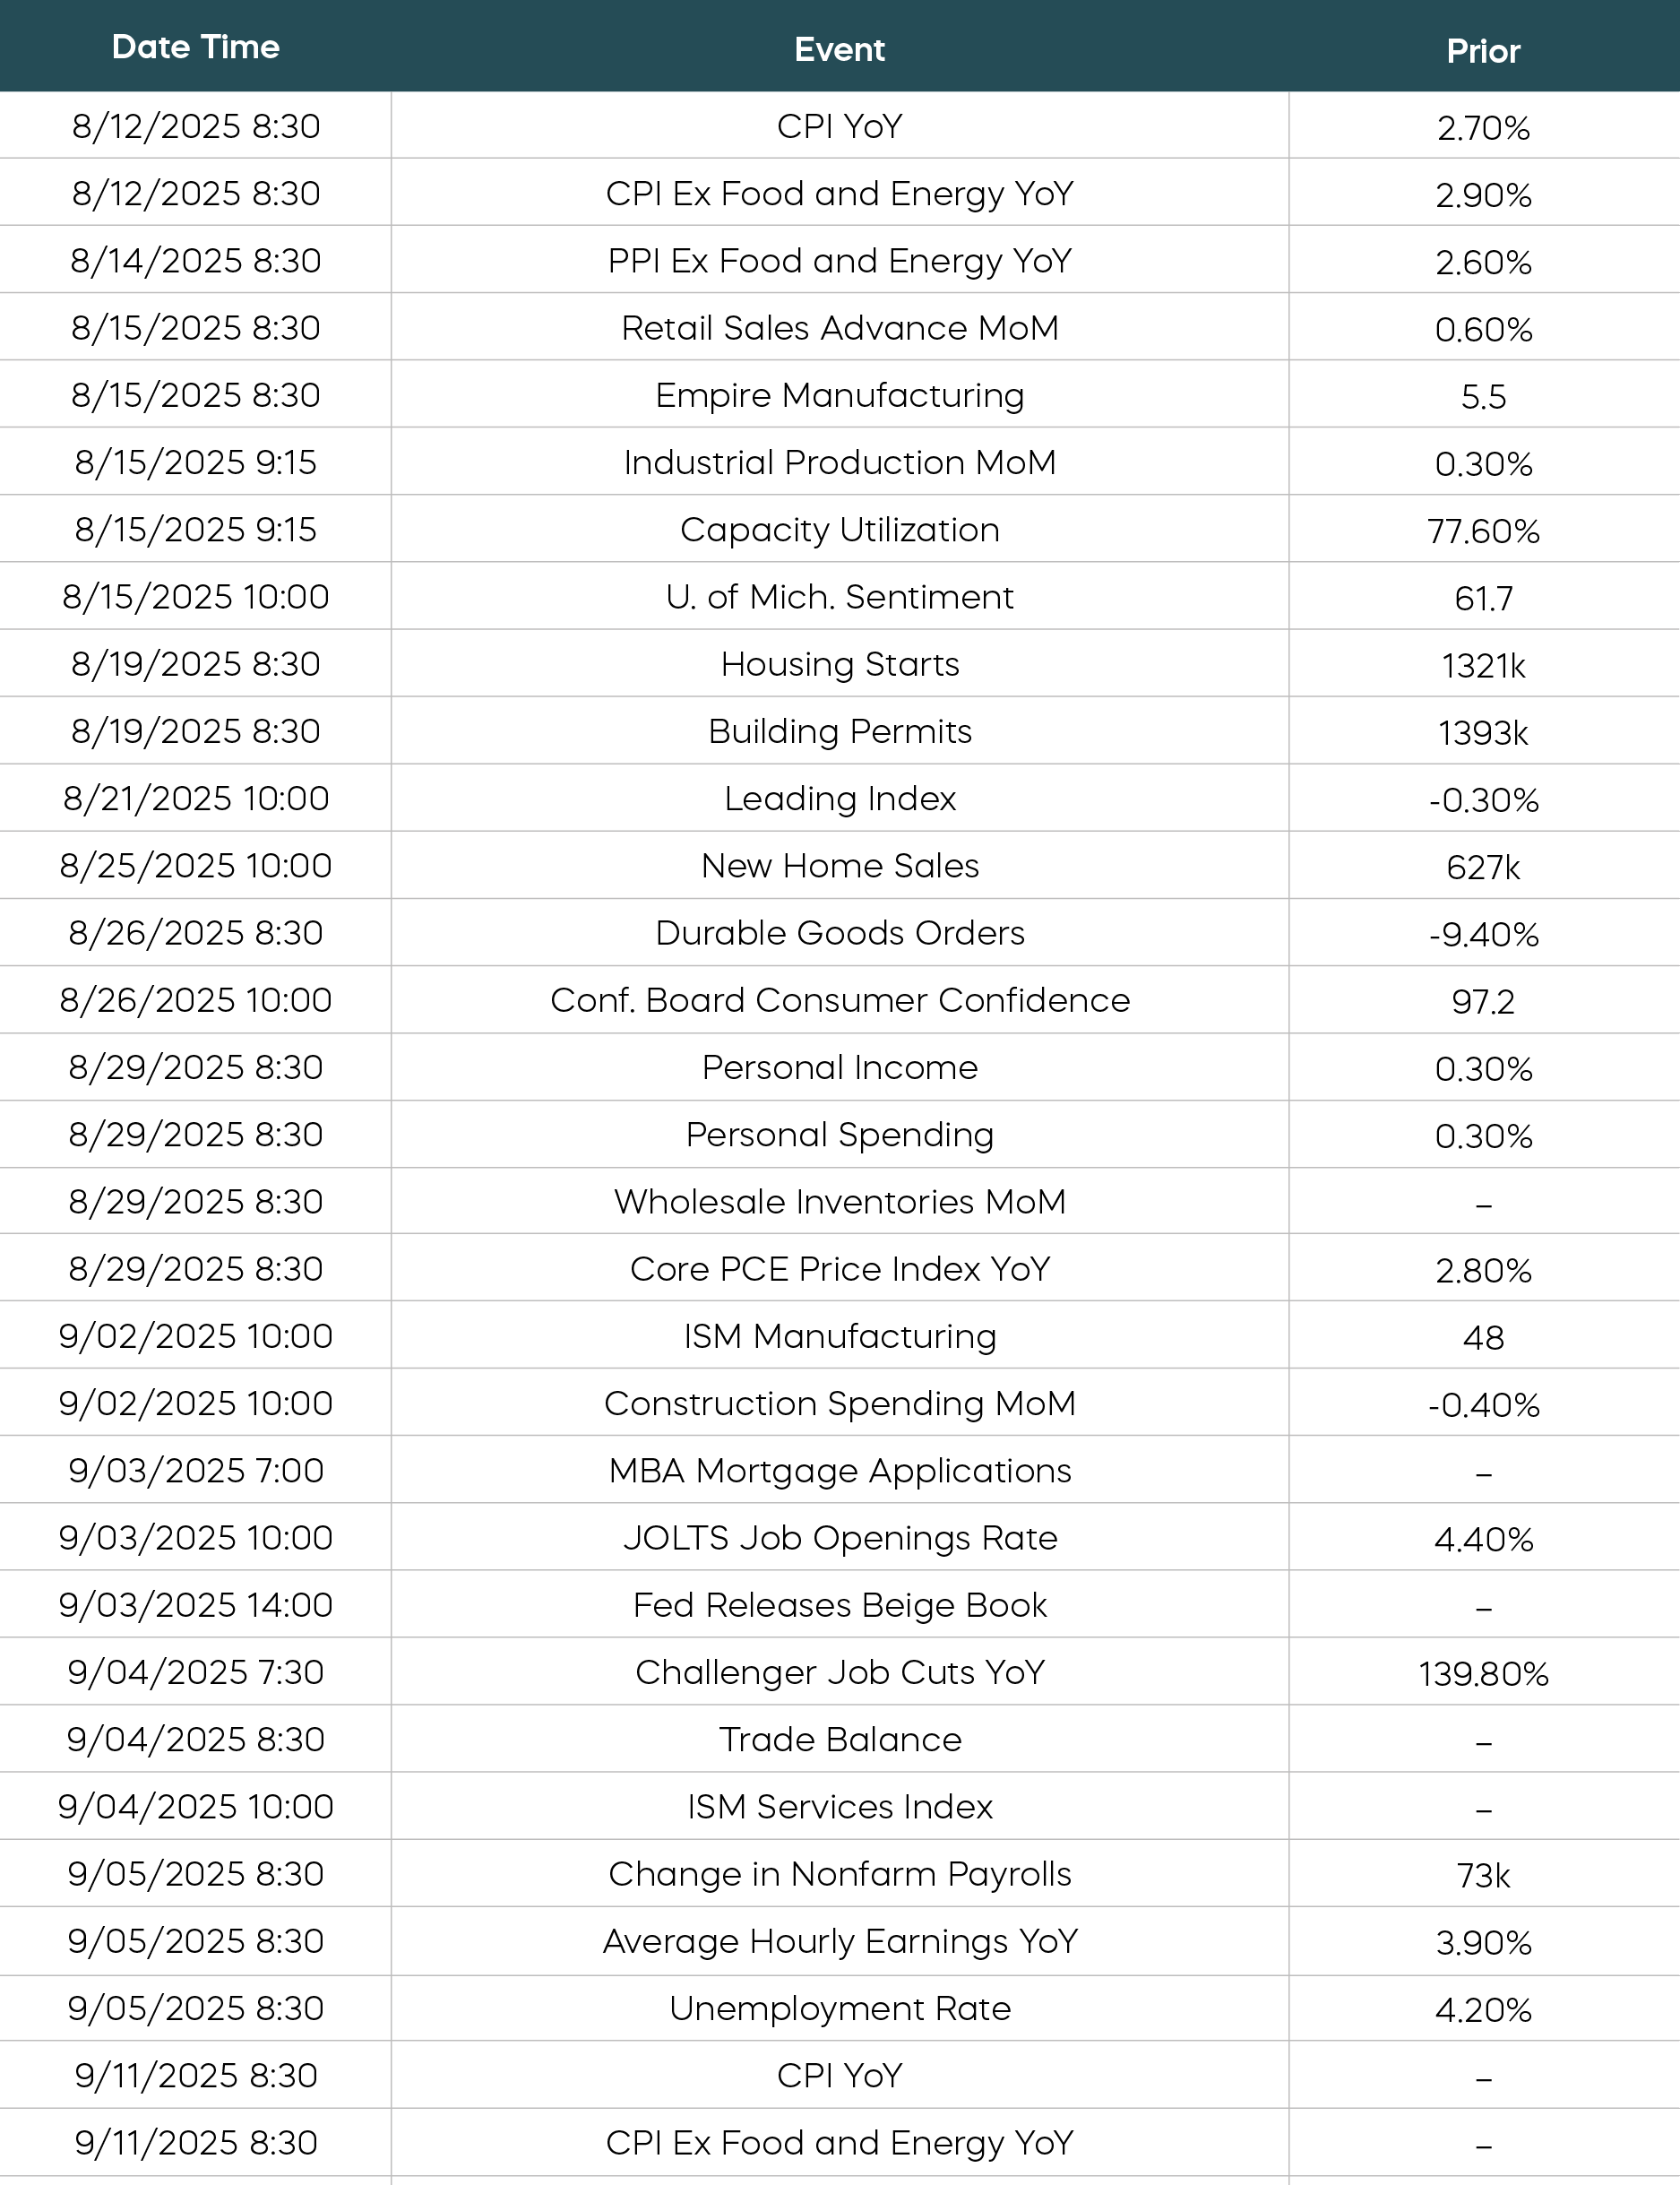
Strong fundamentals, specifically earnings, supported our optimistic second-half view for equities in last month’s Mid-Year Outlook. While we’ve seen some downward revisions since the start of the year, year-over-year growth has generally remained positive, and that resilience should be a big takeaway as we make our way through Q2 earnings season. But there are nuances beyond the headlines that investors need to understand.
The S&P 500 is expected to deliver earnings growth of 10.3% in the second quarter. Small cap stocks, however, have struggled and are expected to deliver a meager 1.6% growth, as measured by the S&P SmallCap 600 Index. The standout market segment has been the Nasdaq-100, which is expected to deliver an eye-popping 31.7% growth rate.
The Nasdaq-100 Is Expected to Deliver Outstanding Q2 Earnings Growth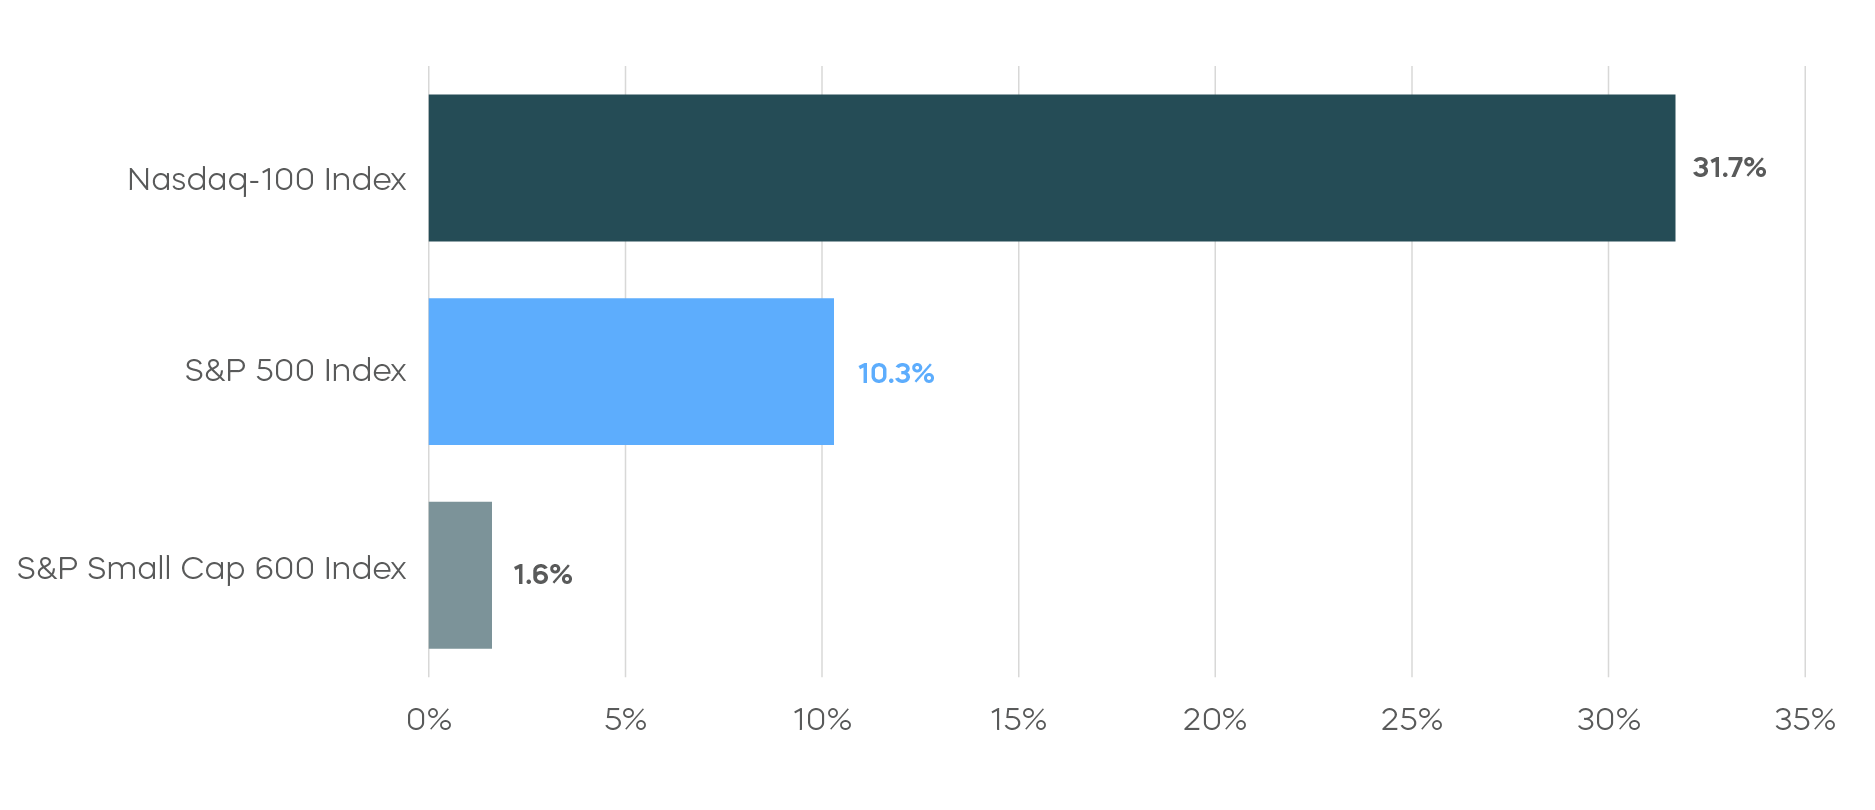 Source: FactSet. Data as of 8/1/25. Index returns are for illustrative purposes only and do not reflect any management fees, transaction costs or expenses. Indexes are unmanaged, and one cannot invest directly in an index. Past performance does not guarantee future results.
When it comes to delivering on earnings, there are clearly haves and have-nots. This dynamic has important implications for investors. According to FactSet, companies that have reported positive second-quarter earnings surprises have seen an average price increase of 2.1%, while those that missed earnings have seen average declines of 3%. Clearly, the market is paying attention this earnings season, as both of these amounts are significantly above five-year averages. Wise investors may want to follow the earnings growth.
How to Target Growth and High Income at the Same Time
Let’s look at Microsoft (MSFT), which reported positive earnings of $3.65 per share during the quarter, easily surpassing expectations, and leading the stock to pop 4% on the day after the announcement.[1] Microsoft has long been a growth juggernaut, consistently delivering double-digit increases in revenues, earnings, and free cash flows. It has also quietly evolved into one of the largest dividend payers on the planet, continuously growing its dividends since 2003. Microsoft offers a quintessential example of a growth-and-income investment, a category that for many years was dominated by mutual funds with high fees, frequent underperformance, and inefficient distributions.
Today, index-based ETFs can offer potentially more attractive opportunities for investors seeking growth and high levels of income that can grow over time.
The S&P Technology Dividend Aristocrats Index—high-quality, technology-oriented companies that have grown their dividends for a minimum of seven consecutive years—is an example of one such strategy. The tech sector is unique as it currently offers the highest revenue growth rate and profit margins among dividend-oriented sectors, which has translated to the fastest level of dividend growth. The companies of the S&P Technology Dividends Aristocrats, of which Microsoft is a member, have grown distributions at an average rate of 11.5% since 2019.[2]
Covered call strategies offer another popular option for investors looking to target both equity market appreciation and high levels of income not correlated with interest rates. But investors should choose their covered call strategy wisely.
Traditional covered call strategies—including most of those focused on the Nasdaq-100 Index—use monthly options to provide income. Monthly strategies have historically sacrificed significant returns in exchange for their high levels of income, largely defeating the point of investing in a high-growth index like the Nasdaq.
Daily Covered Call Strategies Have Captured More Returns than Traditional Strategies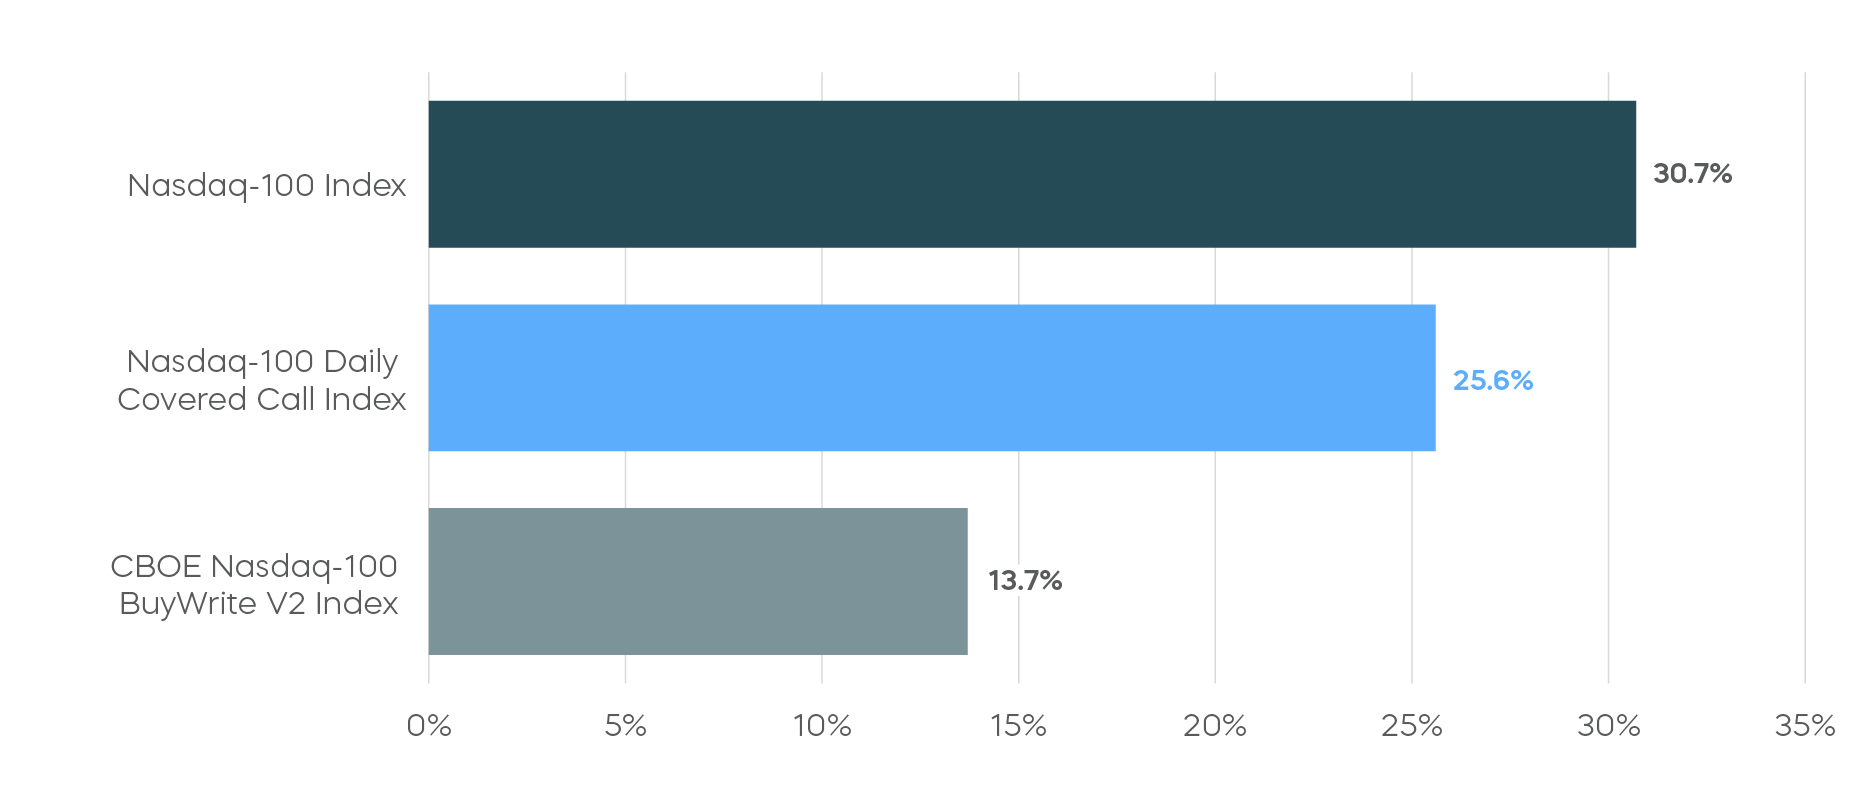 Source: Bloomberg, data as of June 30, 2025. Index returns are for illustrative purposes only and do not reflect any management fees, transaction costs or expenses. Indexes are unmanaged, and one cannot invest directly in an index. Past performance does not guarantee future results.
The Nasdaq-100 Daily Covered Call Index, of which Microsoft is a member, offers something different. Powered by a daily options strategy, investors can target both high levels of income and the total returns of the Nasdaq-100, potentially capturing the growth that traditional monthly covered call strategies have sacrificed.
Fixed Income Perspectives
Expectations or Risk Premium?
Since outlining the Federal Reserve’s dilemma about the timing of its next rate cut in our Mid-Year Outlook, there have been mounting challenges to the Fed’s independence. While the FOMC (Federal Open Market Committee) held rates unchanged in its July meeting, two governors dissented the decision. The resignation of Governor Kugler ahead of her term expiration could further escalate the debate over the Fed’s future.
Because the Fed Chair must be a sitting governor, and Chair Powell has indicated he intends to remain on the Board after his chairmanship ends, there is no other governor vacancy until 2028. Therefore, the nominee to replace Kugler could also become the nominee for Chair, with both roles presented together in a combined Senate confirmation process. This could give Fed watchers an early look at a White House-aligned nominee, but it could also expose that nominee to a longer period of political scrutiny. Given that the Senate’s current Republican majority matches the balance in 2020, Judy Shelton’s failed nomination in November 2020 may influence the White House’s decision-making.
Regardless of personnel changes, the July nonfarm payrolls report may have accelerated the timeline for rate cuts by the Fed. The significant downward revisions to prior months’ job gains point to a slowing—but not collapsing—labor market. This aligns with our previously expressed view of normalizing wage growth and potentially supports the case for a steeper yield curve.
The shape of the yield curve has important implications for expected returns. Specifically, as a bond matures, the bond’s price could increase if it’s valued at a lower interest rate on a different part of the yield curve, generating a positive roll-down return. Today’s yield curve slopes downward at the front end and upward at the back end. Let’s explore a couple of potential scenarios for this type of curve.
Under what’s called the Pure Expectations Hypothesis (PEH), long-term rates reflect the expected path of future short-term rates. So, a long position in the 2-year would benefit from a lower rate in six months as it rolls down to a 1.5-year maturity. Meanwhile, a short position in the 20-year would experience little rate movement, leading to a positive roll-down return from a steepening trade.
By contrast, the Pure Risk Premium Hypothesis (PRPH) assumes there are no embedded expectations of future short-term rates in the current yield curve. Under this scenario, the long 2-year position would suffer from a higher rate in six months, and the short 20-year position would be hurt by a slightly lower rate. This would result in a negative roll-down return from a steepening trade.
Current 2-Year Interest Rate vs. Implied 1.5-Year Rate 
Current 20-Year Interest Rate vs. Implied 19.5-Year Rate 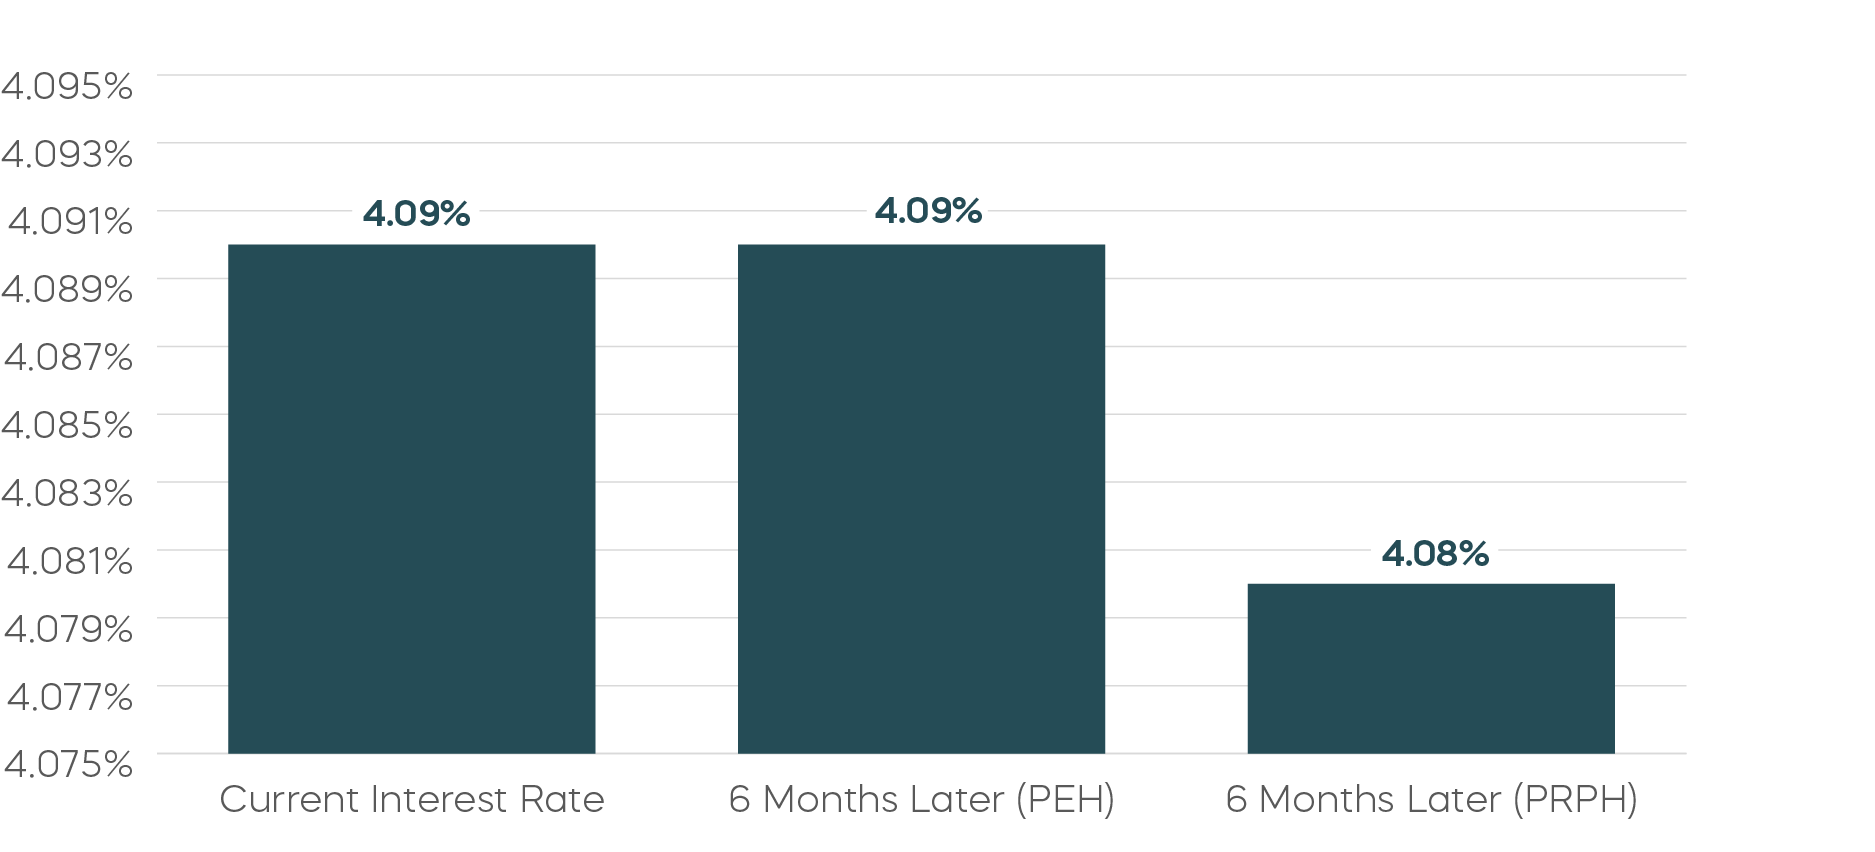 Source: Bloomberg. USD SOFR Swap zero rates as of 8/1/2025.
The current yield curve seems to align more closely with the assumptions of the PEH. The inversion at the front end of the curve appears to price in anticipated rate cuts over the next several years, while the back end remains relatively flat. This reinforces the case for a gradual steepening bias. With the yield curve shaped the way it is today, investors may benefit by owning shorter-dated bonds that can deliver returns through roll-down, even if interest rates remain unchanged.
Fixed Income Returns—July 2025 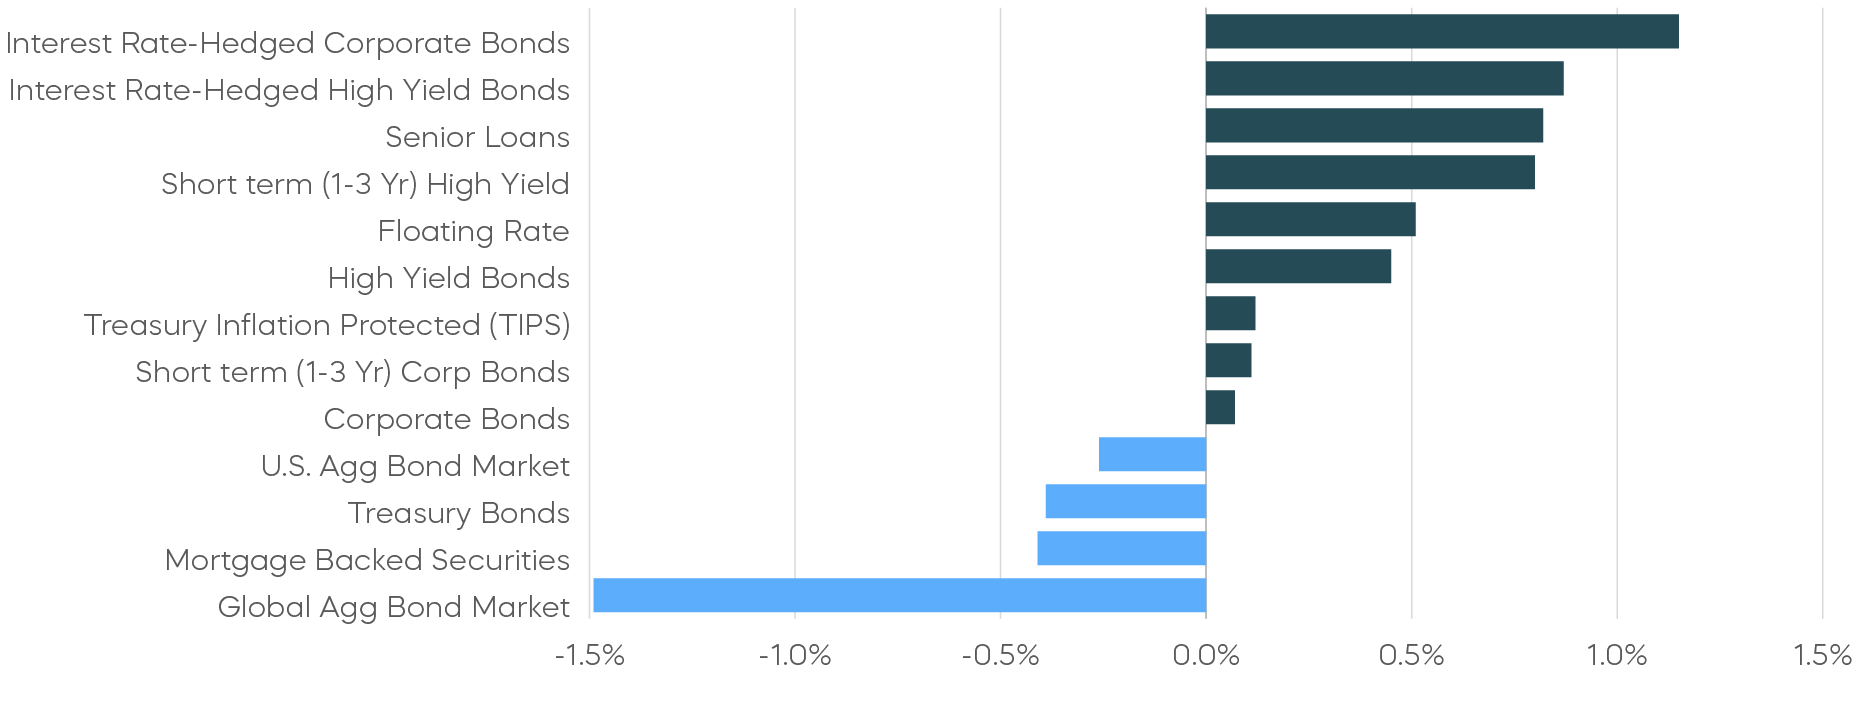 Source: Bloomberg. July returns 7/1/25–7/31/25. Index returns are for illustrative purposes only and do not reflect any management fees, transaction costs or expenses. Indexes are unmanaged, and one cannot invest directly in an index. Past performance does not guarantee future results.
[1] Source: FactSet and Bloomberg. MSFT reported earnings after the bell on 7/30/25 and its stock rose 3.95% on 7/31/25.
[2] Source: ProShares calculations.