
The Course of Dividends So Far
As expected, dividend cuts have begun. We used the term “dividend paradox” in our previous Dividend Viewpoint article referring to our historical observation that dividends, which have always been a major contributor to total S&P 500 returns, have actually been responsible for the majority of stock returns in difficult times (e.g., during the 1970s). And this was despite the fact that difficult times are precisely when companies might be most compelled to cut or eliminate their dividends. So it behooves investors—both those focused on dividend income and those focused on total return—to pay attention to how companies are managing their dividends during this pandemic. Here, so far, is the tally of dividend cutters and dividend raisers.
Dividend Scorecard
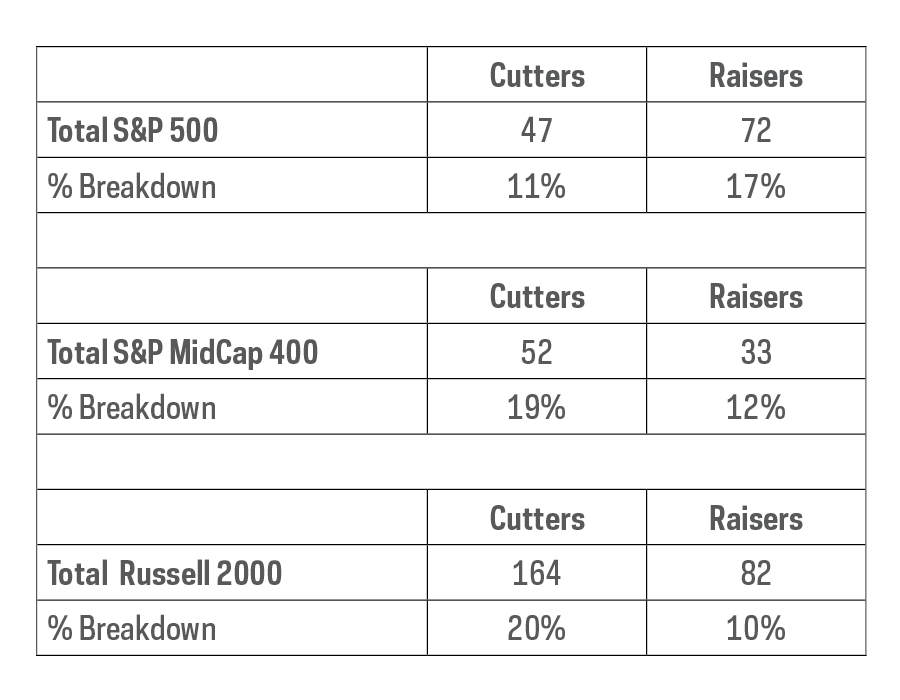
Source: Bloomberg, ProShares. Based on DPS announcements from 1/1/20-5/11/20. Past performance is no guarantee of future results. Chart is provided for illustrative purposes.
S&P 500 Dividend Scorecard by Sector
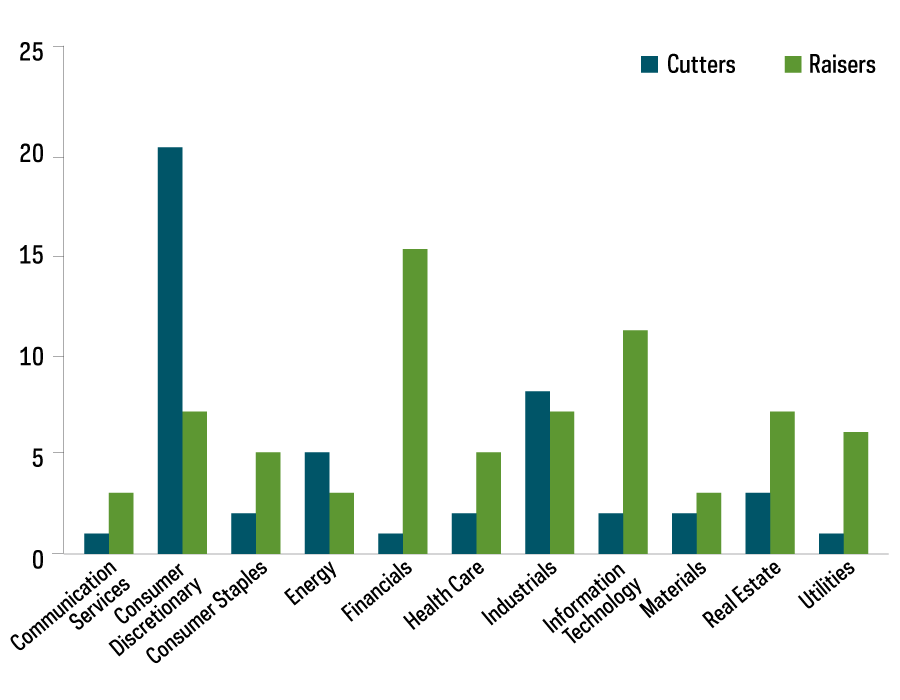
As you can see in Figure 2, the largest number of dividend cutters have come from within the consumer discretionary sector. It’s quite reasonable to consider that sector, which houses hotel chains, cruise lines, restaurants and many bricks-and-mortar retailers, would be a dividends-at-risk “hot-spot.” It is noteworthy, however, that even within the consumer discretionary sector there are outperformers. Amazon stands out, of course, but so too do Lowe’s (as people fix up homes they are spending more time in) and Target (fully open with necessities). With oil prices near historic lows, it is also no surprise to see energy sector names appeared on the dividend cutters list. The diverse nature of the industrials sector challenges the ability to draw simple conclusions from its numbers of cutters versus raisers, but it serves as a useful prompt to look at a key company dimension that seems to be driving dividend outcome—quality.
S&P 500 Dividend Cutters by Credit Rating and Dividend Yield
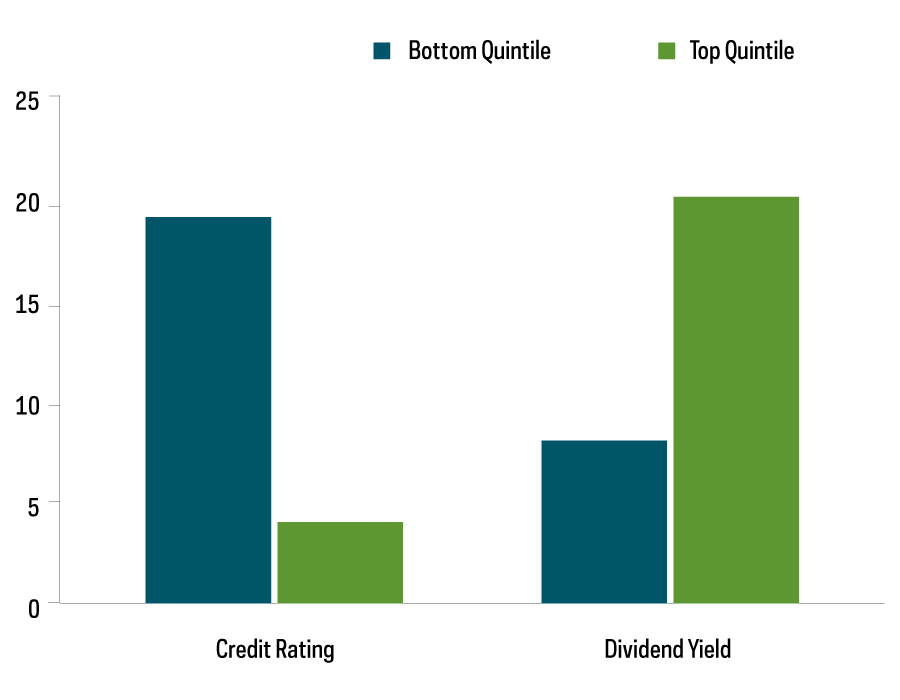
Source: Bloomberg, ProShares, from 1/1/20—5/11/20. Past performance is no guarantee of future results. Chart is for illustrative purposes.
Sector-related patterns of dividend risk can vary dramatically in different environments. Challenging economic conditions can be driven by financial crises, energy crises, geopolitical crises and, as of late, health crises. Regardless of the environmental drivers, quality metrics—measures such as a company’s leverage, earnings quality and stability, dividend yields and payout ratios—are another important lens for examining dividend risk.
A company’s credit rating provides a convenient composite measure of its quality. And clearly, quality matters. Only one-fifth as many dividend cutters and eliminators have come from the top quintile of the S&P 500 by credit rating. Nearly five times that number have come from the bottom quintile. A similar picture appears when sorting by dividend yield. Companies in the highest quintile of dividend yield, those whose ability to pay may become stretched in challenging markets, account for more than double the number of dividend cuts and eliminations versus those in the bottom quintile with more modest dividend yields.
A Look Back at the 2008 Financial Crisis
If we look back at the companies that cut dividends during the 2008 financial crisis, we see some confirmation regarding the robustness of quality companies across different environments.
Dividend Cuts During the 2008 Financial Crisis, 1/1/2008 – 12/31/2009
S&P 500 Dividend Cutters (Ex-Financials)
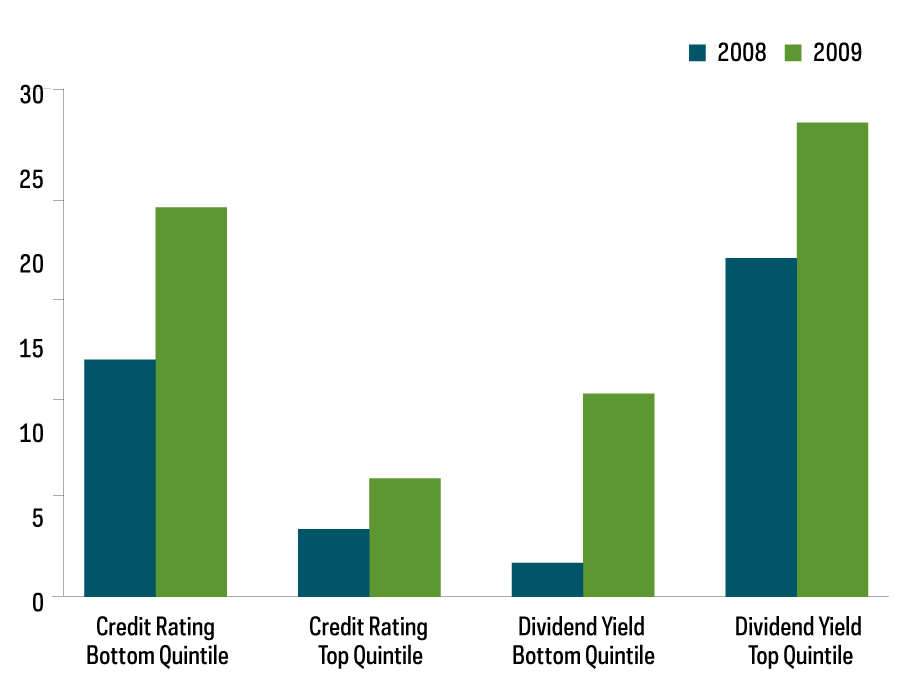
Source: Bloomberg, ProShares. Past performance is no guarantee of future results. Chart is for illustrative purposes. The financial sector was removed from this analysis because, as the epicenter of the financial crisis, financial services firms were hit across the board.
Though the drivers of the 2008 financial crisis were dramatically different from those today, a similar pattern appears related to quality. Far more dividend cutters came from lower-quality companies in the bottom quintile of credit ratings compared with those at the top, and there were many more dividend cutters from the top quintile of dividend yield companies compared with the bottom.
Where’s the Dividend Risk Today?
“This time is different.” It’s an overused cliché, but in many regards, things really are different this time. It would be hard to come up with a more unique economic backdrop than a global pandemic. Still, some patterns are emerging. Energy sector woes may far outlast the lockdown, with influences such as conservation and renewable or alternative energy sources expanding. Much of the consumer discretionary sector is likely also to be at risk for some time. Hotels, cruise lines and restaurant operations may be so disrupted that recovery will be a challenge. And, with a headwind perhaps even more acute than the energy sector faces, bricks-and-mortar retail seems to be on the wrong end of a long trend that favors e-commerce.
Most sectors, however, cannot be painted with such a broad brush—and that makes focusing on quality very appealing. History tells us that the dividends of higher-quality companies, across the entire equity market, are likely to be more secure than the dividends of their lower-quality counterparts. And that might not be any different this time.
What's Next in This Series?
In our next installment, we will explore how focusing on stocks that consistently grow their dividends can be effective in identifying quality companies. We will also dig a bit deeper into the challenges facing higher dividend yielding stocks.
This is not intended to be investment advice. Any forward-looking statements herein are based on expectations of ProShare Advisors LLC at this time. ProShare Advisors LLC undertakes no duty to update or revise any forward-looking statements, whether as a result of new information, future events or otherwise.
Investing is currently subject to additional risks and uncertainties related to COVID-19, including general economic, market and business conditions; changes in laws or regulations or other actions made by governmental authorities or regulatory bodies; and world economic and political developments.
Investing involves risk, including the possible loss of principal. There is no guarantee any ProShares ETF will achieve its investment objective.
Carefully consider the investment objectives, risks, charges and expenses of ProShares before investing. This and other information can be found in their summary and full prospectuses. Read them carefully before investing.
Learn More
NOBL
S&P 500 Dividend Aristocrats ETF
Seeks investment results, before fees and expenses, that track the performance of the S&P 500® Dividend Aristocrats® Index.
REGL
S&P MidCap 400 Dividend Aristocrats ETF
Seeks investment results, before fees and expenses, that track the performance of the S&P MidCap 400® Dividend Aristocrats® Index.
SMDV
Russell 2000 Dividend Growers ETF
Seeks investment results, before fees and expenses, that track the performance of the Russell 2000® Dividend Growth Index.