 Leveraged & Inverse
Leveraged & Inverse
Leveraged & Inverse
In Part I: The Significance of Portfolio Hedging, we talked about the inevitability of market downturns and ways to help dampen their effects. In Part II: Strategies for Hedging Your Portfolio, we discussed hedging with inverse exposure, in particular, with inverse ETFs. So, do inverse ETFs work?
Here, we provide you with two case studies that illustrate the potential effectiveness of using ProShares inverse ETFs to hedge different asset classes under different market conditions. Remember that ProShares inverse ETFs have one-day investment objectives. While they may be held for periods longer than one day, you should monitor your investments as frequently as daily and consider a rebalancing strategy.
Hedging with ProShares Inverse ETFs
ProShares inverse ETFs are frequently used to hedge equity and bond holdings. And, as investors have diversified into a broader selection of asset classes, it has become common to see investors hedging commodity and currency holdings as well. Let's examine case studies with ProShares ETFs used to hedge these types of assets. In all instances, a rebalancing strategy based on a 10% trigger was used—trigger-based rebalancing is explained in Part II: Strategies for Hedging Your Portfolio.
Equities
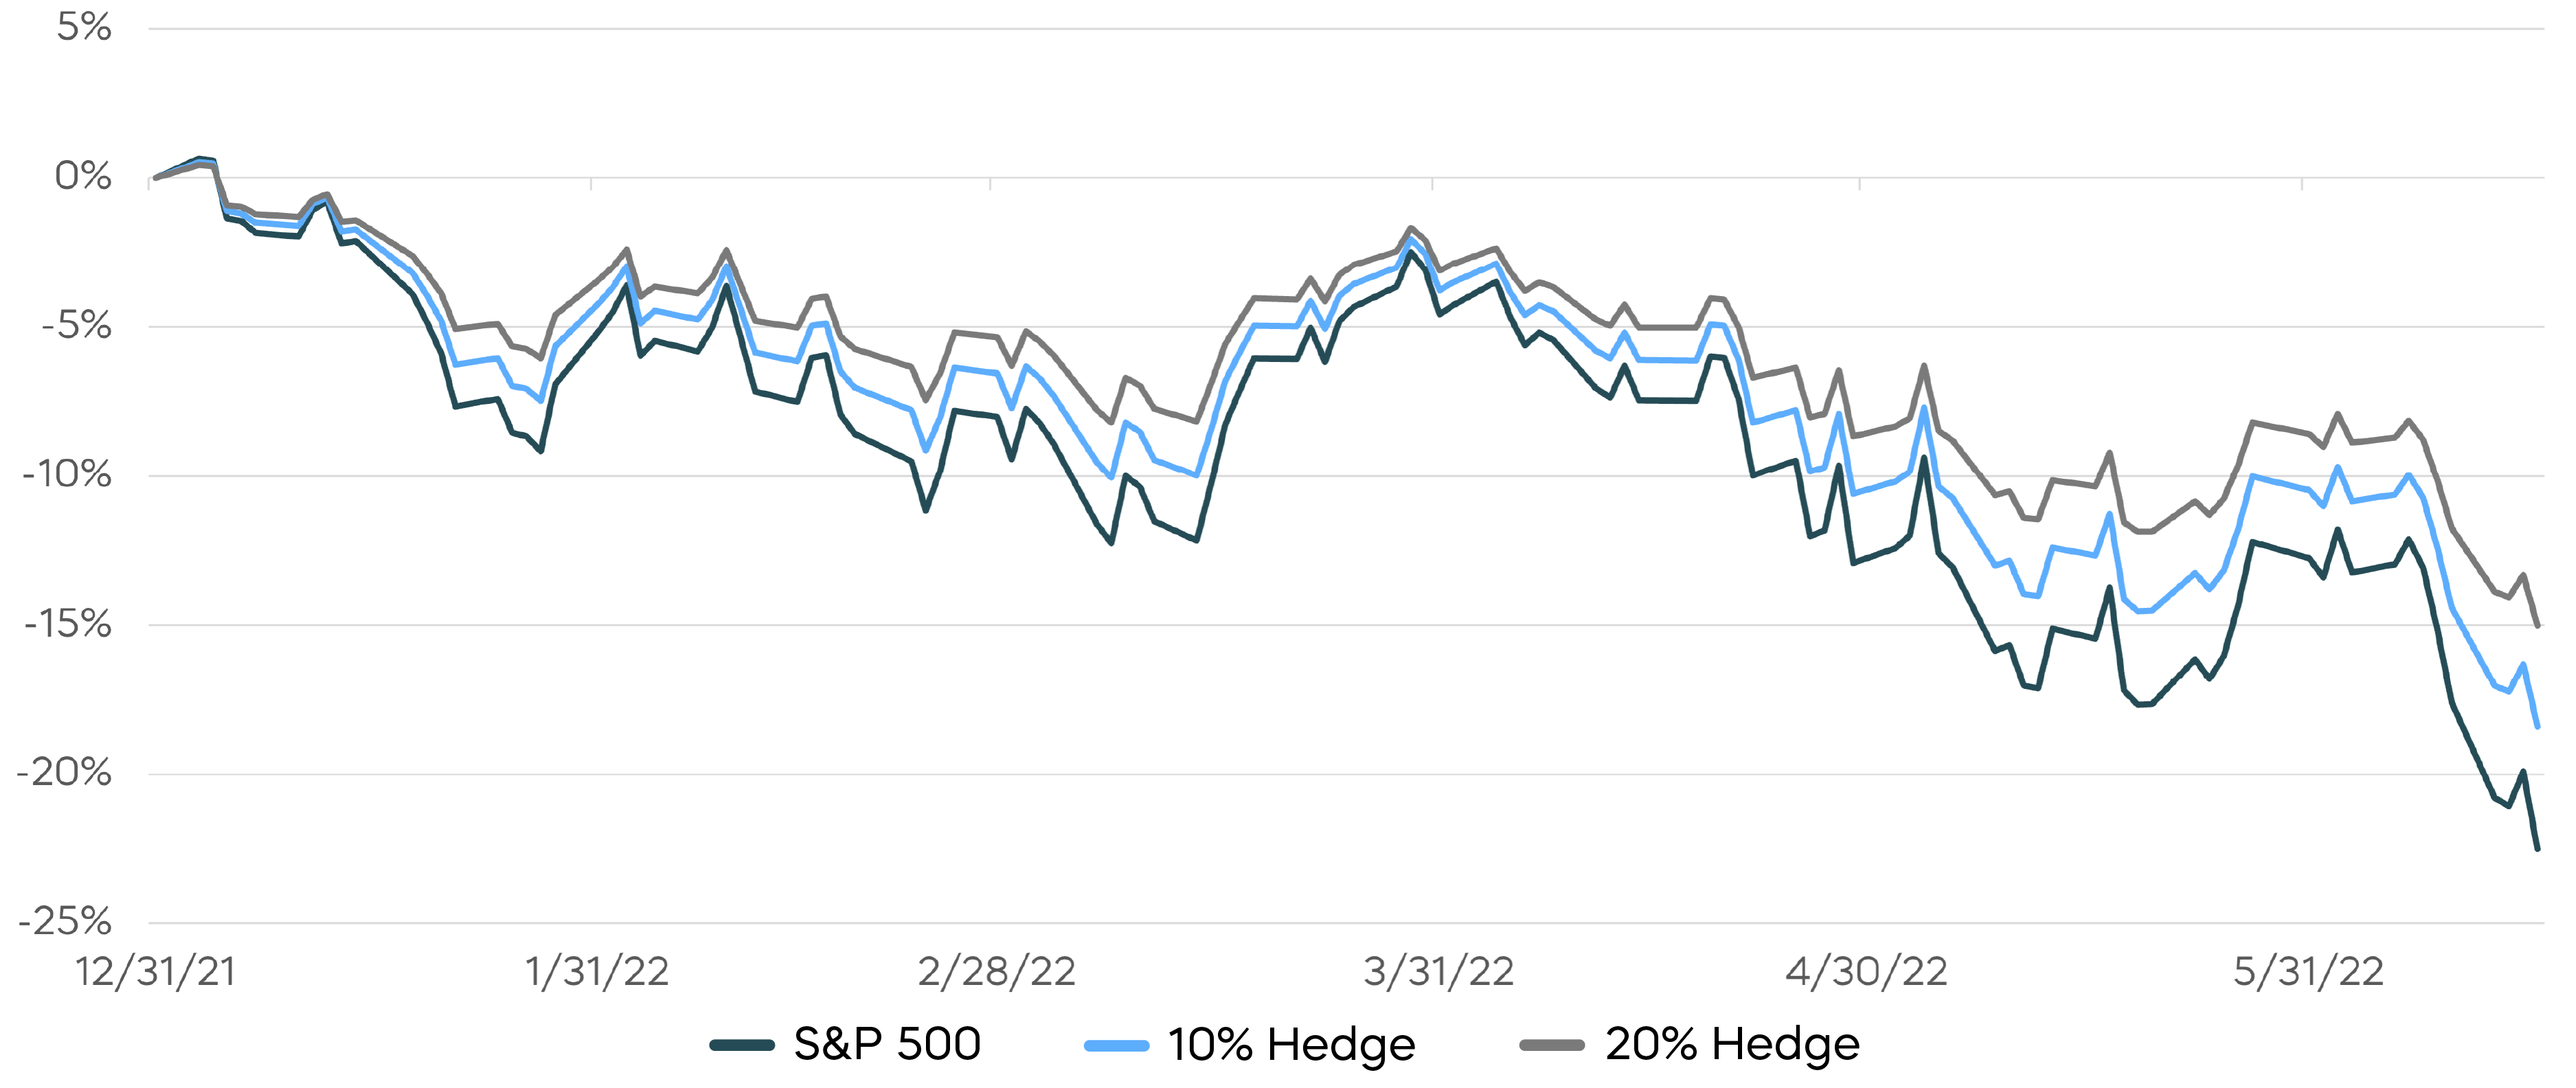
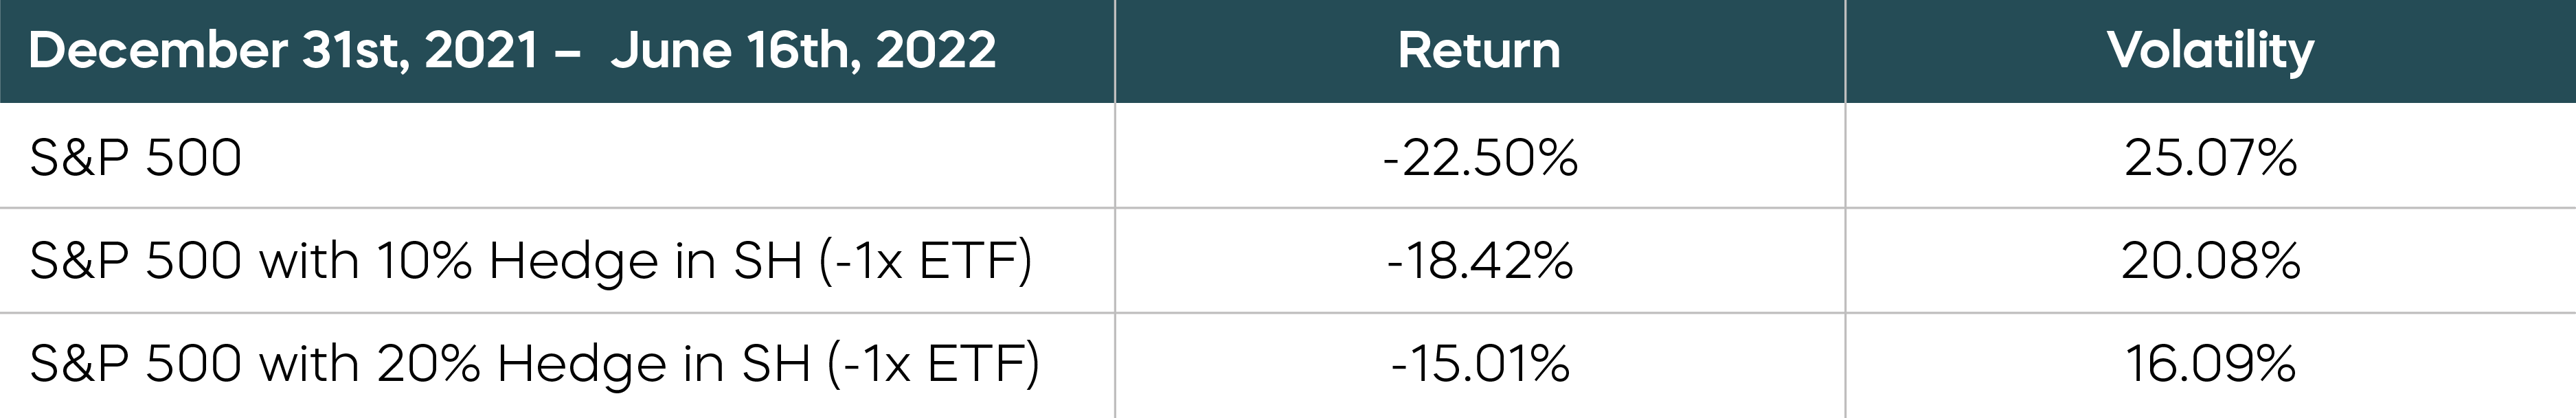
It is probably safe to say that most of us have large-cap investments in our portfolios. The S&P 500 is one of the largest and most widely followed indexes in the world. The ProShares Short S&P 500 ETF (ticker: SH) offers daily inverse (-1x) exposure to the S&P 500. If the S&P 500 falls 1% on a day, SH is designed to rise by 1%, and vice versa. Let's look at an example of a hedge using SH during the market downturn in the first half of 2022, as inflation, rising interest rates, Fed tightening and fears of a recession roiled equity markets.
Hedging Down Equity Markets with -1x S&P 500 ETF (SH)
For more information and to view current standardized performance for SH, click here.
Source: Bloomberg. The illustration used a 10% rebalance trigger. Illustration shows NAV returns. Market price returns, which more closely reflect the experience of an investor, may yield different results. The performance quoted represents past performance and does not guarantee future results. Investment return and principal value of an investment will fluctuate so that an investor's shares, when sold or redeemed, may be worth more or less than the original cost. Shares are bought and sold at market price (not NAV) and are not individually redeemed from the fund. Market price returns are based upon the midpoint of the bid/ask spread at 4:00 p.m. ET (when NAV is normally determined for most funds) and do not represent the returns you would receive if you traded shares at other times. Brokerage commissions will reduce returns. For both standardized performance and return data current to the most recent month end, see Performance. Index returns are for illustrative purposes only and do not represent fund performance. Index returns do not reflect any management fees, transaction costs or expenses. Indexes are unmanaged and one cannot invest in an index.
As illustrated, the S&P 500 declined nearly 23% during the period and volatility rose to 25%. Many of us are painfully aware that investors who were overly reliant on traditional diversification to control risk during that period lost significant amounts of money. Had investors been hedging their large-cap investments with SH, they could have seen reduced losses and improved volatility.
With just a 10% hedge position in SH, returns could have been improved by over 4% and volatility reduced by around 5%. A 20% hedge, as expected, could have had nearly double the impact. Potential returns could have been improved by more than 7% and volatility reduced by approximately 9%.
Fixed Income
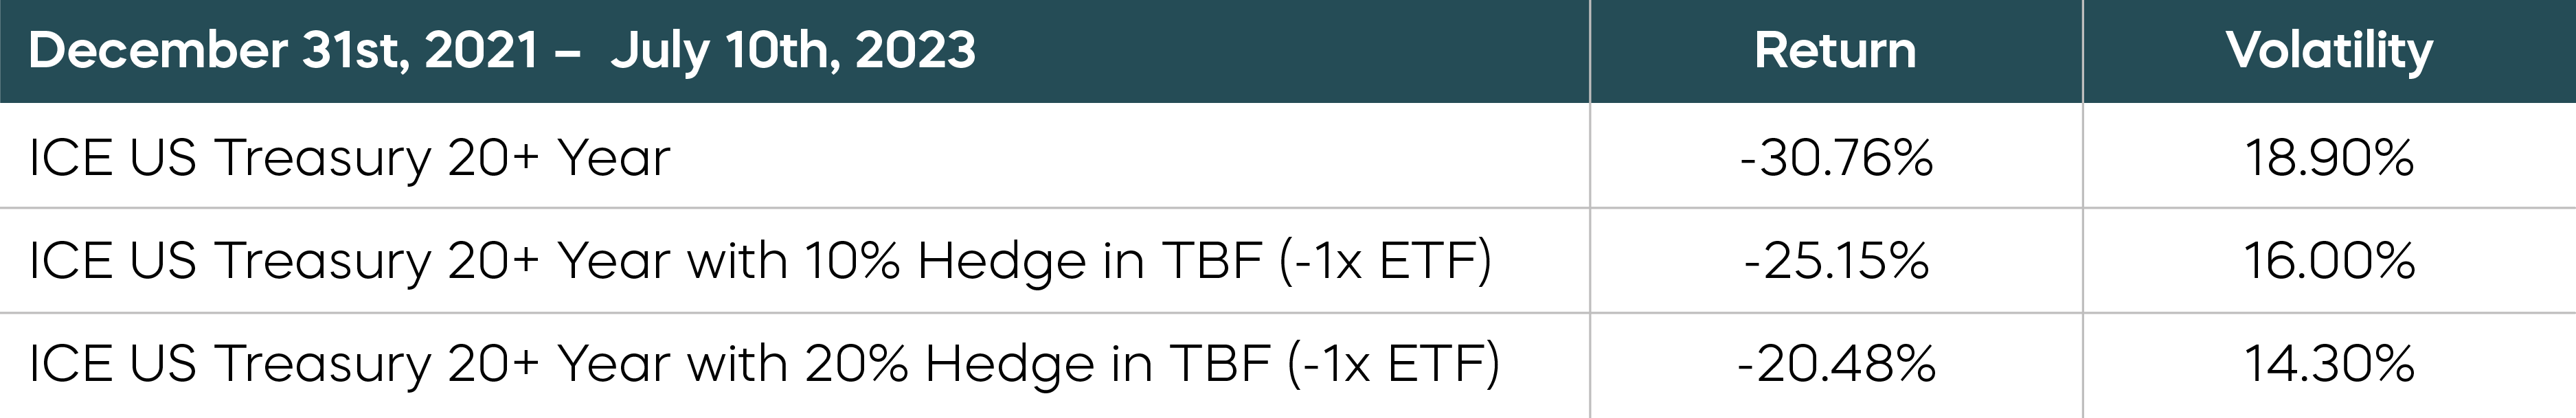
Many investors hold long-term Treasuries or Treasury bonds as part of the fixed income allocation in their portfolio. To hedge a bond investment against rising interest rates, for example, an inverse ETF like the ProShares Short 20+ Year Treasury ETF (ticker: TBF) is often used. It is designed to seek daily inverse (-1x) exposure to the ICE U.S. Treasury 20+ Year Bond Index.
In this example, we compare the ICE U.S. Treasury 20+ Year Bond Index (the “20+ Year Treasury Index”), a measure of bond market performance, with 10% and 20% hedge positions in TBF. Treasury yields in the United States have largely declined over the past four decades, but rose sharply from the beginning of 2022 to July 2023, as the Federal Reserve shifted to tightening monetary policies amid high inflation. Rates and yields move in the opposite direction from bond prices, so when rates and yields rise, bond prices decline.
Hedging Rising Rates with -1x +20 Year Treasury ETF (TBF)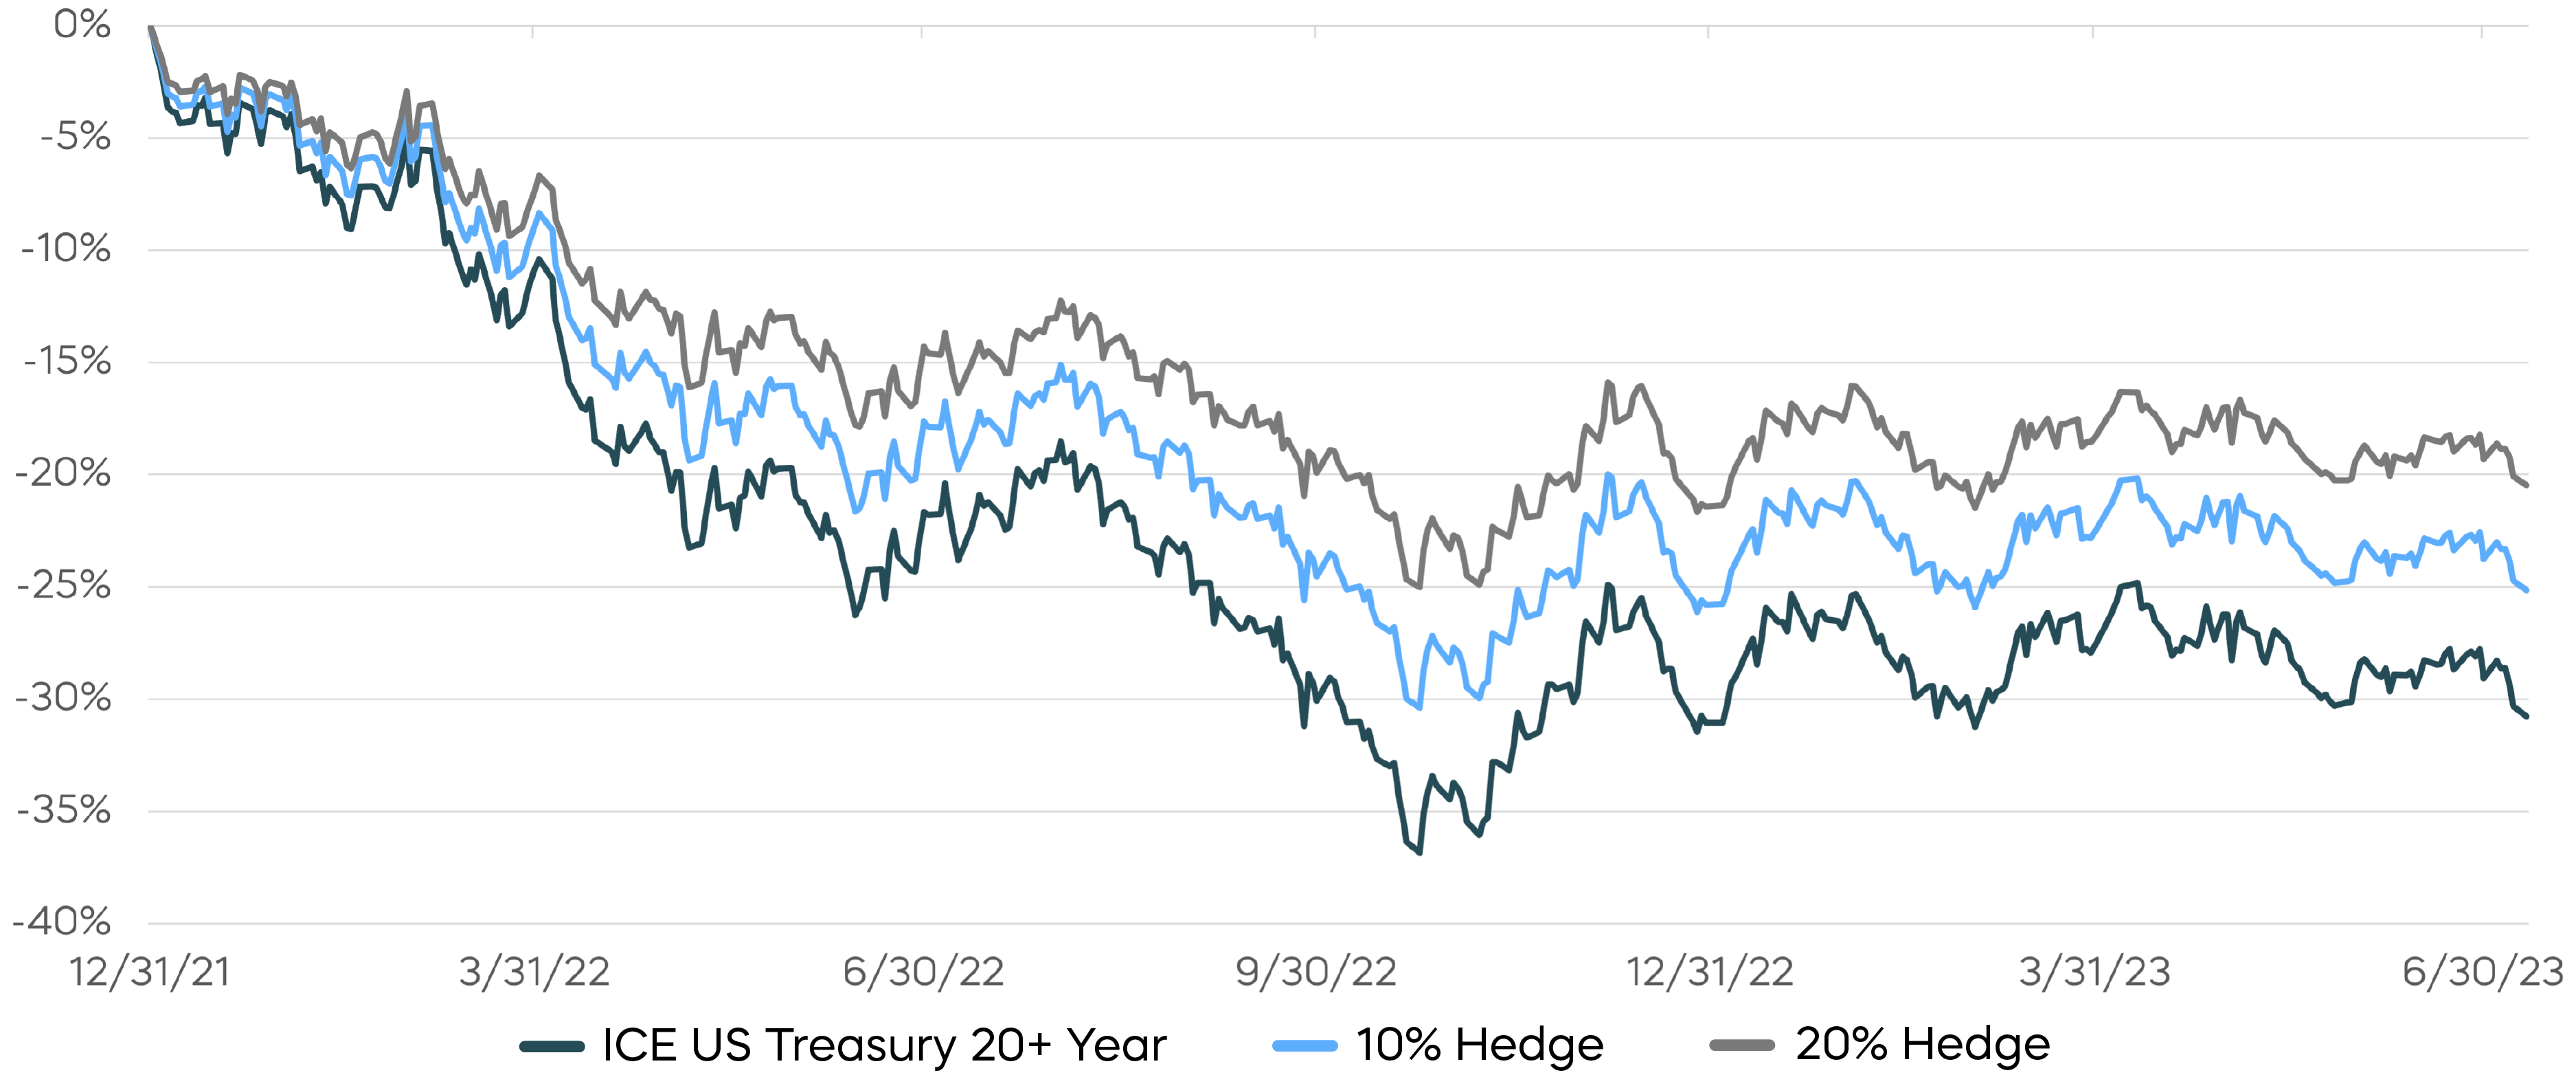
For more information and to view current standardized performance for TBF, click here.
Source: Bloomberg. The illustration used a 10% rebalance trigger. Illustration shows NAV returns. Market Price returns, which more closely reflect the experience of an investor, may yield different results. The performance quoted represents past performance and does not guarantee future results. Investment return and principal value of an investment will fluctuate so that an investor’s shares, when sold or redeemed, may be worth more or less than the original cost. Shares are bought and sold at market price (not NAV) and are not individually redeemed from the fund. Market price returns are based upon the midpoint of the bid/ask spread at 4:00 p.m. ET (when NAV is normally determined for most funds) and do not represent the returns you would receive if you traded shares at other times. Brokerage commissions will reduce returns. For both standardized performance and return data current to the most recent month end, see Performance. Index returns are for illustrative purposes only and do not represent fund performance. Index returns do not reflect any management fees, transaction costs or expenses. Indexes are unmanaged and one cannot invest in an index.
If you look at returns for the 20+ Year Treasury Index, yields increased significantly between December 31, 2021 and July 10, 2023, and you'll see that returns fell over 30% with volatility over 18%. Even a 10% hedge would have reduced losses from 30.8% to approximately 25.2% and also reduced volatility. A larger 20% hedge could have cut losses to 20.5% and reduced volatility to 14.3%.
Something else to keep in mind when hedging bonds is duration—a measure of a bond's price sensitivity to changes in interest rates. In this case, the 20+ Year Treasury Index has a modified duration of 17, making TBF's duration -17. You should also be aware of how your fixed income exposure is spread across the points on the yield curve, as well as which points you want to hedge. ProShares offers a suite of inverse Treasury funds that invest in bonds with a range of maturities up to 20+ years.
|
INDEX/BENCHMARK |
DAILY OBJECTIVE |
|||
|
UltraPro Short |
UltraShort |
Short |
||
|
-3x |
-2x |
-1x |
||
|
BROAD MARKET |
||||
|
S&P 500 |
||||
|
NASDAQ-100 |
||||
|
NASDAQ-100 Mega |
-- | -- | ||
|
Dow Jones Industrial Average |
||||
|
S&P MidCap 400 |
||||
|
S&P SmallCap 600 |
-- |
|||
|
Russell 2000 |
||||
|
SECTOR |
||||
|
Dow Jones U.S. Basic Materials |
-- |
-- |
||
|
NASDAQ Biotechnology |
-- |
-- |
||
|
S&P Communication Services Select Sector |
-- |
-- |
||
|
Dow Jones U.S. Consumer Goods |
-- |
-- |
||
|
Dow Jones U.S. Consumer Services |
-- |
-- |
||
|
Dow Jones U.S. Financials |
-- |
|||
|
Dow Jones U.S. Health Care |
-- |
-- |
||
|
Dow Jones U.S. Industrials |
-- |
-- |
||
|
Dow Jones U.S. Oil & Gas |
-- |
-- |
||
|
Dow Jones U.S. Real Estate |
-- |
|||
|
Solactive-ProShares Bricks and Mortar Retail Store |
-- |
-- |
||
|
Dow Jones U.S. Semiconductors |
-- |
-- |
||
|
Dow Jones U.S. Technology |
-- |
-- |
||
|
Dow Jones U.S. Select Telecommunications |
-- |
-- |
-- |
|
|
Dow Jones U.S. Utilities |
-- |
-- |
||
|
INTERNATIONAL |
||||
|
MSCI EAFE |
-- |
|||
|
MSCI Emerging Markets |
-- |
|||
|
FTSE Developed Europe All Cap |
-- |
-- |
||
|
MSCI Brazil 25/50 Capped |
-- |
-- |
||
|
FTSE China 50 |
-- |
|||
|
MSCI Japan |
-- |
-- |
||
|
FIXED INCOME |
||||
|
ICE U.S. Treasury 20+ Year Bond |
||||
|
ICE U.S. Treasury 7-10 Year Bond |
-- |
|||
|
Markit iBoxx $ Liquid High Yield |
-- |
-- |
||
|
COMMODITY |
||||
|
Bloomberg WTI Crude Oil Subindex |
-- |
-- |
||
|
Bloomberg Natural Gas Subindex |
-- |
-- |
||
|
Bloomberg Gold Subindex |
-- |
-- |
||
|
Bloomberg Silver Subindex |
-- |
-- |
||
|
CURRENCY |
||||
|
EUR/USD 4:00 p.m. ET exchange rate |
-- |
-- |
||
|
JPY/USD 4:00 p.m. ET exchange rate |
-- |
-- |
||
|
CRYPTO-LINKED |
||||
|
Bloomberg Bitcoin Index |
-- |
|||
|
Bloomberg Ethereum Index |
-- |
|||
|
THEMATIC |
||||
|
Nasdaq-100 Mega Index |
-- |
-- | ||

 Leveraged & Inverse
Leveraged & Inverse
Leveraged & Inverse