
As of November 2021, non-U.S. equities compose nearly 40% of global equity market capitalization when looking at the MSCI ACWI Index, yet U.S.-based investors sometimes systematically underweight international stocks. This oversight can often extend to investors underweighting international stocks in their dividend strategies—and that could be a mistake.
A well-diversified portfolio typically includes representative allocations across asset classes, sectors and geographies. However, U.S.-based dividend investors may often focus narrowly on domestic large-cap stocks. But dividend strategies are truly a global opportunity. While the United States is the largest source of dividends, it only represents about half of the global dividend pool, according to MSCI. Developed markets in Europe and Asia contribute over 40% of global dividends and represent a potentially untapped diversification opportunity. And not all dividends are equal.
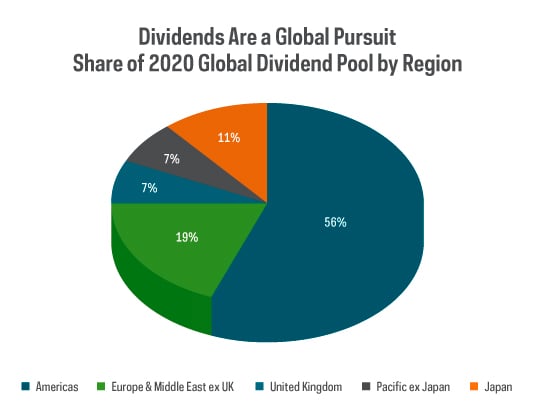
Source: MSCI. Data for developed markets only. For dividends paid in 2020.
Dividend growth strategies often focus on quality companies that have consistently grown their dividends and displayed hallmarks like durable business models with stable earnings, solid fundamentals, and strong histories of profit and growth. Investment strategies focused on consistent dividend growth have also generally outperformed their benchmarks over the long term.[1] The investment appeal of quality and potential outperformance has no geographical boundaries.
Exporting Your Dividend Growth Strategy
The MSCI EAFE Dividend Masters Index focuses exclusively on international developed market companies from the MSCI EAFE Index with at least 10 years of consistent dividend growth.
The MSCI Dividend Masters Index holds some of the world’s most generous dividend payers and those with the longest record of dividend growth. For example, Swiss-based Nestlé has paid dividends since 1959 and grown them every year since 1995, and it paid over 7.9B Swiss franc in cash distributions in fiscal year 2020. Similarly, French pharmaceutical company Sanofi has raised its dividends for 27 consecutive years.
The Case for International Dividend Growth in Today’s Market
Investing in international dividend growth stocks is compelling and rests on three pillars: higher yields, a post-pandemic dividend resurgence and attractive valuations. Yield in the current low-rate environment generally remains scarce, especially among equity-based asset categories. However, as the chart below shows, international developed stocks have provided higher yield than domestic stocks, albeit with lower absolute-yield levels in today’s markets.
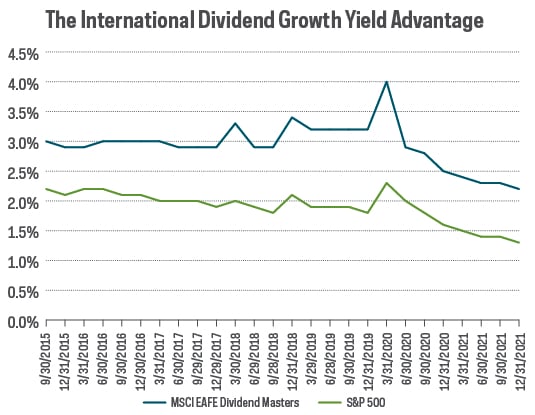
Source: Bloomberg. Data from 9/1/15‒12/31/21.
That said, yields on international stocks have fallen since the onset of the pandemic. Compared to domestic stocks that held 2020 dividends essentially flat, international dividends fell by approximately 30%. There has been regional variation, however, with countries like Japan proving more resilient than European markets like Britain. And companies with long dividend growth histories have generally fared better, highlighting the importance of dividend growth discipline.
Differences in the timing of dividend payments also caused troubles overseas. U.S. dividends are typically paid quarterly, but international dividends are typically paid annually, often in the second quarter. At the onset of the pandemic, many companies chose a conservative route by suspending dividend payments. However, this dynamic has potentially set up international stocks for a strong rebound and faster dividend growth rates than domestic payers. The MSCI EAFE Index is providing early evidence of this trend, with dividends for the first three quarters of 2021 up almost 37% versus 2020.
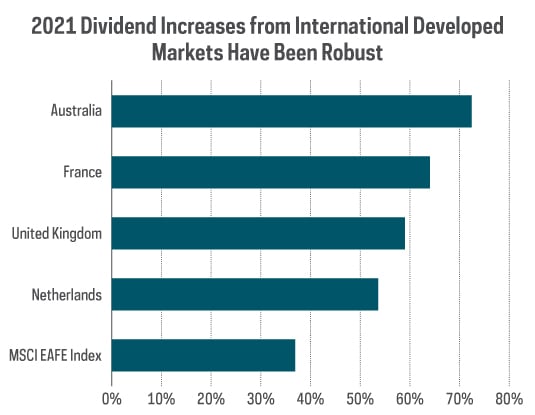
Source: MSCI. Data compares dividend payments through the first three quarters of 2021 versus the same period in 2020.
The final pillar of our case relates to performance trends. Years of U.S. stocks outperforming their global peers has led many to question holding international stocks. But regional performance tends to be cyclical, as the chart below shows. A recovery among international economies in the wake of the pandemic could provide the catalyst to reverse recent relative performance trends.
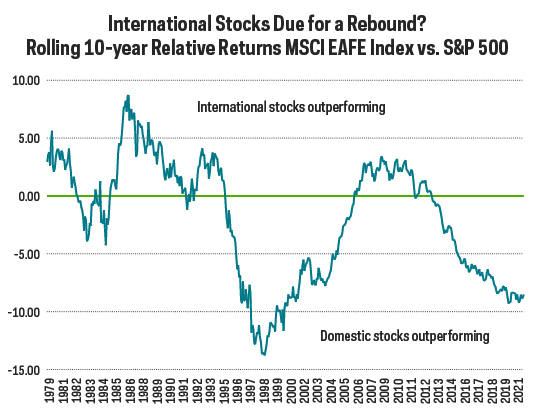
Source: Morningstar. Data through 12/31/21.
Another result of recent international stock underperformance is relatively low prices versus domestic stocks. The lower their starting valuation, the more attractive their upside long-term potential returns, but this approach requires patience. Relating this back to dividend growth strategies, the MSCI EAFE Dividend Masters Index is currently trading at 10%, 20% and 40% relative discounts on a price-to-earnings, price-to-cash-flows and price-to-book basis versus the S&P 500, offering potentially compelling value for dividend growth investors seeking future outperformance.
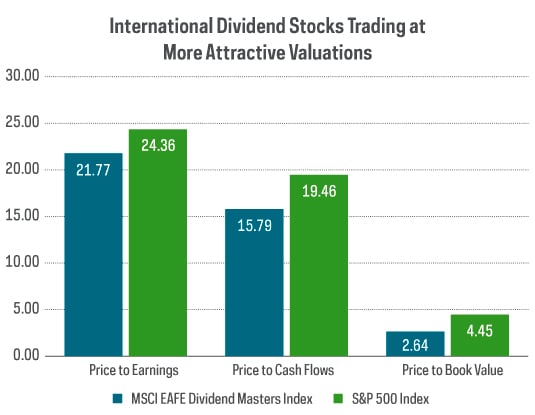
Source: FactSet. Data as of 11/30/2021. Price-to-earnings ratio shows how much investors are paying for a dollar of a company's earnings. Price-to-cash-flows ratio measures the value of a stock’s price relative to its operating cash flow per share. Price-to-book ratio measures the market value of a fund or index relative to the collective book values of its component stocks.
The Takeaway
Dividend growth investing has become a staple strategy for many investors focused on quality and outperformance potential. While those attributes have no geographic boundaries, investors often limit their exposure to international stocks. However, an international dividend growth strategy—like the MSCI EAFE Dividend Masters Index presents—could be a compelling opportunity in today’s market.
1 Source: ProShares, Bloomberg, S&P 500 Dividend Aristocrats Index versus S&P 500, 5/2/05‒12/31/21.
Important Information
This is not intended to be investment advice. Any forward-looking statements herein are based on expectations of ProShare Advisors LLC at this time. ProShare Advisors LLC undertakes no duty to update or revise any forward-looking statements, whether as a result of new information, future events or otherwise.
Investing is currently subject to additional risks and uncertainties related to COVID-19, including general economic, market and business conditions; changes in laws or regulations or other actions made by governmental authorities or regulatory bodies; and world economic and political developments.
Carefully consider the investment objectives, risks, charges and expenses of ProShares before investing. This and other information can be found in their summary and full prospectuses. Read them carefully before investing.
"MSCI," "MSCI Inc.," "MSCI Index" and "EAFE" are service marks of MSCI and have been licensed for use by ProShares. The "S&P 500®" is a product of S&P Dow Jones Indices LLC and its affiliates and has been licensed for use by ProShares. "S&P®" is a registered trademark of Standard & Poor's Financial Services LLC ("S&P") and "Dow Jones®" is a registered trademark of Dow Jones Trademark Holdings LLC ("Dow Jones") and have been licensed for use by S&P Dow Jones Indices LLC and its affiliates. ProShares have not been passed on by these entities and their affiliates as to their legality or suitability. ProShares based on these indexes are not sponsored, endorsed, sold or promoted by these entities and their affiliates, and they make no representation regarding the advisability of investing in ProShares. THESE ENTITIES AND THEIR AFFILIATES MAKE NO WARRANTIES AND BEAR NO LIABILITY WITH RESPECT TO PROSHARES.
Learn More
NOBL
S&P 500 Dividend Aristocrats ETF
Seeks investment results, before fees and expenses, that track the performance of the S&P 500® Dividend Aristocrats® Index.
REGL
S&P MidCap 400 Dividend Aristocrats ETF
Seeks investment results, before fees and expenses, that track the performance of the S&P MidCap 400® Dividend Aristocrats® Index.
SMDV
Russell 2000 Dividend Growers ETF
Seeks investment results, before fees and expenses, that track the performance of the Russell 2000® Dividend Growth Index.