Dividend Aristocrats Viewpoint 06

arrows-left arrows-right

Dividends vs Buybacks: Is One Better for Investors?

Dividend Aristocrats Viewpoint | May 17, 2022
STRATEGY Dividend Growers
Learn More

As companies continue to navigate fluctuating pandemic conditions, they are gradually normalizing their capital allocation policies, and stock buybacks are hot again. So, we ask, should dividend growth or a buyback be more appealing to investors? While both stock buybacks and dividends are important components of total shareholder yield, there are important differences to consider.

Recent Dividend vs. Buyback Trends

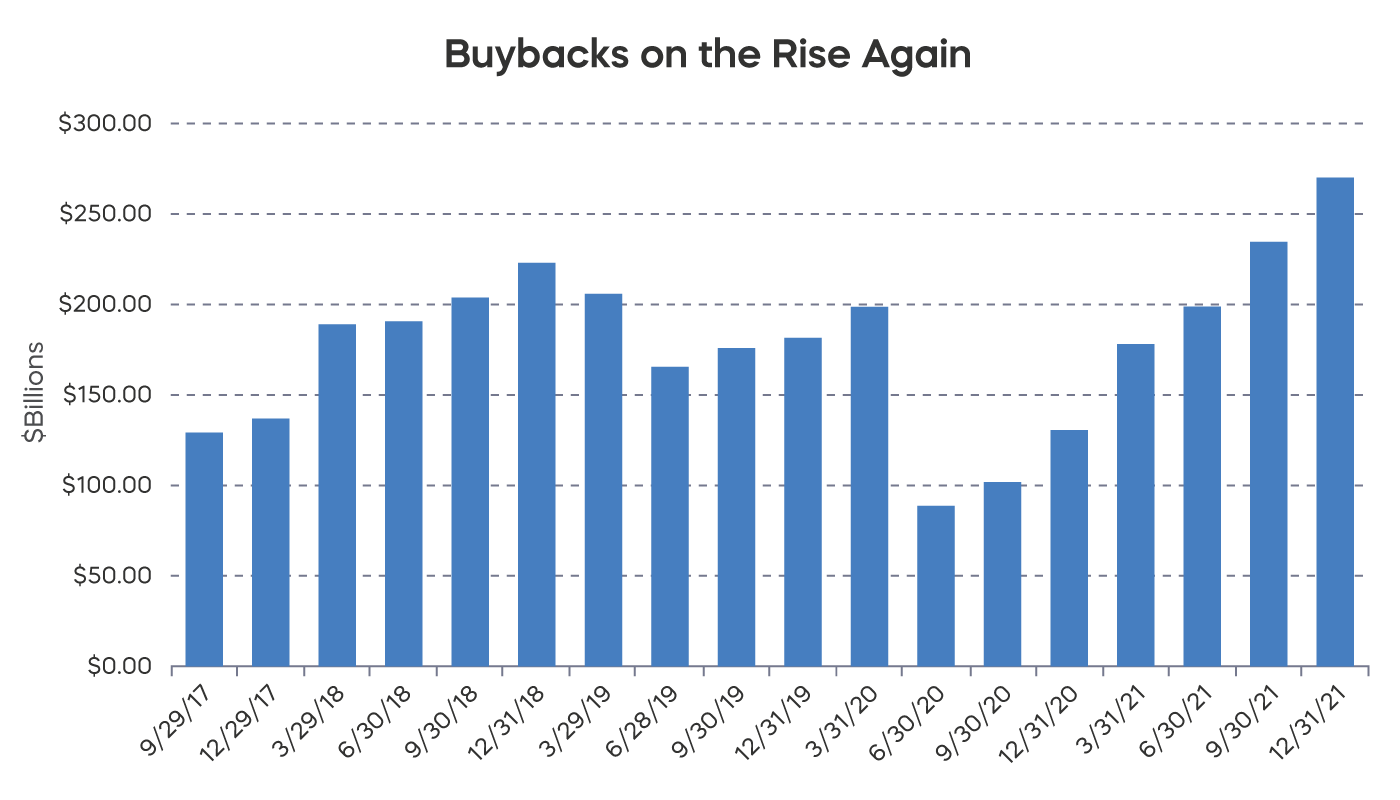
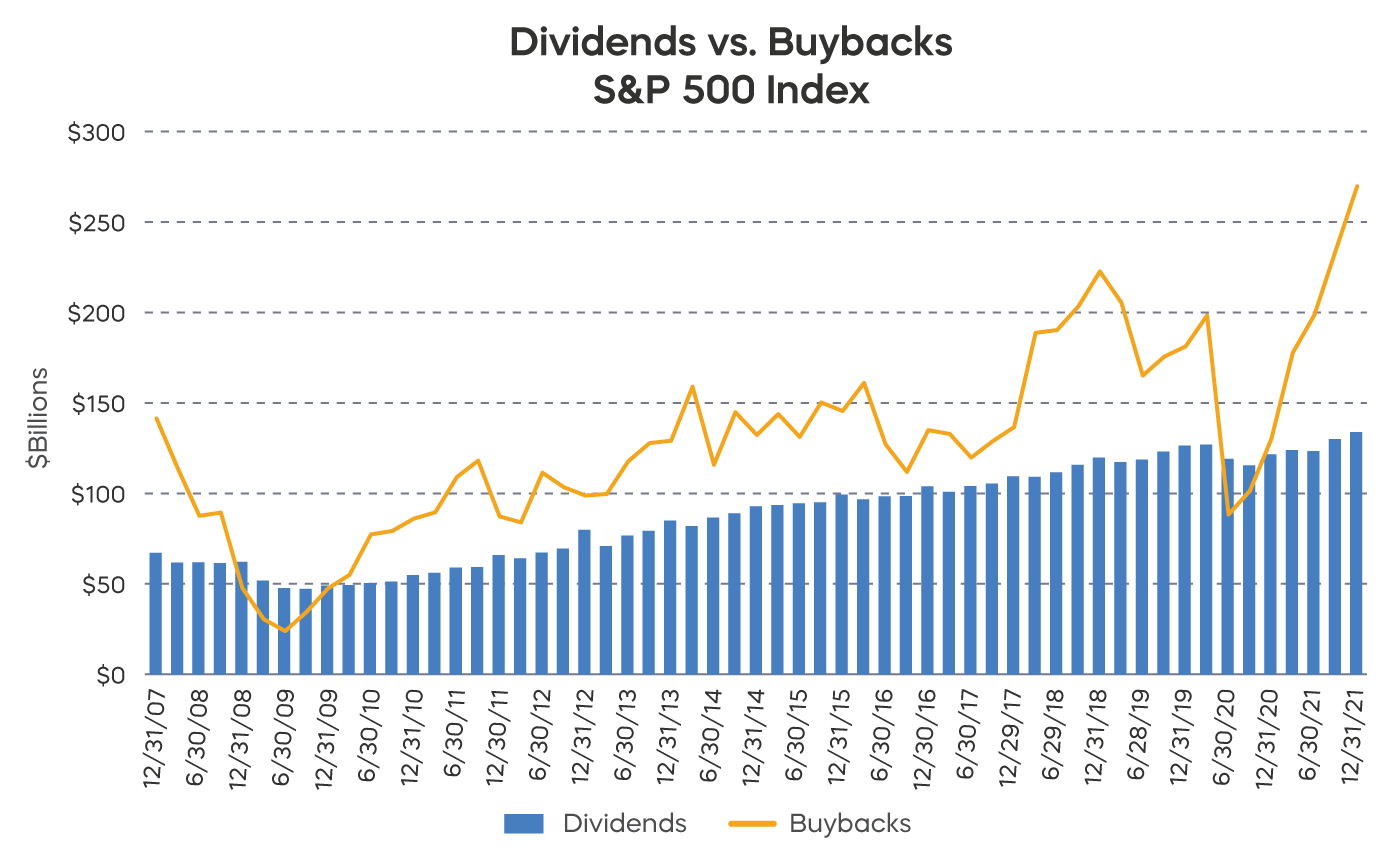
Dividends largely rebounded in 2021, but the volume of stock buybacks has been setting records recently. Standard & Poor’s reported that fourth quarter 2021 buybacks were $270 billion—an all-time high—and up 15% from the third quarter.

dv11_buybacks_rise.png
Source: Standard & Poor’s, from 9/29/17 ‒ 12/31/21.
 

Why the Fuss over Buybacks?

Companies face finite uses for their capital and cash flows, and there will always exist tension between reinvesting for organic growth, expanding by acquisition, or returning money to shareholders via dividends or buybacks. How these decisions play out influences shareholder experience over time.
 
  • Dividends have long been viewed as a prudent and even expected deployment of capital.
  • Buybacks have a more contentious history, and the steady increase in buyback volumes over time has brought scrutiny.
On their face, buybacks are usually well received. In addition to signaling management’s confidence in the future, share repurchases reduce a company’s shares outstanding. All else equal, with fewer shares publicly trading, remaining shareholders' stock shares represent an increased ownership interest in the company. Earnings per share (EPS) also generally increases, which can boost near-term share prices.
 
In practice, the effects of buybacks are less clear and often misunderstood. Increasing EPS can provide an incomplete view of value creation and the effectiveness of management’s capital deployment.
 
  • Increasing EPS, for example, can overshadow a situation where returns on invested capital are decreasing over time on lower incremental returns.
  • Leading buyback companies are sometimes the same companies that issue abundant shares in compensation related options.
 

The Dividend Growth Advantage

Dividend growth strategies have become popular core portfolio building blocks across market capitalization segments, geographies and even sectors. While buyback strategies are less common as a stand-alone allocation, some advocate for combining stocks that pay dividends with those that execute buybacks in a concept called total shareholder yield.
 
Dividend payments and buybacks are both ways for companies to return capital to shareholders; however, they create very different outcomes when used as a basis for portfolio construction. Let’s take a look at two of the more widely tracked indexes in the space.
 
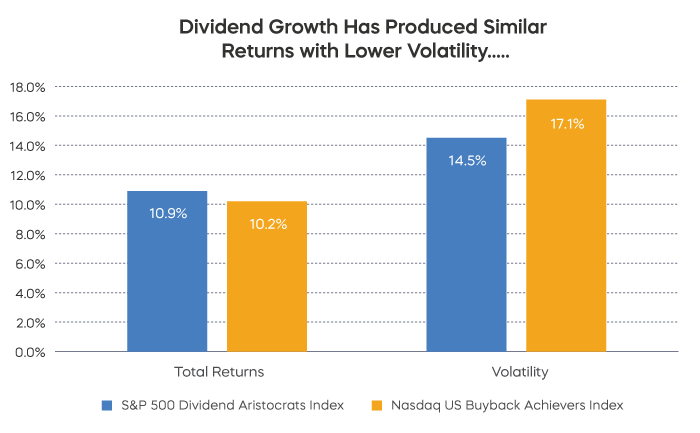
  • The S&P 500 Dividend Aristocrats are stocks that have grown their dividends for a minimum of 25 consecutive years.
  • The Nasdaq U.S. Buyback Achievers Index tracks companies that have reduced their shares outstanding by at least 5% over the trailing 12-month period.
As of April 30, 2022, there are only three Dividend Aristocrats that overlap with the Nasdaq U.S. Buyback Achievers Index. It turns out that companies that place a priority on growing dividends over time are generally distinct from those that execute buybacks.  
  
Over time, dividends have been more stable than buybacks, and arguably represent a stronger and more lasting signal by management in their confidence in the future growth of their business. Management teams are far more reticent to eliminate a dividend, and investors in turn have come to take dividend cuts as a greater “tell” on underlying business health.
 
Meanwhile, buybacks often “come” when times are good and quickly ”go” when conditions change. Indeed, buyback volumes dropped precipitously after the great financial crisis and also at the onset of the COVID-19 pandemic.
 
dv11_buybacks_dividends.png
Source: Standard & Poor’s. Based on S&P 500 Index data from 12/31/2007 to 12/31/2021.


Comparing Returns over Time

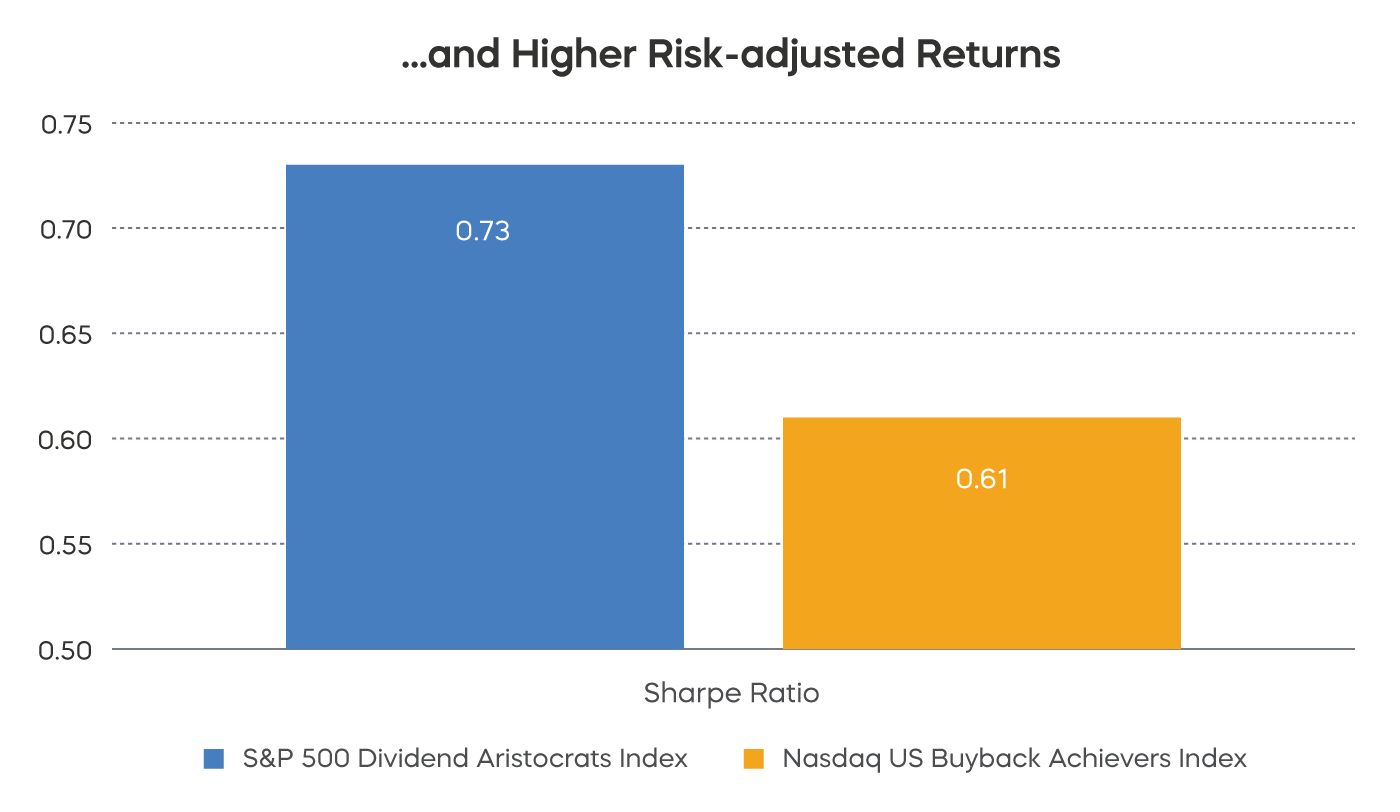
Since common inception, the S&P 500 Dividend Aristocrats Index has generated returns on par with the Nasdaq U.S. Buyback Achievers Index; however, the Dividend Aristocrats Index has produced significantly greater risk-adjusted returns. The buyback index has been significantly more volatile and has exhibited larger drawdowns and down-capture ratios relative to the broad market—an important distinction between the strategies in a market where volatility may linger. Of course, there is no guarantee these indexes will always perform this way.

dv11_dividend_growth_similar_returns.png
Source: Morningstar, from 12/20/2006 4/30/2022.
 
dv11_higher_risk.png
Source: Morningstar, from 12/20/2006 4/30/2022. Sharpe Ratio is a risk-adjusted measure calculated by using standard deviation and excess return to determine reward per unit of risk.


The Takeaway

As capital allocation policies continue to normalize, investors will be closely watching dividend and buyback activity. While both approaches are investor-friendly components of shareholder yield, there are important distinctions for asset allocators. Dividend growth over time potentially delivers a stronger and more consistent signal to shareholders of a company’s future prospects. In addition, a dividend growth approach has delivered higher risk-adjusted returns over time.

Get the latest perspectives and updates.

Past performance does not guarantee future results.

This is not intended to be investment advice. Any forward-looking statements herein are based on expectations of ProShare Advisors LLC at this time. ProShare Advisors LLC undertakes no duty to update or revise any forward-looking statements, whether as a result of new information, future events or otherwise.

Investing is currently subject to additional risks and uncertainties related to COVID-19, including general economic, market and business conditions; changes in laws or regulations or other actions made by governmental authorities or regulatory bodies; and world economic and political developments.

The "S&P 500® Dividend Aristocrats® Index" is a product of S&P Dow Jones Indices LLC and its affiliates and has been licensed for use by ProShares. "S&P®" is a registered trademark of Standard & Poor's Financial Services LLC ("S&P") and "Dow Jones®" is a registered trademark of Dow Jones Trademark Holdings LLC ("Dow Jones") and have been licensed for use by S&P Dow Jones Indices LLC and its affiliates. ProShares have not been passed on by these entities and their affiliates as to their legality or suitability. ProShares based on this index are not sponsored, endorsed, sold or promoted by these entities and their affiliates, and they make no representation regarding the advisability of investing in ProShares. THESE ENTITIES AND THEIR AFFILIATES MAKE NO WARRANTIES AND BEAR NO LIABILITY WITH RESPECT TO PROSHARES.

ProShares are distributed by SEI Investments Distribution Co., which is not affiliated with the funds’ advisor or sponsor.

Your use of this site signifies that you accept our Terms and Conditions of Use.