Don’t Forget About Quantitative Tightening
Key Observations

Our takeaway from Federal Reserve Chairman Jerome Powell’s recent Jackson Hole address: Rising rates and sticky inflation will likely be around for some time. The stock market was hit hard, with the S&P 500 declining nearly 6% by the end of the month. The bond market, however, had already gotten the message. The yield on the 10-Year U.S. Treasury had already risen nearly 50 bps in August, prior to Chairman Powell’s speech.
It was quite the hawkish speech, with one intriguing omission. Chairman Powell didn’t mention Quantitative Tightening. And it’s about to get big. On June 1, the Fed began shrinking its balance sheet at a pace of $47.5 billion per month. On September 1, that pace doubled to $95 billion. It’s a big deal. As a reminder, let’s look at what happened to 10-Year Treasury yields during the so-called Taper Tantrum.
Chart of the Month
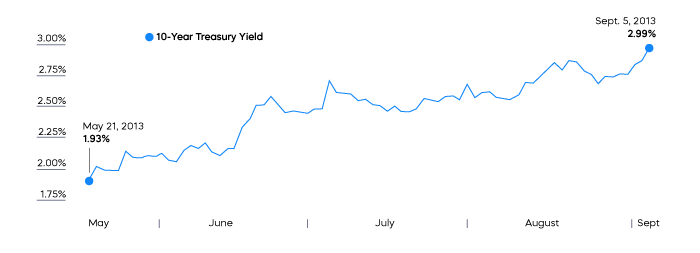
The Taper Tantrum’s moniker was accurate; it was merely a slowing of the pace of Quantitative Easing. That is, the Fed slowed their pace of bond buying and the increasing of the size of their balance sheet. This time, however, the balance sheet is actually shrinking.
Looking for some good news? The two-year breakeven inflation rate fell nearly 90 bps in August to 2.38%—that’s down from a high of nearly 5% in March. The market appears to have faith in the Fed’s ability to get inflation down to near its 2% target. What’s unknown, of course, is how soft will the landing be.
The stock market’s reaction to Chairman Powell’s speech was in part driven by the chairman noting that it might not be so soft. For a little optimism, consider this: Much of the rest of the world is quite unstable. The U.S. economy could get a competitive boost resulting from a very weak Europe and an uncertain path in China. That could be an important ingredient in softening the landing, at least domestically.
Performance Recap
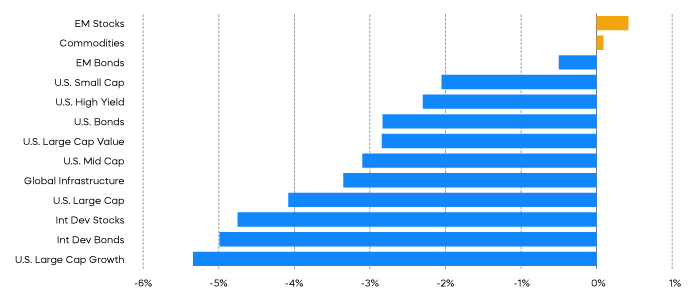
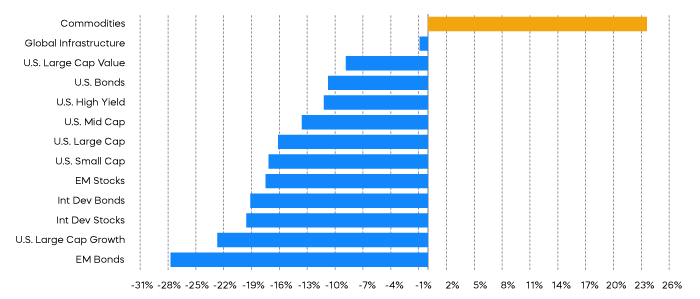
Asset Class Returns—Year to Date
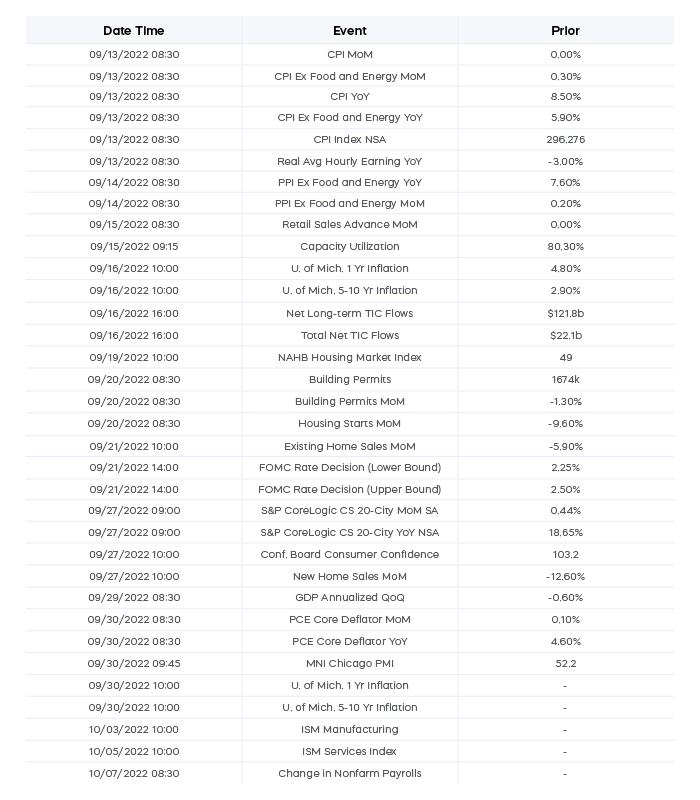
Economic Calendar
Equity Perspectives

The recent market rally off the lows in mid-June seemed to be fueled by two main drivers.
First, despite skepticism around analyst forecasts, corporate America delivered better-than-expected earnings through the first half of the year. Optimism on this front seems to remain, as full-year 2022 forecasts call for nearly 8% growth for S&P 500 companies. Estimates are even higher for mid and small caps. (Source: FactSet, as of 9/2/22)
Second, and perhaps more intriguing, was the perception by some that the Fed was going to embrace a less restrictive monetary policy after inflation readings finally began to moderate—a dovish Fed pivot perhaps. Fed Chairman Powell disabused anyone with that notion during his Jackson Hole speech, which was brief but unmistakably hawkish. We believe his forecast conveyed the message that the economy would likely require a restrictive policy rate for some time. The rally reversed, with the S&P 500 falling below its 50-day moving average, and most market segments registered negative performance for the month of August. Chairman Powell’s statement also served to remind investors of the mantra: “Don’t fight the Fed.”
When the Fed was conducting quantitative easing, a simple but generally effective playbook for investors was to lengthen duration in fixed income and move further out the equity risk spectrum. As we move toward quantitative tightening, not fighting the Fed takes a different approach.
While rising interest rates have clear consequences for fixed income portfolios, the implications for equities are more nuanced. Certain types of equity strategies have performed better in periods of rising rates than others. The key is knowing where to place measured risks.
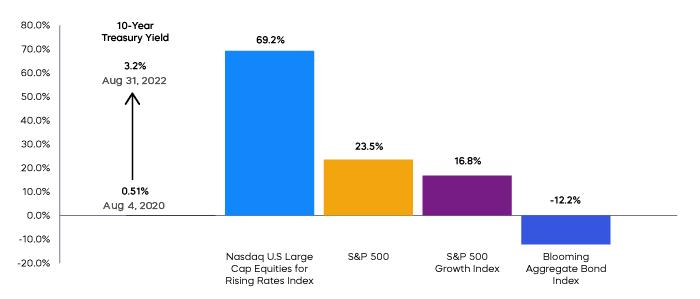
From a style perspective, growth stocks—particularly those with a combination of high valuations and low or no profitability—are likely to continue to come under pressure. Indeed, the S&P 500 Growth Index has underperformed in August and on a year-to-date basis. Conversely, higher-quality stocks with earnings resiliency, stable cash flows and growing dividends seem well positioned to continue to outperform. The S&P 500 Dividend Aristocrats Index, for example, has outperformed during the same periods.
Another opportunity for equity investors to outperform during rising rates could come from focusing on sectors. Sectors have shown varying degrees of correlation to changes in interest rates, and every rate cycle is different, but patterns have emerged over time. Some sectors, such as utilities and real estate stocks, have typically demonstrated negative correlations to movements in the 10-Year Treasury. When rates move higher, these sectors have tended to move lower. Other sectors like health care and consumer staples haven’t tended to show any relationship to movements in interest rates. But certain sectors—energy and financials, for example—have often displayed meaningful correlations to rates. These two sectors have also delivered the highest performance since rates bottomed in August of 2020. Strategies that can focus on sectors with high correlation levels to interest rates may be positioned for outperformance.
One such strategy, the Nasdaq U.S. Large Cap Equities for Rising Rates Index, was designed to outperform large-cap equities during rising rate periods. The rules-based index selects the five sectors with the highest recent correlation levels. Then, rather than holding all stocks from those five sectors, the index selects only the 50 stocks (10 from each of the five sectors) that have had the highest levels of correlation to 10-Year Treasury rates.
The strategy has fared quite well during the current period of rising rates. As designed, the Nasdaq U.S. Large Cap Equities for Rising Rates Index outperformed during August when rates resumed their upward trajectory, and it has also outperformed large caps on a year-to-date basis. Going back to August 4, 2020 when rates bottomed, the index has outperformed the S&P 500 by over 44% on a cumulative basis.
Fixed Income Perspectives
Rising Treasury yields put almost all fixed income segments in the red for the month of August. Only those segments with potential defenses from rising interest rates stayed in the green.
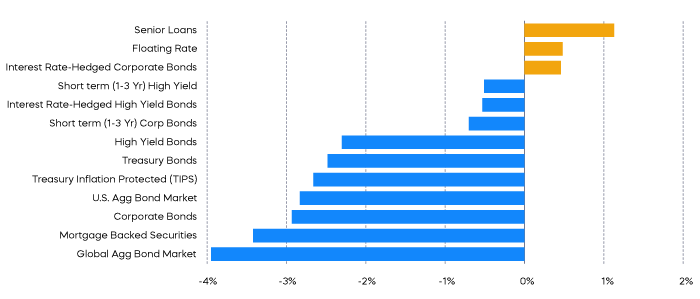
With a combination of sticky inflation and Quantitative Tightening likely to continue to push treasury yields higher, senior loans and floating-rate loans that pay out increasingly higher coupons when rates rise may sound compelling. Let’s take a closer look.
Floating-rate bonds are investment-grade bonds that typically have short maturities. The floating-rate structure may indeed protect from rising interest rates, but the combination of high-quality credit and short maturities means that these are typically low-risk instruments with returns only slightly better than cash. As of August 31, the spread-to-treasury (the difference in yield between a fixed-income security and a treasury security of similar maturity) for an A-rated bond with a maturity of one year was 10 bps. Meanwhile, according to Bloomberg, the spread for an A-rated bond with a 10-year maturity was 130 bps. The takeaway: Floating-rate bonds offer low risk and low return.
Senior loans are floating-rate, below-investment-grade bonds with longer maturities. They have credit risk, and there is a good case for credit risk right now. On average, corporate debt levels are low. Net debt/EBITDA for the S&P 500 is just a smidge over 1X right now compared to an average of over 2.5X since 1990 (Source: Bloomberg). Even inflation can help, at least for fixed-coupon borrowers. An inflated revenue line can help make it easier for companies to pay fixed-coupon obligations, even if their bottom-line margins shrink. But the floating-rate structure eliminates this potential benefit. In fact, floating-rate debt can burden companies—especially lower-rated companies—with greater than expected debt payments. Those higher debt payments could mean greater credit risk for investors.
Sources for data and statistics: Bloomberg, FactSet, Morningstar, and ProShares.
The different market segments represented in the performance recap charts use the following indexes: U.S. Large Cap: S&P 500 TR; U.S. Large Cap Growth: S&P 500 Growth TR; U.S. Large Cap Value: S&P 500 Value TR; U.S. Mid Cap: S&P Mid Cap TR; U.S. Small Cap: Russell 2000 TR; International Developed Stocks: MSCI Daily TR NET EAFE; Emerging Markets Stocks: MSCI Daily TR Net Emerging Markets; Global Infrastructure: Dow Jones Brookfield Global Infrastructure Composite; Commodities: Bloomberg Commodity TR; U.S. Bonds: Bloomberg U.S. Aggregate; U.S. High Yield: Bloomberg Corporate High Yield; International Developed Bonds: Bloomberg Global Agg ex-USD; Emerging Market Bonds: DBIQ Emerging Markets USD Liquid Balanced.
The S&P 500 is a benchmark index published by Standard & Poor's (S&P) representing 500 companies with large-cap market capitalizations. The S&P 500 Dividend Aristocrats targets companies that are currently members of the S&P 500 that have increased dividend payments each year for at least 25 years. S&P 500 Growth Index is an index that represents the fastest-growing companies in the S&P 500. The Nasdaq U.S. Large Cap Equities for Rising Rates Index consists of U.S. securities whose stock prices have historically exhibited relatively high correlation to movements in interest rates. THESE ENTITIES AND THEIR AFFILIATES MAKE NO WARRANTIES AND BEAR NO LIABILITY WITH RESPECT TO PROSHARES.
This is not intended to be investment advice. Indexes are unmanaged, and one cannot invest directly in an index. Past performance does not guarantee future results.
Any forward-looking statements herein are based on expectations of ProShare Advisors LLC at this time. Whether or not actual results and developments will conform to ProShare Advisors LLC’s expectations and predictions, however, is subject to a number of risks and uncertainties, including general economic, market and business conditions; changes in laws or regulations or other actions made by governmental authorities or regulatory bodies; and other world economic and political developments. ProShare Advisors LLC undertakes no duty to update or revise any forward-looking statements, whether as a result of new information, future events or otherwise.
Investing is currently subject to additional risks and uncertainties related to COVID-19, including general economic, market and business conditions; changes in laws or regulations or other actions made by governmental authorities or regulatory bodies; and world economic and political developments.
Investing involves risk, including the possible loss of principal. This information is not meant to be investment advice.
The “S&P 500®" and “S&P 500® Dividend Aristocrats Index” are products of S&P Dow Jones Indices LLC and its affiliates. "S&P®" is a registered trademark of Standard & Poor’s Financial Services LLC (“S&P”), and “Dow Jones®" is a registered trademark of Dow Jones Trademark Holdings LLC (“Dow Jones”) and they have been licensed for use by S&P Dow Jones Indices LLC and its affiliates. All have been licensed for use by ProShares. Nasdaq® is a registered trademark of Nasdaq, Inc. and is licensed for use by ProShare Advisors LLC. ProShares based on these indexes are not sponsored, endorsed, sold or promoted by these entities or their affiliates, and they make no representation regarding the advisability of investing in ProShares. THESE ENTITIES AND THEIR AFFILIATES MAKE NO WARRANTIES AND BEAR NO LIABILITY WITH RESPECT TO PROSHARES.