Three Reasons to be Optimistic About U.S. Equities
Key Observations

September saw losses across just about every segment of the equity, bond and commodities markets. There are, nonetheless, three good reasons we believe for investors to be optimistic about U.S. equities:
-
Valuations are generally reasonable.
-
The Federal Reserve may be achieving their objectives.
-
The U.S. economy is relatively well positioned.
Chart of the Month
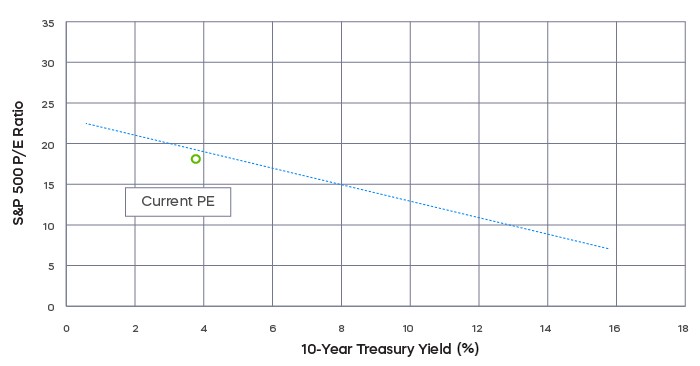
-------------- Linear trendline of the 10 Yr Treasury Yield to the S&P 500 P/E ratio
Consensus estimates call for an additional 10-15% growth in earnings for 2022. Since we are close to the end of the year and 18X lies near this trend line, you could conclude that the S&P 500® is priced for no further earnings growth this year—or to potentially miss expectations by 10-15%. With that information, it appears valuations are reasonable. (Source: Bloomberg)
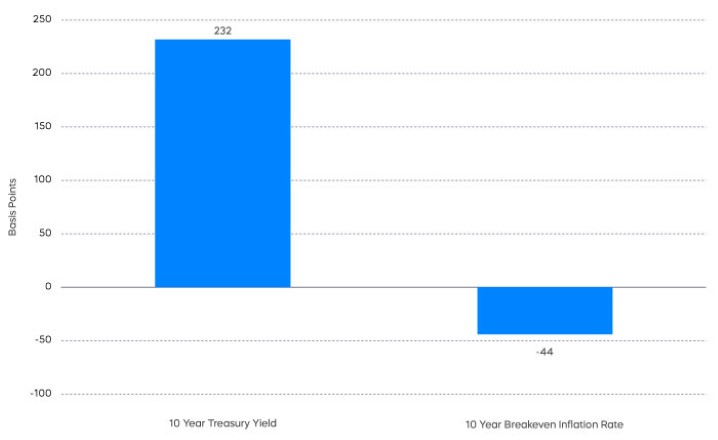
The Federal Reserve: There has been a pervasive refrain that the Fed was late, and it won’t be able to get inflation under control. Here is a data point that counters that narrative. The two-year breakeven inflation rate—a measure of the markets expectation for inflation two years in the future—was 1.98% at the end of September. That’s right on the Fed’s 2% target and down from a peak of nearly 5% in March. So, the Fed may be achieving its objective. (Source: Bloomberg)
The U.S. Economy: While near-term prospects for the U.S. economy may not be robust, they are better than much of the rest of the world. Consensus estimates for U.S. GDP growth for 2023 stand at 0.8%. That compares to 0.2% for a Eurozone challenged by war and negative 0.2% for a United Kingdom challenged by Brexit and political instability (Source: Bloomberg). The U.S. economy could experience a competitive boost resulting from European weakness, increasing the odds of a soft landing, at least domestically.
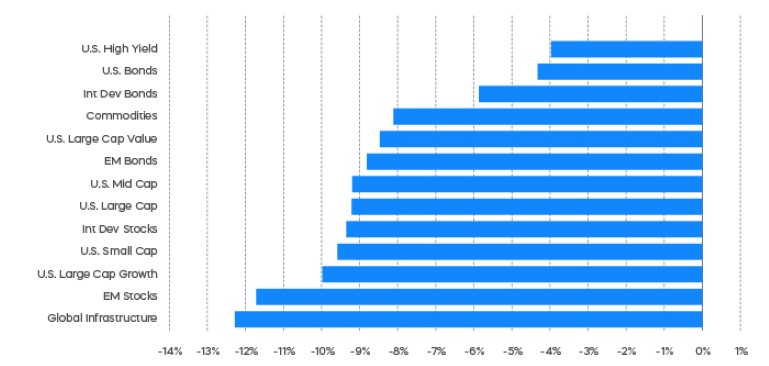
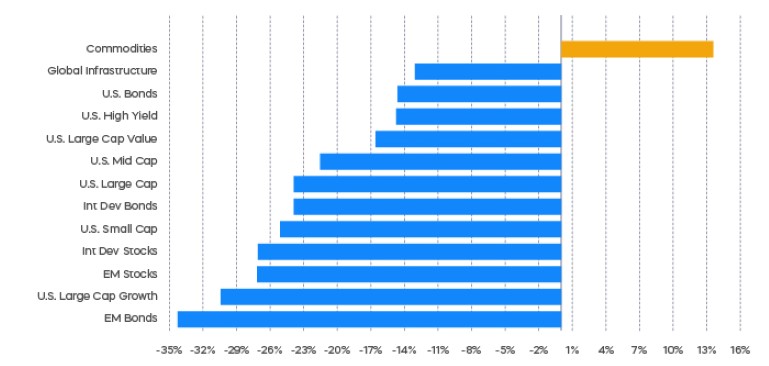
Performance Recap
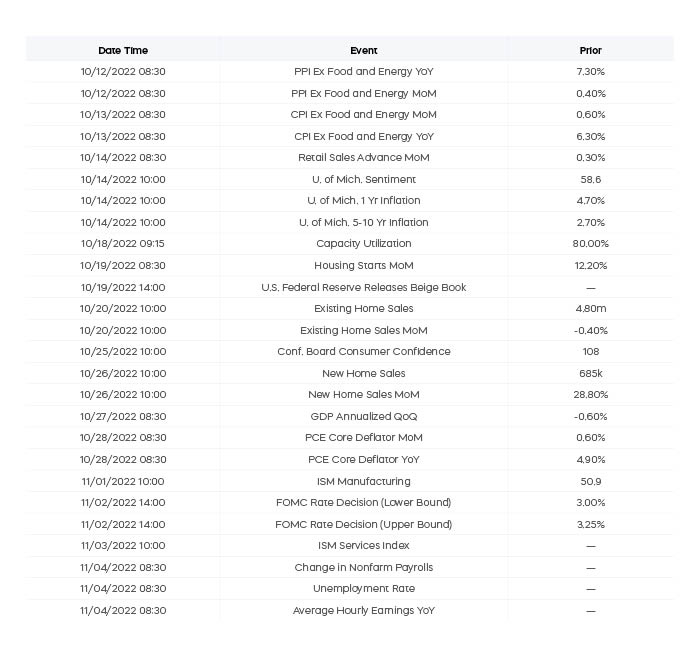
Economic Calendar
Equity Perspectives

Last month’s equity market performance did nothing to alter September’s historical record of producing the market’s weakest returns. Much of the cause this time sits with a steadfastly hawkish Fed, which delivered its third consecutive hike of 75 basis points to the Fed Funds rate. Where it all ends remains to be seen, but more rate hikes seem likely for what is turning out to be one of the most aggressive tightening cycles on record. As a result, certain segments of the economy, like housing, are already slowing significantly. And we believe more economic pain will follow.
The markets take their own distinct path in the face of rising rates, so some historical perspective may be useful for investors.
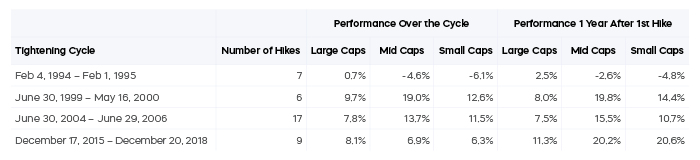
Despite market weakness since the Fed started hiking rates in March, 2022, stocks can and have performed quite well during previous cycles. There have been four rate-hike cycles—periods in which the Fed has raised the Federal Funds Rate on multiple occasions over an extended time—during the past 30 years. While each had different circumstances, examining the performance of different market segments during those cycles may offer clues to investors who want to reallocate their portfolios or put new capital to work.
Historical data provides some basis for optimism. Markets have tended to move lower in the months immediately following the first increase in the Fed Funds rate of a cycle, but they have also recovered quickly and done fine over the full cycle.
The table below shows the performance of large-cap (S&P 500), mid-cap (S&P MidCap 400) and small-caps (Russell 2000 Index) equities during the last four Fed hiking cycles. In most cases, stocks across the capitalization spectrum delivered positive performance over the full cycle, and the performance of mid-cap and small-cap stocks is particularly noteworthy. Despite a perception that smaller-cap stocks underperform when rates move higher, mid-cap and small-cap stocks outperformed large caps during the years after the first hikes.
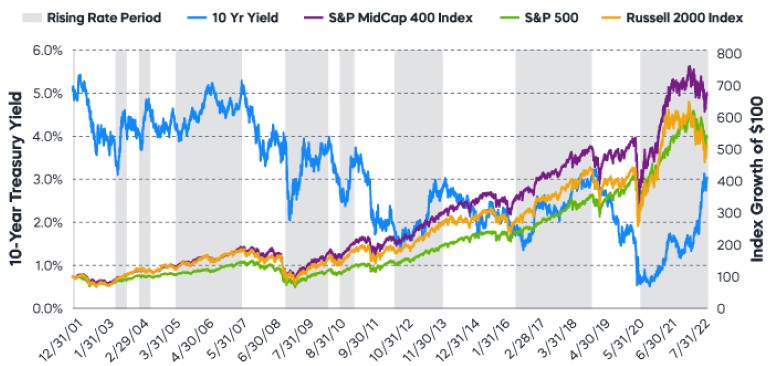
Another way to assess equity market performance during periods of rising rates is to examine periods when the 10-year Treasury yield has spiked. While there is overlap in the time periods, this approach paints a similar picture—smaller caps have been a solid investment.
Investors may want to be selective with their mid-cap allocations in what remains a difficult equity environment. A potential solution worth consideration is a dividend growth strategy, which has a history of weathering market turbulence. Akin to their large-cap peers, the S&P MidCap 400 Dividend Aristocrats are high-quality stocks that have grown their distributions for at least 15 consecutive years. And the S&P MidCap 400 Dividend Aristocrats Index has outperformed the S&P MidCap 400, delivering an attractive combination of upside and downside capture that may be just right for the times (Source: Morningstar, 2/1/15-9/30/22).
“Up capture ratio” measures the performance of a fund or index relative to a benchmark when that benchmark has risen. Likewise, “down capture ratio” measures performance during periods when the benchmark has declined. Ratios are calculated by dividing monthly returns for the fund’s index by the monthly returns of the primary index during the stated time period and multiplying that factor by 100.
Fixed Income Perspectives
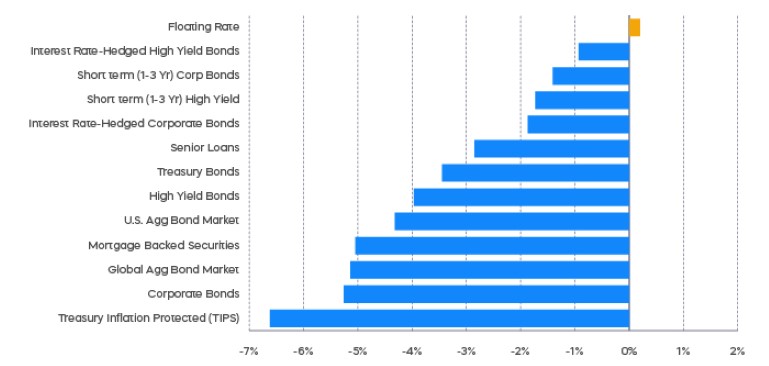
Rising Treasury yields put all but one fixed income segment in the red for the month of September.
In previous sections, we noted that there was some good news and reasons for optimism. Inflation expectations have come down. Here’s the challenging news: Interest rates may continue to rise.
Quantitative Tightening removes the artificial suppression of longer-term treasury yields. Even as inflation recedes, and even if shorter-term Treasury yields like the two-year yield may have peaked, longer-term Treasury yields—five-year, 10-year and 30-year—may have further to go. It may be too early to become complacent regarding interest rate risk in the bond market and to rely on long-term Treasurys to provide meaningful upside in the event of a less-than-soft landing.
The different market segments represented in the performance recap charts use the following indexes: U.S. Large Cap: S&P 500 TR; U.S. Large Cap Growth: S&P 500 Growth TR; U.S. Large Cap Value: S&P 500 Value TR; U.S. Mid Cap: S&P Mid Cap TR; U.S. Small Cap: Russell 2000 TR; International Developed Stocks: MSCI Daily TR NET EAFE; Emerging Markets Stocks: MSCI Daily TR Net Emerging Markets; Global Infrastructure: Dow Jones Brookfield Global Infrastructure Composite; Commodities: Bloomberg Commodity TR; U.S. Bonds: Bloomberg U.S. Aggregate; U.S. High Yield: Bloomberg Corporate High Yield; International Developed Bonds: Bloomberg Global Agg ex-USD; Emerging Market Bonds: DBIQ Emerging Markets USD Liquid Balanced.
The S&P 500 is a benchmark index published by Standard & Poor's (S&P) representing 500 companies with large-cap market capitalizations. The S&P MidCap 400 is a benchmark index published by Standard & Poor's (S&P) representing companies with mid-cap market capitalizations. The S&P MidCap 400 Dividend Aristocrats Index targets companies that are currently members of the S&P MidCap 400 that have increased dividend payments each year for at least 15 years. The Russell 2000 Index is a benchmark index published by FTSE Russell representing the smallest 2,000 stocks in the Russell 3000 Index of the U.S. market. THESE ENTITIES AND THEIR AFFILIATES MAKE NO WARRANTIES AND BEAR NO LIABILITY WITH RESPECT TO PROSHARES.
This is not intended to be investment advice. Indexes are unmanaged, and one cannot invest directly in an index. Past performance does not guarantee future results.
Any forward-looking statements herein are based on expectations of ProShare Advisors LLC at this time. Whether or not actual results and developments will conform to ProShare Advisors LLC’s expectations and predictions, however, is subject to a number of risks and uncertainties, including general economic, market and business conditions; changes in laws or regulations or other actions made by governmental authorities or regulatory bodies; and other world economic and political developments. ProShare Advisors LLC undertakes no duty to update or revise any forward-looking statements, whether as a result of new information, future events or otherwise.
Investing is currently subject to additional risks and uncertainties related to COVID-19, including general economic, market and business conditions; changes in laws or regulations or other actions made by governmental authorities or regulatory bodies; and world economic and political developments.
Investing involves risk, including the possible loss of principal. This information is not meant to be investment advice.
The “S&P 500®" and “S&P MidCap 400® Dividend Aristocrats Index” are products of S&P Dow Jones Indices LLC and its affiliates. "S&P®" is a registered trademark of Standard & Poor’s Financial Services LLC (“S&P”), and “Dow Jones®" is a registered trademark of Dow Jones Trademark Holdings LLC (“Dow Jones”) and they have been licensed for use by S&P Dow Jones Indices LLC and its affiliates. The "Russell 2000 Index" and "Russell®" are trademarks of Russell Investment Group ("Russell") and have been licensed for use by ProShares. ProShares based on these indexes are not sponsored, endorsed, sold or promoted by these entities or their affiliates, and they make no representation regarding the advisability of investing in ProShares. THESE ENTITIES AND THEIR AFFILIATES MAKE NO WARRANTIES AND BEAR NO LIABILITY WITH RESPECT TO PROSHARES.