Key Observations

Rarely do we comment on day-by-day, let alone hour-by-hour, market developments in our commentaries. Permit me to break this rule, because a blow-by-blow of recent changes in Treasury yields helps to illustrate the independence between yields and Fed policy.
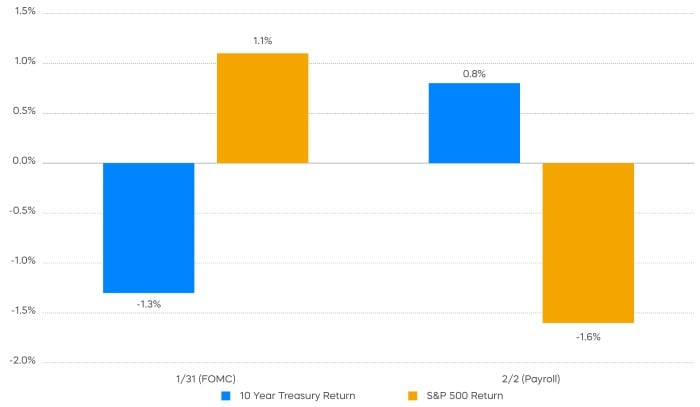
- On January 31, the Federal Reserve held its Fed Funds rate steady, and Chair Powell’s comments appeared move expectations for the beginning of rate cuts farther into 2024.
- In response, Treasury yields fell. The 10-Year Treasury yield opened January 31 with a yield of 4.03%, and it dropped to 3.81% just after 11:00 a.m. on February 1.
- Less than 24 hours later, a surprisingly strong U.S. payroll report drove the yield up again, reaching 4.03% at roughly 11:00 a.m. on February 2.
Why are these yield changes instructive?
Chart of the Month
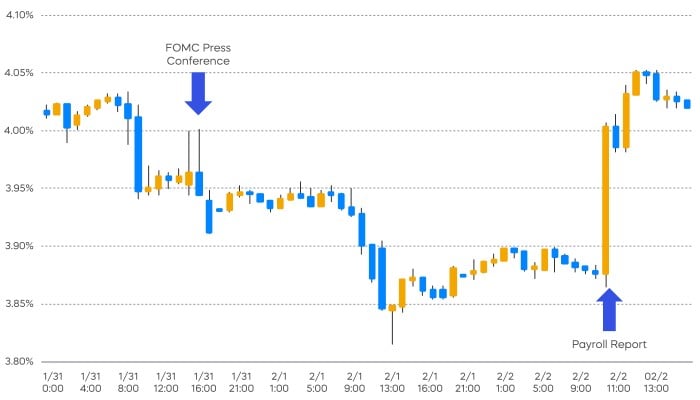
First, why would the longer-term Treasury yield fall in the face of a “higher-for-longer” Fed funds rate? As Chair Powell reminded us last fall, with Quantitative Easing well into the rear-view mirror, longer-term Treasury yields are now operating “independently” of Fed policy. Of course, the market, even for longer-term Treasurys, does not ignore the Fed Funds rate.
Pre-financial crisis, the relationship between Fed Funds and longer-term Treasury yields was at times counterintuitive. It was common for the Fed to increase the Fed Funds rate and see longer-term Treasury yields decline. The higher Fed Funds rate was expected to slow the economy, bring down longer-term inflation and thus bring down longer-term Treasury yields. Is that what happened for 36 hours this week? It’s impossible to know for certain over such a short period of time. But the activity shown above provides a pretty good proof point for the “independence” notion.
Next, payrolls come in surprisingly strong on February 2, and the 10-year Treasury immediately jumps back up to where it was on January 31. Many news headlines pointed to the strong payrolls report as pushing back Fed rate cuts, and thus driving up all Treasury yields. But the 10-Year Treasury yield had just rallied after Chair Powell himself pushed back those expectations. The more likely driver for the rise in the 10-Year Treasury yield is that the strong payroll report suggested a stronger economy, and a little bit higher longer-term inflation.
What’s the important takeaway? Both moves in the 10-Year Treasury yield were more likely about the path of the economy than they were about Fed policy. That means bonds may—after a 15-year absence—finally be positioned as a potential diversifier to stocks. A 4% Treasury yield is potentially high enough that a recession, which would bring down stock prices, could prompt a bond rally that might offset some of those stock losses. For investors who were forced to look to other, perhaps messier, tools that might help in a down stock market, it might be time to look to bonds again.
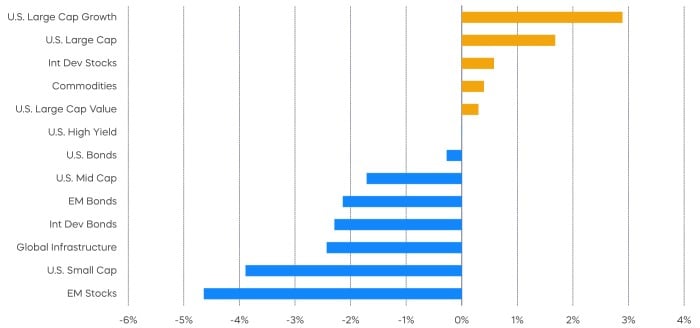
Performance Recap
After a strong performance in 2023, large-cap-growth stocks continued to lead the market higher in January. Small-cap stocks retreated from a fourth-quarter rally last year, while advances in the U.S. dollar weighed on emerging market returns.
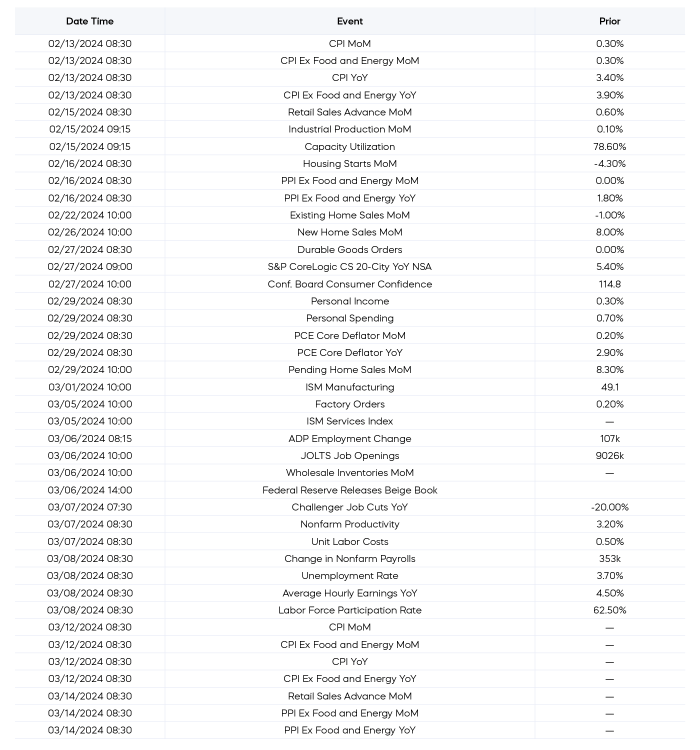
Economic Calendar
Here’s a list of key and upcoming economic releases, which can serve as a guide to potential market indicators.
Equity Perspectives

More of the Same
The calendar says 2024, but the market still feels a lot like 2023: Specifically, positive returns for S&P 500, up 1.7%, even better results for the Nasdaq-100, up 1.9%, a small group of technology-related stocks doing most of the heavy lifting, and other segments of the market muddling along.
As we wrote in our 2024 Market Outlook, we don’t expect potential Fed rate cuts to meaningfully bolster stocks. If anything, we believe that we will see more of the same negative stock reactions we saw on 1/31 when the Fed Chair Powell described a potential March cut as “unlikely.” Any more signals of delays by the Fed could further dampen the already priced-in optimism and lead to more volatility.
We see 2024 being more about fundamentals like earnings growth, and about identifying strategies that may have been left behind in last year’s rally for no good reason. With stock market concentration levels reaching historic extremes, we think a focus on equally weighted, reasonably priced strategies like Dividend Aristocrats represents an opportunity. Dividend Aristocrats also have a the potential to deliver resilient levels of earnings growth, even as expectations for double-digit growth in 2024 for the S&P 500 are decreasing.
The Covered Call Conundrum
Another aspect of the markets from recent years that seems likely to endure in 2024 is the hunt for yield. Even as fixed-income rates have started to normalize, mid-single-digit yields still don’t seem to be offering investors adequate levels of income.
Covered call strategies have become popular with investors looking to fill some of that void. But traditional covered call strategies, which write options that expire on a monthly basis, present investors with a conundrum. There is a fundamental tradeoff that investors must consider: Traditional covered call strategies can generate high levels of income, but they may also sacrifice some total return over time.
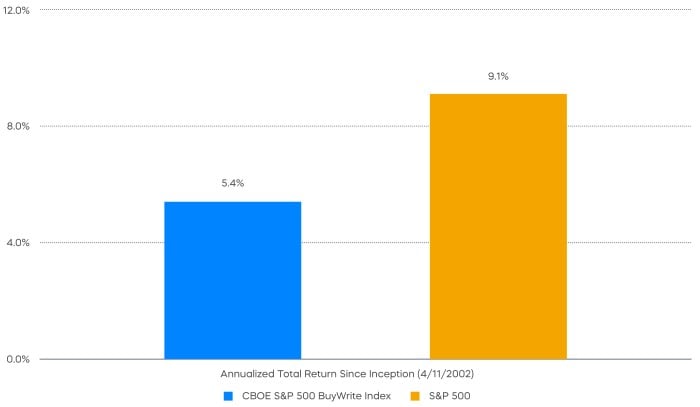
Last year’s results illustrate the picture quite clearly. In 2023, the S&P 500 was up over 26%. The CBOE S&P 500 BuyWrite Index—a proxy for traditional covered call strategies—returned only 11.8%. Going back to its inception, the BuyWrite index lags the S&P 500 by more than 3.5% annualized.
Investors can potentially improve that tradeoff. Shorter-dated options that expire every day of the week—sometimes referred to as daily options—have become popular since their introduction a few years ago, and they offer smart investors some important benefits.
When used in rules-based manner, a covered call strategy writing daily options potentially allows investors to generate high levels of income—and to capture the longer-term returns of the market. The S&P 500 Daily Covered Call Index was recently introduced, and since its introduction in October of 2023, the index has outperformed the CBOE S&P 500 BuyWrite Index by 5.8%. Moreover, investors looking to pursue a daily call options strategy like that of the S&P 500 Daily Covered Call Index can now do so through the convenience of an ETF.
Fixed Income Perspectives

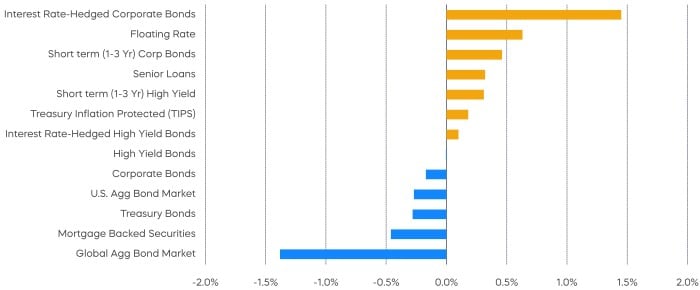
Yields on long-dated Treasury bonds rose, while the rest of the yield curve remained mostly unchanged during the month.
As mentioned at the beginning of this commentary, the market actions in the days following the January FOMC meeting caught our attention, as the Treasury yields moved in a direction contradictory to the Fed’s messaging.
But another important observation was that the bond and the equity market moved in opposite directions. As bonds rallied and yields fell initially, stocks had a negative reaction. Vice versa, when bond prices decreased after a stronger-than-expected employment report, the stock market staged a rebound.
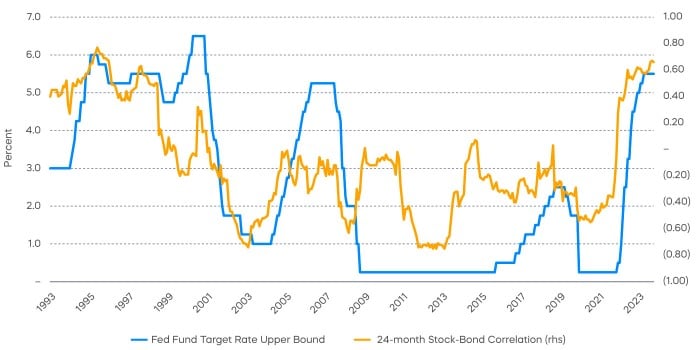
In contrast, stocks and bonds have moved tightly together for most of the past two years. By the end of last year, the 24-month correlation between Treasury bond returns and stock returns have hit the highest level since the 1990s. At first, the rise in stock-bond correlation coincided with the rapid rise of inflation, eroding the status of bonds as a safe haven during equity sell-offs. With inflation cooling, it has been curious to see stock-bond correlation remain at such high levels, as slowing inflation fuels the anticipation of policy easing around the corner. However, it may be only a matter of time before we see a sea change.
If the graph of stock-bond correlation below looks familiar, it’s because it has closely tracked the Fed Funds target rate. We are reminded that, although interest rate cuts don’t necessarily foreshadow an impending recession, the economy has seemingly returned to balance and growth is slowing. Therefore, the ability of bonds to diversify risk should be further restored as the Fed signals rate cuts ahead.
While we’ve argued for some time now that we are in a more normalized interest rate environment, and that long-term interest rates should be priced appropriately higher, bonds may still provide excellent diversification in such an environment.
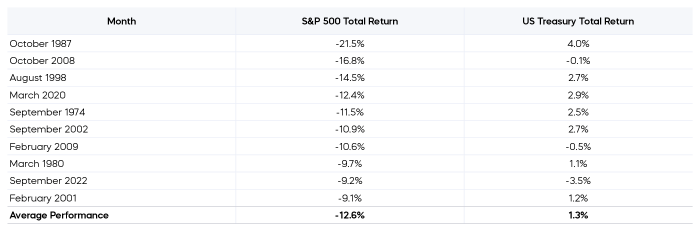
Over the past 50 years, bonds have generally had a solid record of protecting portfolios from equity sell-offs during various types of interest rate regimes. Among the ten worst monthly performances of the S&P 500, Treasury bonds offered the least amount of protection in September 2022, when core CPI reached a cycle high of 6.6%. If market responses after the January FOMC were any indication of a changing dynamic between stock and bonds, duration has a bigger role to play, should there be any growth concerns going forward.
Sources for data and statistics: Bloomberg, FactSet, Morningstar, and ProShares.
The different market segments represented in the performance recap charts use the following indexes: U.S. Large Cap: S&P 500 TR; U.S. Large Cap Growth: S&P 500 Growth TR; U.S. Large Cap Value: S&P 500 Value TR; U.S. Mid Cap: S&P Mid Cap TR; U.S. Small Cap: Russell 2000 TR; International Developed Stocks: MSCI Daily TR NET EAFE; Emerging Markets Stocks: MSCI Daily TR Net Emerging Markets; Global Infrastructure: Dow Jones Brookfield Global Infrastructure Composite; Commodities: Bloomberg Commodity TR; U.S. Bonds: Bloomberg U.S. Aggregate; U.S. High Yield: Bloomberg Corporate High Yield; International Developed Bonds: Bloomberg Global Agg ex-USD; Emerging Market Bonds: DBIQ Emerging Markets USD Liquid Balanced.
The different market segments represented in the fixed income returns charts use the following indexes: Global Agg Bond Market: Bloomberg Global-Aggregate Total Return Index Value Unhedged USD; Mortgage Backed Securities: Bloomberg U.S. MBS Index Total Return Value Unhedged USD; Treasury Bonds: Bloomberg U.S. Treasury Total Return Unhedged USD; U.S. Agg Bond Market: Bloomberg U.S. Agg Total Return Value Unhedged USD; Corporate Bonds: Bloomberg US Corporate Total Return Value Unhedged USD; High Yield Bonds: Bloomberg U.S. Corporate High Yield Total Return Index Value Unhedged USD; Interest Rate-Hedged High Yield Bonds: FTSE High Yield (Treasury Rate-Hedged) Index; Treasury Inflation Protected (TIPS): Bloomberg U.S. Treasury Inflation Notes TR Index Value Unhedged USD; Short term (1-3 Yr) High Yield: Bloomberg U.S. Corporate 0-3 Year Total Return Index Value Unhedged USD; Senior Loans: Morningstar LSTA U.S. Leveraged Loan 100 Index; Short term (1-3 Yr) Corp Bonds: Bloomberg U.S. Corporate 1-3 Yr Total Return Index Value Unhedged USD; Floating Rate: Bloomberg U.S. FRN < 5 yrs Total Return Index Value Unhedged USD; Interest Rate-Hedged Corporate Bonds: FTSE Corporate Investment Grade (Treasury Rate-Hedged) Index.
The S&P 500 is a benchmark index published by Standard & Poor's (S&P) representing 500 companies with large-cap market capitalizations. The S&P 500 Dividend Aristocrats Index targets companies that are currently members of the S&P 500 that have increased dividend payments each year for at least 25 years. The CBOE S&P 500 BuyWrite Index is a benchmark designed to track performance of a portfolio engaged in a buy-write strategy using S&P 500 call options. The S&P 500 Daily Covered Call Index consists of a long position in the S&P 500 Total Return Index and a short position in a one-day, out-of-the-money S&P 500 call option, and the index aims to reflect higher income generation and have lower timing risk by using daily options as opposed to monthly options. THESE ENTITIES AND THEIR AFFILIATES MAKE NO WARRANTIES AND BEAR NO LIABILITY WITH RESPECT TO PROSHARES.
This is not intended to be investment advice. Indexes are unmanaged, and one cannot invest directly in an index. Past performance does not guarantee future results.
Any forward-looking statements herein are based on expectations of ProShare Advisors LLC at this time. Whether or not actual results and developments will conform to ProShare Advisors LLC’s expectations and predictions, however, is subject to a number of risks and uncertainties, including general economic, market and business conditions; changes in laws or regulations or other actions made by governmental authorities or regulatory bodies; and other world economic and political developments. ProShare Advisors LLC undertakes no duty to update or revise any forward-looking statements, whether as a result of new information, future events or otherwise.
Investing involves risk, including the possible loss of principal. This information is not meant to be investment advice.
The “S&P 500®,” “S&P 500® Dividend Aristocrats® Index” and “S&P 500 Daily Covered Call Index” are products of S&P Dow Jones Indices LLC and its affiliates and have been licensed for use by ProShare Advisors LLC. "S&P®" is a registered trademark of Standard & Poor’s Financial Services LLC (“S&P”), and “Dow Jones®" is a registered trademark of Dow Jones Trademark Holdings LLC (“Dow Jones”) and they have been licensed for use by S&P Dow Jones Indices LLC and its affiliates. ProShares ETFs based on these indexes are not sponsored, endorsed, sold or promoted by these entities or their affiliates, and they make no representation regarding the advisability of investing in ProShares ETFs. THESE ENTITIES AND THEIR AFFILIATES MAKE NO WARRANTIES AND BEAR NO LIABILITY WITH RESPECT TO PROSHARES.