Key Observations

What a bond market rally! The 10-year Treasury yield has fallen from just shy of 5% on October 19 to 4.2% on December 1. According to many market observers, if not most, this rally has clearly been driven by expectations of Federal Reserve rate cuts.
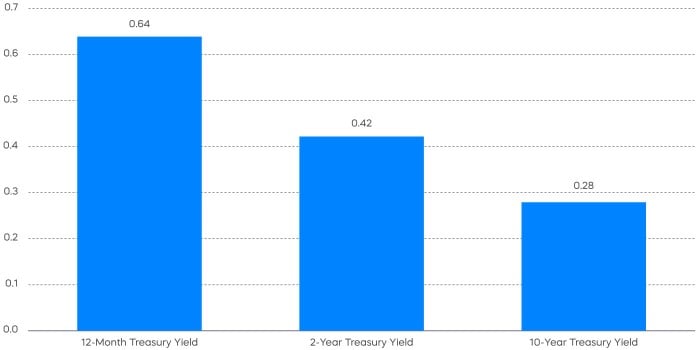
Perhaps it’s time for a bond market lesson. Prior to the Great Recession, it was widely accepted that the Fed controlled only the Fed Funds rate and that market forces drove the rest of the yield curve. Here’s the historical evidence:
-
Prior to the Great Recession, the correlation of Fed Funds with Treasury yields diminished further out on the yield curve and was nearly uncorrelated with the 10-year Treasury yield.
-
Longer-term interest rates had been driven by longer-term inflation expectations until the innovation known as Quantitative Easing was created during the Great Recession—the Fed bought long-term bonds to force longer-term yields lower.
-
Quantitative Tightening marks the end of Quantitative Easing and the return of control of longer-term interest rates to market forces.
Federal Reserve Chair Powell made precisely this observation in his comments on November 1, observing: “it does not appear that an expectation of higher near-term policy rates is causing the increase in longer-term rates.”
It’s important to insert a point about symmetry here. If the rise in longer-term Treasury rates was not driven by an expectation of hikes in the Fed Funds rate, then the fall in longer-term Treasury rates is not necessarily driven by expectations of cuts. Despite commentaries pointing to expected Fed cuts as the driver, many market observers seem to be getting the message.
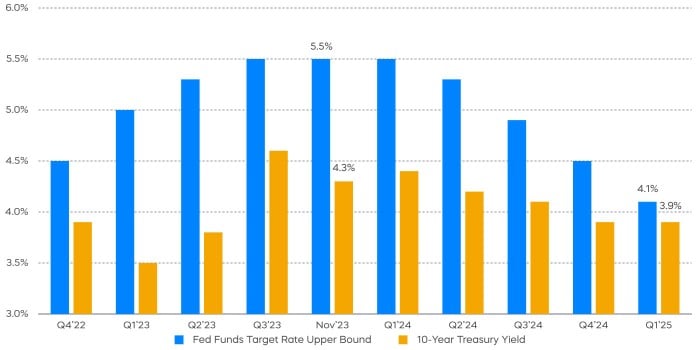
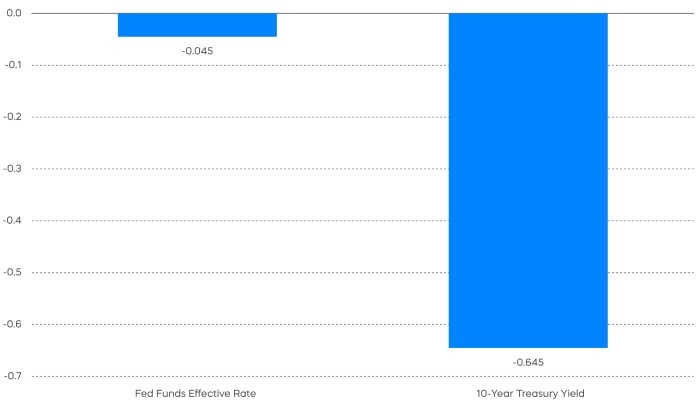
Bloomberg consensus forecasts for the first quarter of 2025 note a 150 basis point decline in the Fed Funds rate, but a 10-year Treasury yield that’s less than 50 bps lower than today. Here’s some context for that 10-year Treasury forecast:
- The long-run average yield on the 10-year Treasury is about 4%, typically consisting of 2% inflation and 2% real yield. (Of note, the 10-year Treasury yield on 11/30 was 4.32%.)
- The 10-year breakeven inflation rate stood at 2.3%, leaving the real yield right at 2%.
The bond math is clear. Long-term Treasury yields are right around their long-term average. With current inflation heading lower and inflation expectations right around the magic 2% level, it seems reasonable to believe that those yields will remain range-bound in 2024.
If the best guess for 2024 is that the Fed will begin cutting the Fed Funds rate but longer-term interest rates will remain relatively steady, where does that leave stocks?
and 10-Year Yields to the S&P 500
Over the last couple of years, longer-term interest rates have had an expected inverse relationship with stocks—higher interest rates have driven price-to-earnings (P/E)1 multiples down, and lower interest rates have driven P/E multiples higher. But, this relationship has only been true for longer-term interest rates. The dramatic increase in Fed Funds rate has not brought down stocks.
Here’s the flip side. Cuts in the Fed Funds rate may not help stocks. It is the potential stability of longer-term interest rates that could keep P/E multiples stable in 2024—leaving stocks at the mercy of earnings.
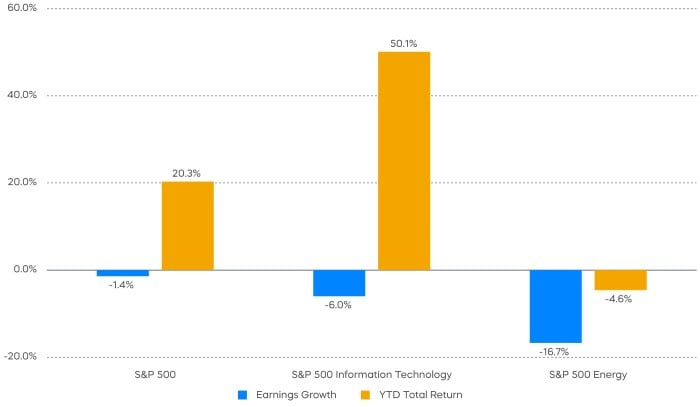
Stocks were generally not at the mercy of earnings in 2023. The S&P 500’s 20% gain had no significant assistance from earnings. Perhaps more intriguing, the high-flying technology sector saw a decline in earnings in 2023, as did the energy sector. But only one of those sectors—technology—delivered more than double the return of the S&P 500.
The consensus earnings forecast for 2024 calls for about a 10% year-over-year increase in earnings in 2024. Assume a flat P/E multiple and tack on a 1.5% dividend, and you’ve got an 11.5% total return for stocks in 2024. That seems reasonably consistent with a soft-landing economy.
But let’s get back to tech. The 2023 run-up in tech has stretched the sector’s valuation to 150% of the P/E of the S&P 500. That wasn’t supported by earnings in 2023—but the market should be forward-looking, right? Consensus expectations are calling for some of this bill to be paid in 2024—calling for a 15% increase year over year.
The tech-sector risk would appear to be twofold: meeting higher expectations, and whether meeting those expectations will be sufficient payment on 2023’s tab. Let’s make that three-fold by adding concentration risk: Apple, Microsoft and NVIDIA account for over 50% of the tech sector’s market cap.
2024 has a good chance, on average, of being a decent year for stocks. The problem with averages, however, is that one can have one hand in boiling water and the other in a bucket of ice and “on average” be fine. A good outcome for an investor in 2024 may depend on finding a prudent path for tech exposure, differentiating between the stocks that were left behind in 2023 for good reason and those that present opportunity.
Equity Perspectives

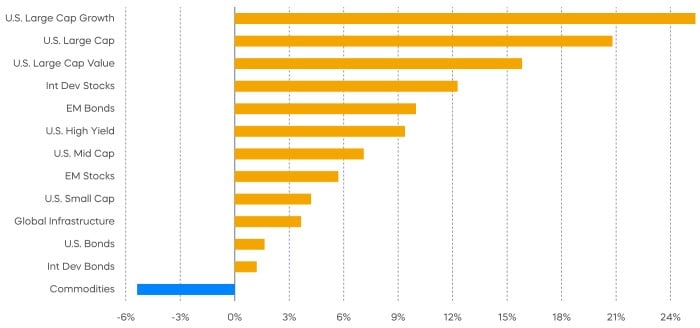
U.S. Large Cap Growth topped the charts, but every stock and bond segment made it into the green by the end of November. Commodities were the lone negative bar.
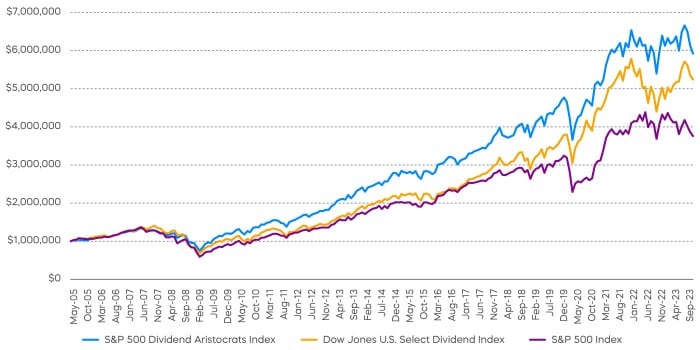
Dividend strategies—like most equity segments—have underperformed market benchmarks in what has been a deceptively muted equity environment in 2023. While underperforming lately, a longer-term perspective is needed to appreciate how they have stood the test of time.
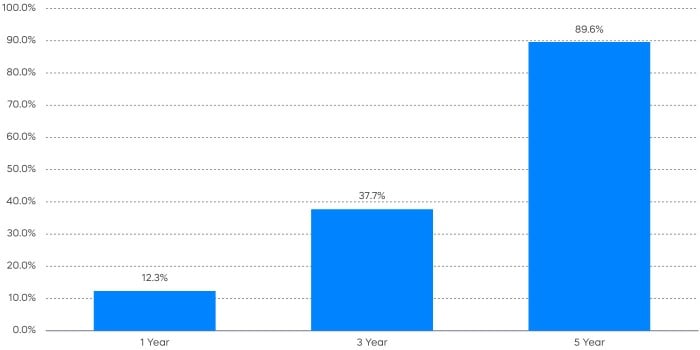
Since their index’s inception in 2005, the S&P 500 Dividend Aristocrats have grown wealth, and they have outperformed high dividend yield and the S&P 500, with lower levels of volatility. That is a remarkable feat given that Standard & Poor’s latest SPIVA Report (S&P Index versus Active) card shows that over 85% of large-cap funds have underperformed the S&P 500 over the previous 10-year period.
The individual members of the exclusive S&P 500 Dividend Aristocrats Index have also stood the test of time. It takes 25 consecutive years of dividend growth to become a Dividend Aristocrat, and over that time, approximately 80% of them have beaten the S&P 500. The average Dividend Aristocrat has delivered 10.2% annualized returns over that period, 2.7% more than the S&P 500. Tough times may not last, but the Aristocrats’ performance records have endured over time.
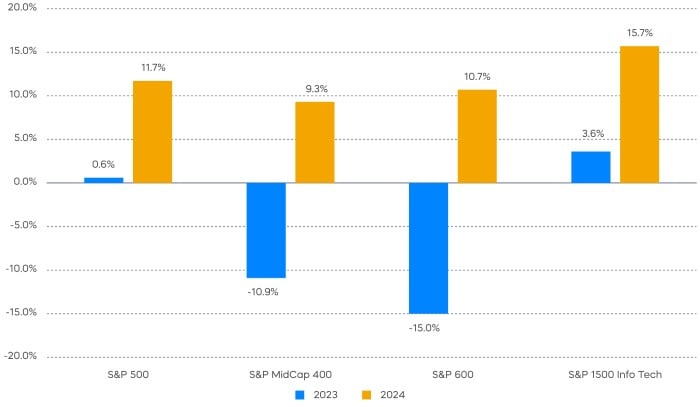
Consensus earnings expectations for 2024 indicate that the earnings recession of 2023 should be behind us. An interesting point is that the acceleration in earnings spans market caps and arguably the most important sector—Information Technology. However, some will question such optimism against the backdrop of a still slowing economy.
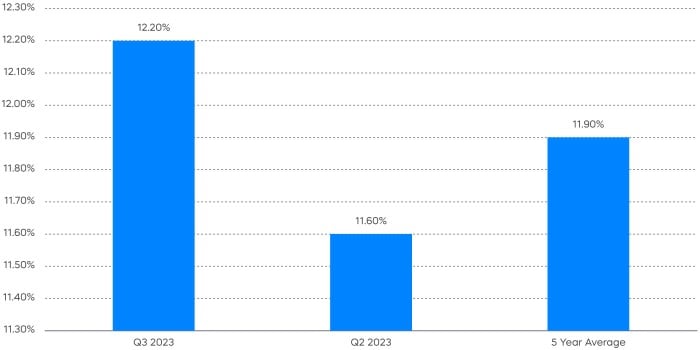
One key metric that may provide a clue is profit margins, which had been falling as input costs had spiked post-pandemic. Now that inflation is cooling, companies have been better able to manage their costs, which has stabilized margins. Once profit margins stabilize, earnings growth tends to follow. S&P 500 margins have been doing just that, with Q3 margins at 12.2% vs. 11.6% a quarter ago.
This key point supports our favorable view on quality strategies like the Dividend Aristocrats, which have historically delivered more resilient margins and earnings growth than the broad market.
Identifying growth amidst a slowing economic backdrop can be challenging, especially after the lights-out performance in 2023 of mega-cap technology stocks. The law of averages seems to indicate a repeat of near triple-digit returns is unlikely, especially given rich valuations. We continue to look favorably on the technology sector for two main reasons:
- First, tech stocks are expected to deliver the highest revenue growth of any sector in 2024 with the fattest margins. This means more profits and cash flows are likely.
- Second, for select mature and profitable tech stocks like the S&P Technology Dividend Aristocrats, dividends are growing rapidly.
Warren Buffett reminded us that growing dividends has been the “secret sauce” to identify companies with the potential to outperform over the long term. Here’s potentially the best part. Investors don’t need to overpay for profitable growth. The Technology Dividend Aristocrats currently trade at roughly 21x earnings, an amount less than the S&P 500 and only 60% of the S&P 1500 Information Technology Index (Source: Bloomberg, as of 11/30/23).
Source: FactSet. Data as of 12/4/23.
Fixed Income Perspectives

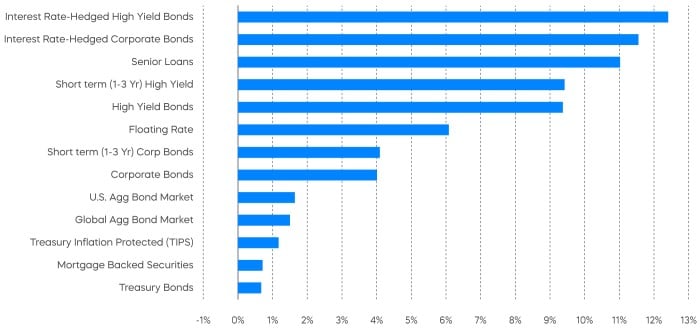
A late-year bond rally in November has put all fixed income segments back in positive territory. Still, with the Federal Reserve’s interest rate hikes this year, rate-hedged and short-duration bonds outperformed, while TIPS and MBS underperformed.
Most market observers now believe that monetary policy was kept too accommodative even as inflation pressure started to build. As historic inflation ensued, the Fed itself admits that it has been “behind the curve” and has repeatedly emphasized its commitment towards returning inflation to its 2% target. For most of 2023, market expectation of breakeven inflation has been anchored close to 2%. Therefore, it seems Chair Powell has succeeded at avoiding being remembered as the Arthur Burns of our time. However, there is now a growing risk that the Fed is behind the curve again on inflation. This time, the near-term inflation risk is on the downside.
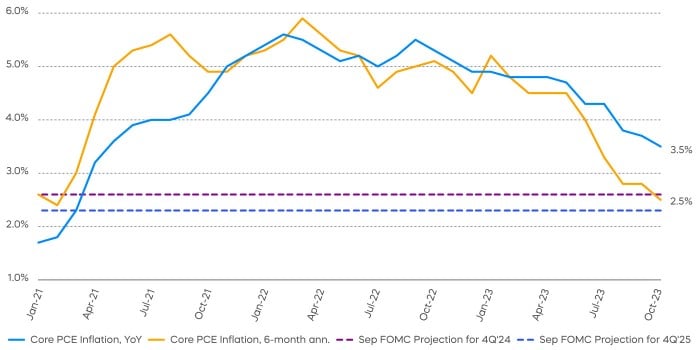
In the September Federal Open Market Committee (FOMC) summary of economic projections, the Fed projected core Personal Consumption Expenditures (PCE)2 inflation to reach 2.6% towards the end of 2024 and 2% only by the end of 2026. These targets appear too conservative to us, as core PCE readings over the last six months have been trending at an annualized rate of 2.5%, already below the Fed’s projection in a year’s time. Goods inflation this year, excluding food and energy, has averaged an annualized rate of just 0.7%. The inflation rate has been mostly held up by services, which make up about two-thirds of the price index
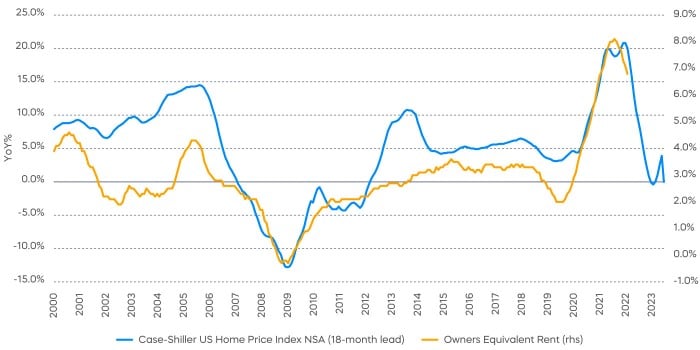
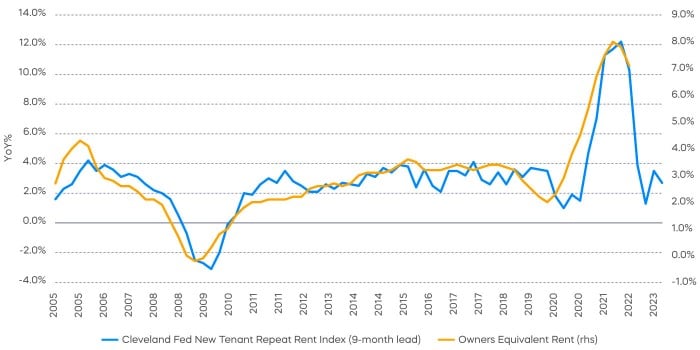
A key component of services that should put further downward pressure on inflation is housing. The majority of housing cost is measured as what’s called “imputed rent of owner-occupied housing,” or “owners’ equivalent rent”—the rental price an individual would pay for an asset they own.
This is intended to separate the cost of living from any change in the price of a home as an asset. Since leases usually renew annually, there is a delay before owners’ equivalent rent can reflect the cost of new leases. In addition, rents typically follow home prices with a lag. Price growth for both new tenant leases and homes has decreased significantly. Housing as a component of core PCE will likely follow in 6-12 months, based on past relationships.
If rent inflation alone falls to 3%—a level close to its long-term average—core PCE would reach the Fed’s target of 2% without a change in any other categories of the price index based on the most recent six-month run rate. It’s also worth mentioning that housing makes up approximately 15% of the PCE index, but more than a third of the CPI index, so the impact should be even more pronounced for the CPI index.
Although the Fed may not want to see financial conditions ease, there will be increasing pressure on the Fed to cut policy rates next year as the path towards achieving inflation target becomes clear.
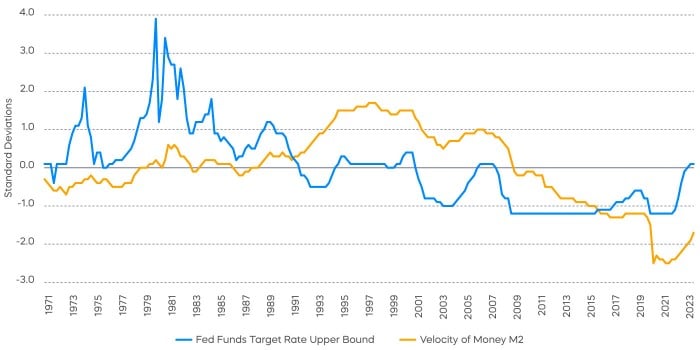
According to Milton Friedman, “Inflation is always and everywhere a monetary phenomenon.” The quantity theory of money (MV=PQ) suggests that price is directly related to money supply as well as the “velocity of money,” or how much people are willing to spend.
The unprecedented increase in money supply during the pandemic is often considered as one of the main drivers of the inflation that followed. As a result of the Fed’s tightening, money supply has shrunk for the first time since the data series began in 1960. While the decrease of money supply should reduce inflation with a lag, it has been offset with an increase in the velocity of money. Almost counter-intuitively, an increase in the Fed Funds rate has corresponded to an increase in the velocity of money.
Prior to the Great Financial Crisis when rates hit zero, money velocity and the Fed Funds rate showed an average rolling five-year correlation of 0.6. With the Fed on hold and potentially cutting interest rates into next year, the full impact of shrinking money supply on inflation may finally be felt.
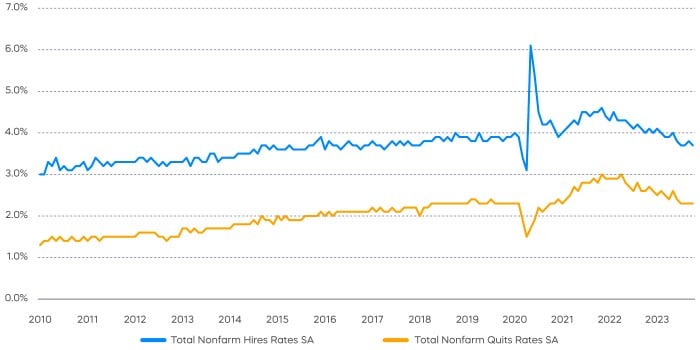
One source of caution for the Federal Reserve to resist declaring victory on inflation is the scenario of a wage-inflation spiral. A high job openings rate, although down from its post-pandemic peak, has been often cited as a sign of a tight labor market. Anecdotally, there has also been a higher number of labor union strikes. On the other hand, hires and quits rates have already reverted back to pre-pandemic levels.
The fact that companies are not hiring more workers, despite posting more job openings, suggests structural shifts due to the pandemic. A higher number of job openings for a given level of unemployment rate could be the result of a worse matching function, as hiring has become more difficult logistically.
In addition, union workers haven’t received the same high wage increases as non-union workers did in the early stage of the post-pandemic recovery. Many union wage negotiations can be considered as playing catch up to non-union workers. The concerns of a wage-inflation spiral may be overblown as wages continue to soften and the labor market returns to balance.
Where Does This Leave Fixed Income in 2024?
Historically, extending duration has performed well after the final interest rate hike by the Fed. The challenge for an asset allocator today is that the term premium has been suppressed by quantitative easing, so a normalizing term premium could support long-term yields even as the Fed cuts short-term interest rates. Therefore, as suggested in the first section of our Market Outlook, longer-term Treasury yields may remain range-bound even as the Fed cuts rates. Meanwhile, the market has already priced in several rate cuts for next year, limiting the potential price gains from holding short-duration bonds.
Despite this, investors could be best positioned to take advantage of the Fed’s conservative stance on inflation by owning the two-year part of the yield curve. A still-inverted yield curve highlights the opportunity in interest-rate hedged bonds—not so much because of a concern of rising interest rates, but because an inverted yield curve means that hedging interest rate risk may generate incremental income rather than incurring a cost. Low levels of debt among large-cap companies point to corporate credit as a reasonable choice, even with tighter spreads. More broadly speaking, corporate credit could benefit from a judicious adjustment in the Fed’s policy that may create a more favorable environment for risk assets.
The different market segments represented in the performance recap charts use the following indexes: U.S. Large Cap: S&P 500 TR; U.S. Large Cap Growth: S&P 500 Growth TR; U.S. Large Cap Value: S&P 500 Value TR; U.S. Mid Cap: S&P Mid Cap TR; U.S. Small Cap: Russell 2000 TR; International Developed Stocks: MSCI Daily TR NET EAFE; Emerging Markets Stocks: MSCI Daily TR Net Emerging Markets; Global Infrastructure: Dow Jones Brookfield Global Infrastructure Composite; Commodities: Bloomberg Commodity TR; U.S. Bonds: Bloomberg U.S. Aggregate; U.S. High Yield: Bloomberg Corporate High Yield; International Developed Bonds: Bloomberg Global Agg ex-USD; Emerging Market Bonds: DBIQ Emerging Markets USD Liquid Balanced.
The S&P 500 is a benchmark index published by Standard & Poor's (S&P) representing 500 companies with large-cap market capitalizations. The S&P 500 Dividend Aristocrats Index targets companies that are currently members of the S&P 500 that have increased dividend payments each year for at least 25 years. The S&P Technology Dividend Aristocrats Index is designed to measure the equal-weighted performance of technology-related companies within the S&P Total Market Index (TMI) that have consistently increased dividends every year for at least seven years. The S&P Composite 1500 Information Technology comprises those companies included in the S&P Composite 1500 that are classified as members of the GICS Information Technology sector. THESE ENTITIES AND THEIR AFFILIATES MAKE NO WARRANTIES AND BEAR NO LIABILITY WITH RESPECT TO PROSHARES.
This is not intended to be investment advice. Indexes are unmanaged, and one cannot invest directly in an index. Past performance does not guarantee future results.
Any forward-looking statements herein are based on expectations of ProShare Advisors LLC at this time. Whether or not actual results and developments will conform to ProShare Advisors LLC’s expectations and predictions, however, is subject to a number of risks and uncertainties, including general economic, market and business conditions; changes in laws or regulations or other actions made by governmental authorities or regulatory bodies; and other world economic and political developments. ProShare Advisors LLC undertakes no duty to update or revise any forward-looking statements, whether as a result of new information, future events or otherwise.
Investing involves risk, including the possible loss of principal. This information is not meant to be investment advice.
The “S&P 500®” and “S&P 500® Dividend Aristocrats® Index” are products of S&P Dow Jones Indices LLC and its affiliates and have been licensed for use by ProShare Advisors LLC. "S&P®" is a registered trademark of Standard & Poor’s Financial Services LLC (“S&P”), and “Dow Jones®" is a registered trademark of Dow Jones Trademark Holdings LLC (“Dow Jones”) and they have been licensed for use by S&P Dow Jones Indices LLC and its affiliates. ProShares ETFs based on these indexes are not sponsored, endorsed, sold or promoted by these entities or their affiliates, and they make no representation regarding the advisability of investing in ProShares ETFs. THESE ENTITIES AND THEIR AFFILIATES MAKE NO WARRANTIES AND BEAR NO LIABILITY WITH RESPECT TO PROSHARES.