Key Observations

It was a rather astounding reversal: By the end of April, the S&P 500 rallied its way back, recovering nearly all the declines notched in the opening days of the month when President Trump's "Liberation Day" tariff plans tipped markets towards bear territory.
Reversals were not limited to the stock market. The VIX retreated as well, not quite to the placid levels we may have become used to of late, but not too far off. The particularly nerve-wracking Treasury sell-off that saw bonds fall concurrently with stocks also reversed. In the end, the 10-year Treasury yield ended April near where it started. Even the dollar has rebounded, though the U.S. Dollar Index (DXY) remains materially lower than it was at the beginning of April and the beginning of the year.
This recovery has been driven in part by a partial retreat from the tariffs announced on April 2. The administration's "90-day pause," numerous exemptions by country or industry, and legal challenges, may limit the ultimate tariff scope or prompt potential trade deals.
Part of the rally into May also seems driven by stock fundamentals. With over three-quarters of S&P 500 companies reporting, earnings are up over 12% year-over-year.[1] Many companies are also operating with less leverage than they have in the past. Net debt/EBITDA for the S&P 500 stands at 1.4x today, which is quite low historically.[2] Low leverage suggests lower stock market risk, but it may also uncover greater fundamental strength. Consider the following: At the end of 2007, just before the great financial crisis, the S&P 500’s return on equity was slightly lower than it is today, but net debt/EBITDA was 4.4x—about triple today’s level.[3] Much of that return on equity in 2007 was achieved with leverage. It may be more helpful to look at return on assets, a key measure of underlying profitability that strips away the impact of leverage, which tells a different story. The return on assets of the S&P 500 today is nearly double that at the end of 2007, perhaps a more reliable measure of actual corporate health.[4]
Chart of the Month
Know What You Own (Part 1): Don’t Be an “Accidental” Market Timer
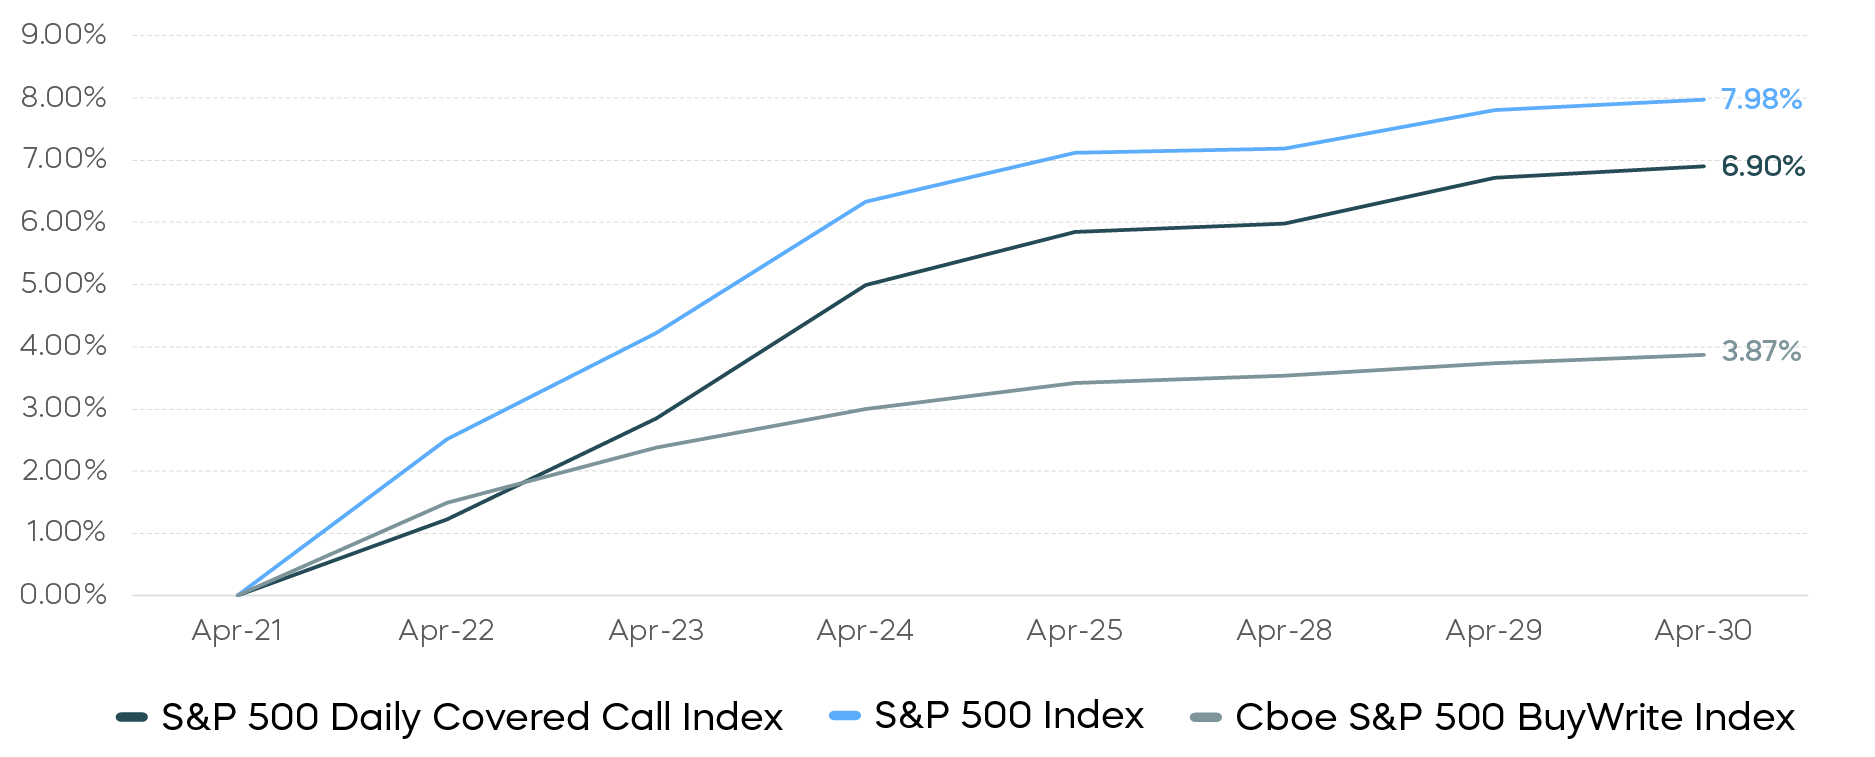
Source: Bloomberg. Data 4/21/25–4/30/25. Index returns are for illustrative purposes only and do not reflect any management fees, transaction costs or expenses. Indexes are unmanaged, and one cannot invest directly in an index. Past performance does not guarantee future results.
The equity market’s quick reversal should serve as a cautionary tale for those tempted to try and time markets. While many investors are well-trained to resist the urge to shift their portfolios dramatically from stocks to cash during periods of market stress, investors also need to be careful not to become “accidental” market timers when pursuing other strategies. What do we mean? Often, equity strategies that have defensive properties designed to protect in a downturn may not participate well in a market rebound.
Case in point: Traditional monthly covered call strategies, which collect premiums in exchange for limits on upside returns (and that are mistakenly touted as defensive investments), may sacrifice critical gains when markets rise. The Cboe S&P 500 BuyWrite Index—a monthly covered call index—has returned less than half of the S&P 500’s end-of-April rally. Meanwhile, the S&P 500 Daily Covered Call Index, which tracks the performance of a covered call strategy driven by daily options, has delivered double the return of the Cboe index in this rebound.[5] In short, it’s important to know what you own.
Performance Recap
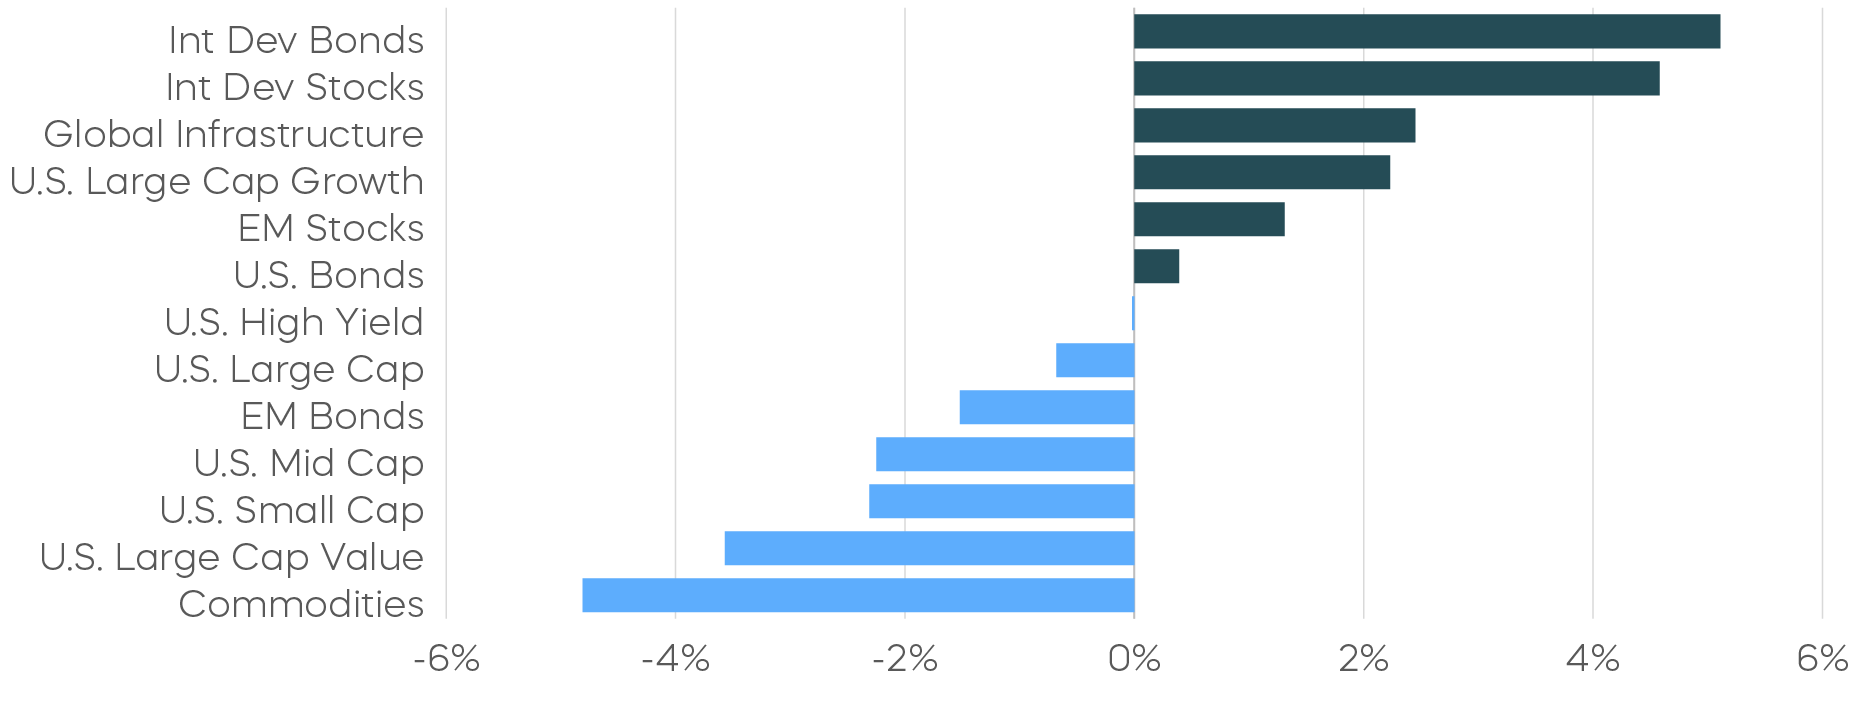
Despite the recent recovery, U.S. stocks continued to lag global equities in April, widening the performance gap observed in the first quarter. International developed market bonds also outperformed their U.S. counterparts. Large-cap U.S. equities outpaced mid-caps and small-caps. Commodities declined across the board amid growth concerns except for gold, which extended its ongoing safe-haven rally.
Asset Class Returns—April 2025
Asset Class Returns—Year to Date
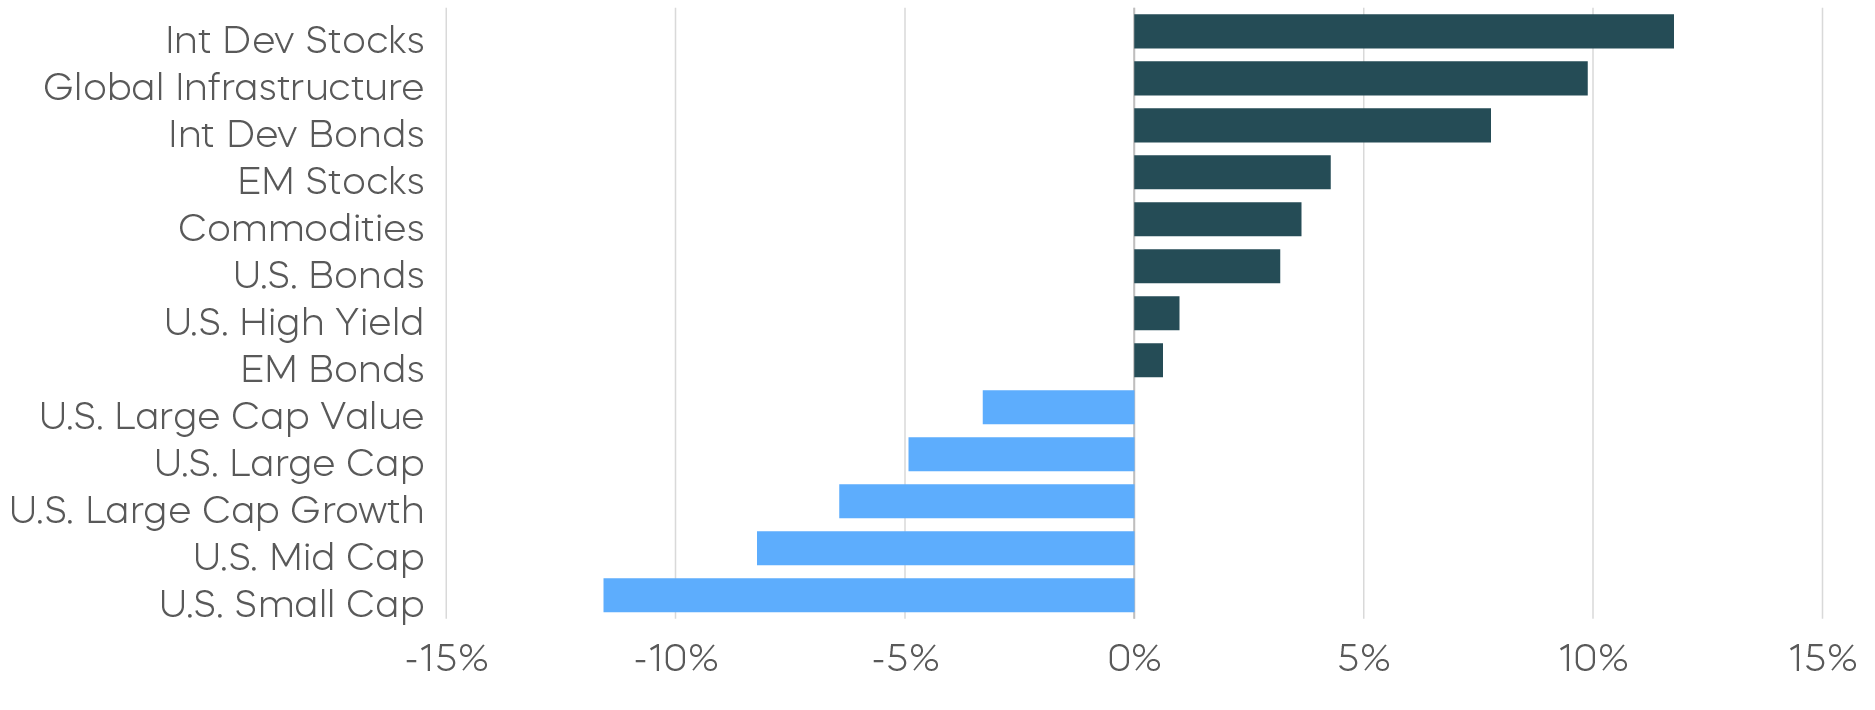
Source: Bloomberg. April returns 4/1/25–4/30/25; year-to-date returns 1/1/25‒4/30/25. Index returns are for illustrative purposes only and do not reflect any management fees, transaction costs or expenses. Indexes are unmanaged, and one cannot invest directly in an index. Past performance does not guarantee future results.
Economic Calendar
Here is a list of key and upcoming economic releases, which may serve as a guide to potential market indicators.
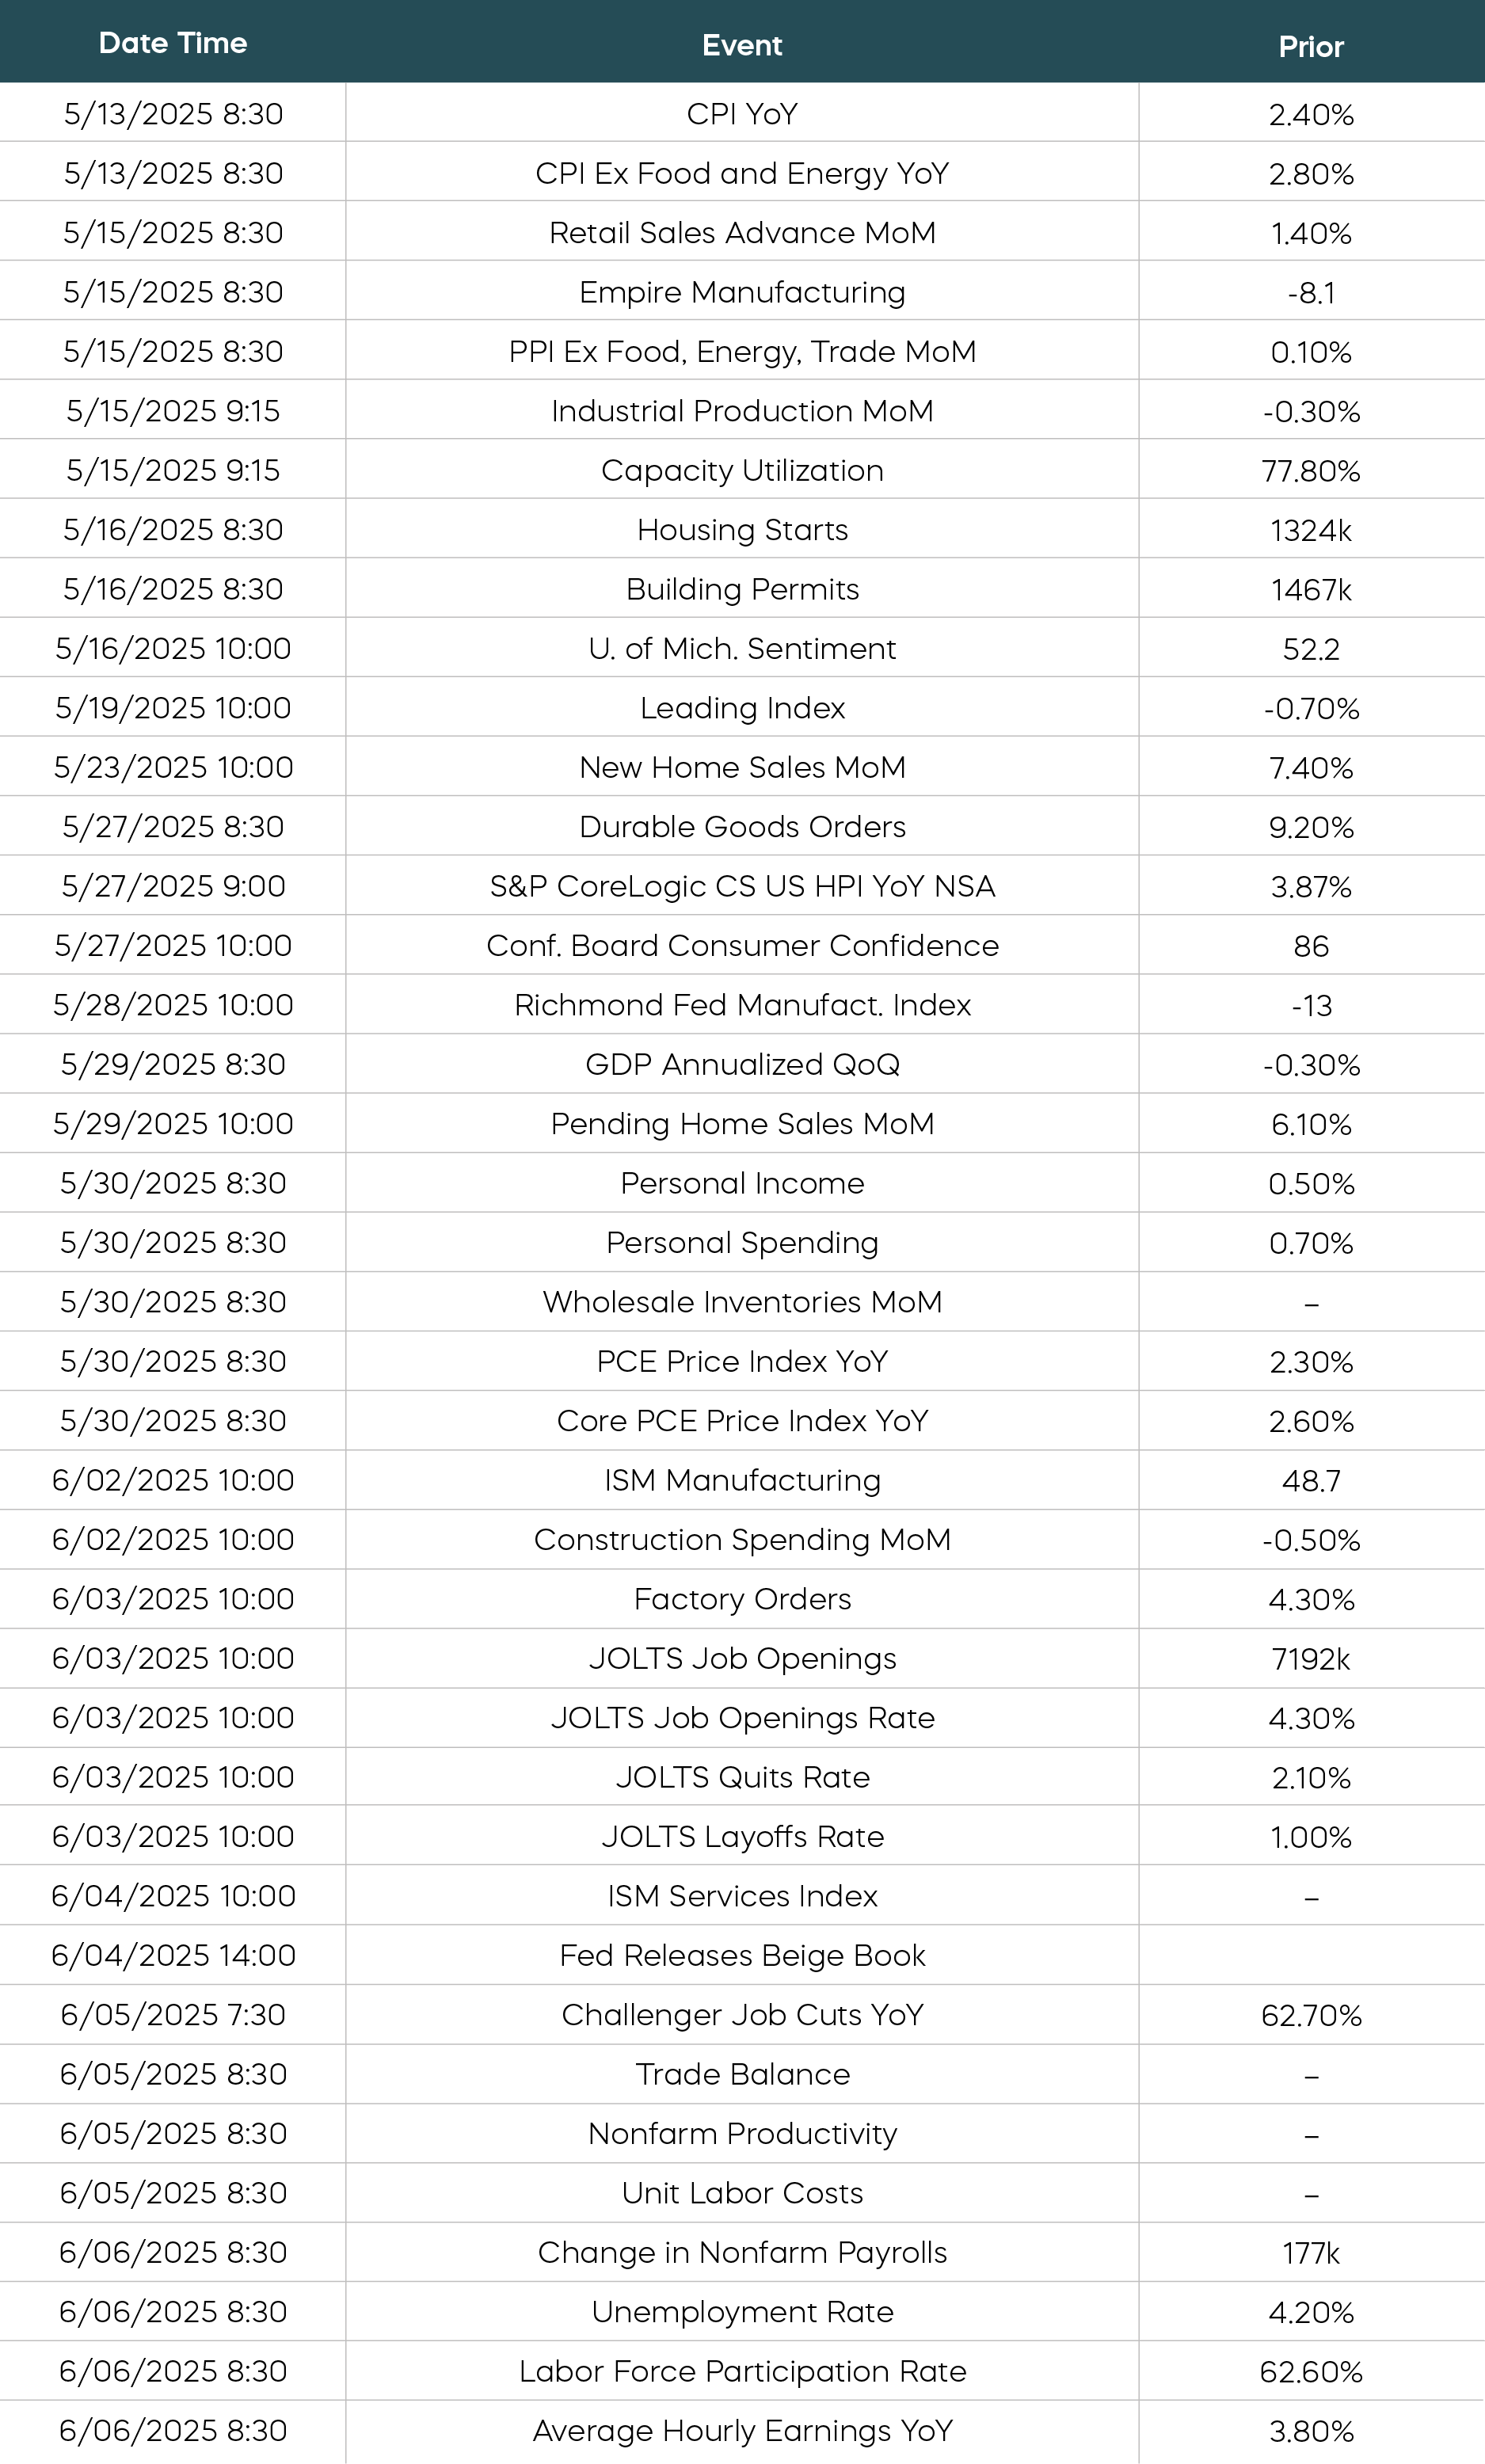
Source: Bloomberg. Data as of 5/5/25.
Equity Perspectives

What’s Working Now?
April was a rollercoaster ride for equity investors, as markets whip-sawed and volatility levels skyrocketed. Between the April 2 “Liberation Day” and April 8, the S&P 500 fell roughly 14%, but rallied sharply to close the month essentially flat. Realized volatility on the S&P 500 reached an annualized rate of 48%, the highest since March 2020.
Despite some softening on tariffs, investors are still dealing with significant uncertainty, and many strategists posit the recession odds as a coin-flip. Investor sentiment remains gloomy, as indicated by a record tenth consecutive week in which the AAII Bearish Sentiment was greater than 50%.[6]
Where can investors look for refuge? We see two particular opportunities: Strategies like the Dividend Aristocrats can deliver all-weather performance, and diversification can be your friend. On the second point, market segments like infrastructure can provide exposures not commonly found in many portfolios and offer a potential refuge in uncertain times.
Infrastructure: A Refuge in Uncertain Times
As a real asset, infrastructure has historically offered growth potential, steady income and resilience during market downturns. This can be attributed to a unique combination of investment characteristics, including predictable cash flows and limited sensitivity to economic cycles.
Even if we enter a recession, people will typically still pay to heat their homes, turn on lights, and use their cell phones. And when inflation spikes, owners and operators of related infrastructure assets can often raise revenues in a manner consistent with inflation. These qualities have enabled infrastructure companies to produce attractive risk-adjusted returns under a variety of market climates.
Know What You Own (Part 2): Pure-Play Infrastructure
Investors need to remember that not all infrastructure investments are created equal. Owners and operators of assets like pipelines, cell towers, airports, and water systems, known as pure-play infrastructure companies, embody more resilient business models. By contrast, infrastructure developers that focus more on building such assets often fare worse when economies turn sluggish.
The distinction between the two has stark implications for risk and returns. The pure-play approach has shined this year, as represented by the Dow Jones Brookfield Global Infrastructure Composite Index. Meanwhile, infrastructure developers, represented by the Indxx U.S. Infrastructure Development Index, have seen lackluster returns in line with the S&P 500.
Pure-Play Infrastructure Companies Have Outperformed in 2025
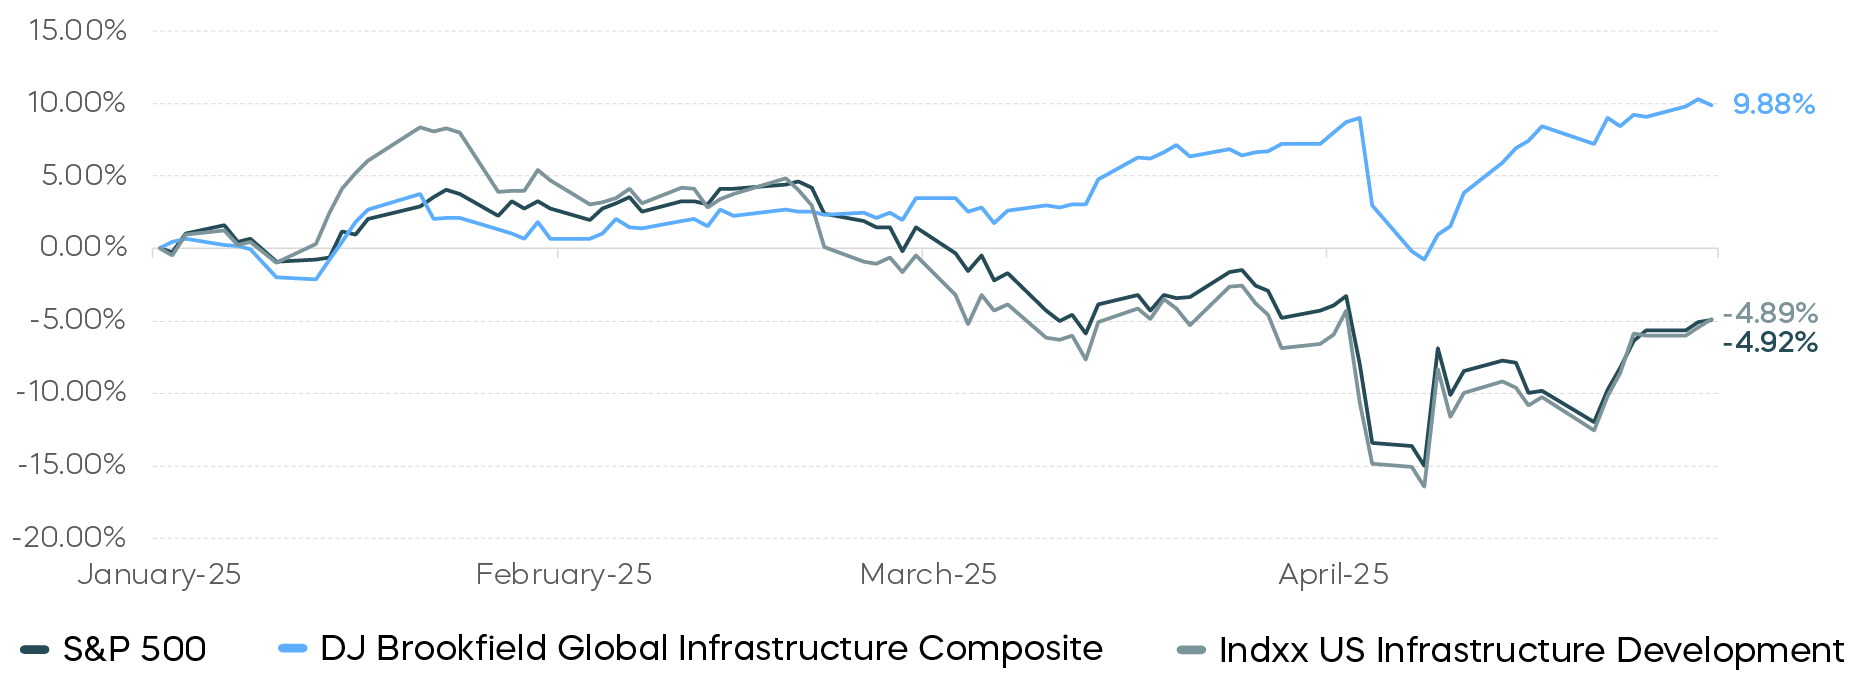
Source: Bloomberg. Data 12/31/24–4/30/25. Index returns are for illustrative purposes only and do not reflect any management fees, transaction costs or expenses. Indexes are unmanaged, and one cannot invest directly in an index. Past performance does not guarantee future results.
Fixed Income Perspectives

Global bonds, particularly developed-market sovereigns, outperformed U.S. bonds in April, including U.S. Treasuries. The 10-year Treasury yield swung sharply in response to tariff-related news, dropping to 3.86% on April 4 after the tariff announcement, then climbing 70 basis points to 4.56% by April 11.[7] Credit spreads widened overall and ended the month higher, despite partially retracing earlier moves.
Fixed Income Returns—April 2025
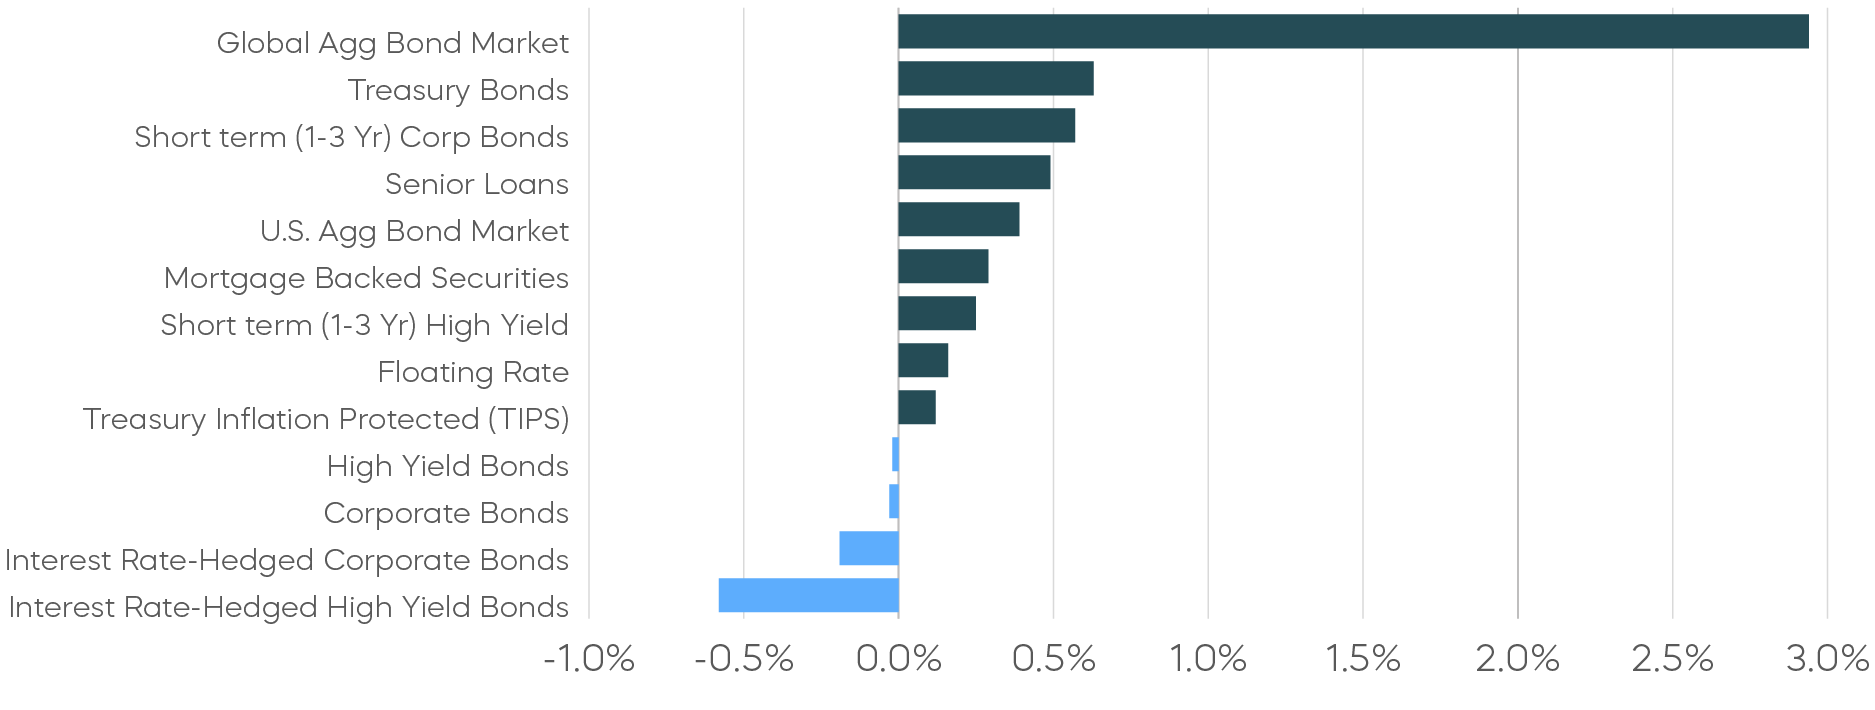
Source: Bloomberg. March returns 4/1/25–4/30/25. Index returns are for illustrative purposes only and do not reflect any management fees, transaction costs or expenses. Indexes are unmanaged, and one cannot invest directly in an index. Past performance does not guarantee future results.
Is It Time to Re-Evaluate U.S. Treasury Bonds?
At the start of the year, the backdrop of slowing growth and easing inflation generally favored nominal bonds. Tariffs, however, remain an unpredictable risk. Although market participants gradually shifted from complacency to caution ahead of expected trade restrictions, the scale of the tariffs announced on April 2 still came as a surprise.
In the days that followed, market signals seem to suggest a reassessment of the U.S. Treasury bond’s role as the global safe asset. Since then, U.S. equities have generally underperformed global peers, the dollar has weakened, and Treasury bonds have unusually sold off during a period of risk aversion. Gold, on the other hand, has rallied as a result of its alternative safe-haven status.
This shift is evident in relative "convenience yields,” which reflect the non-monetary benefits of holding a safe asset. For Treasuries, this can be approximated by the spread between Treasury and swap yields. For gold, convenience yield can be reflected by the spread between spot and future prices. Since the tariff announcement on April 2, gold’s convenience yield has risen while that of a Treasury bond has declined. This is an inverse pattern compared to March 2020, when both moved in tandem despite extreme two-way volatility.
Gold’s “Convenience Yield” Has Risen and Treasury’s Declined
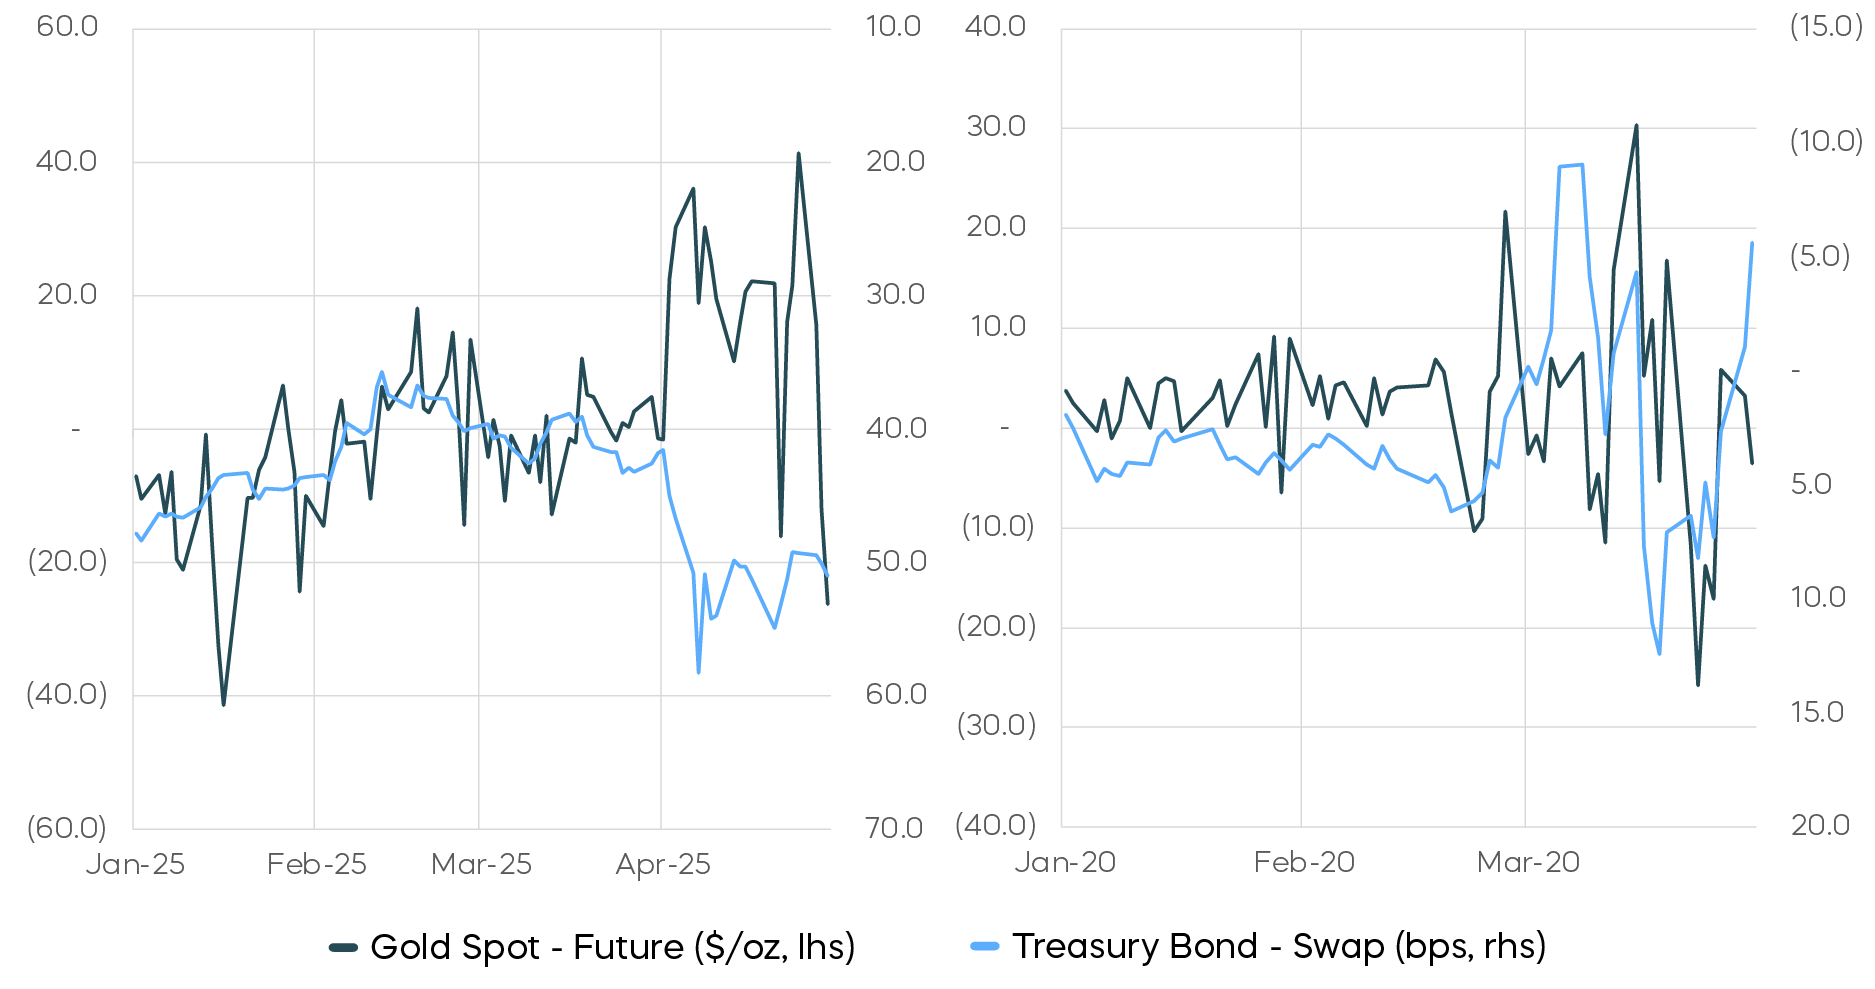
Source: Bloomberg. Data as of 4/30/25. Past performance does not guarantee future results.
If the U.S. Treasury bond’s role as the global safe asset is under review, identifying the marginal buyer becomes crucial. Since the surge in Treasury bond issuance following the COVID-19 pandemic, U.S. households and private institutions have absorbed much of the new supply. In contrast, foreign central banks have kept their holdings relatively flat over the past decade, resulting in a declining share of foreign ownership. The remaining foreign demand has come primarily from foreign private institutions, such as Japanese life insurers, whose decisions could be based more on relative value rather than reserve policy.
Long-Term Treasury Bond Ownership Trends
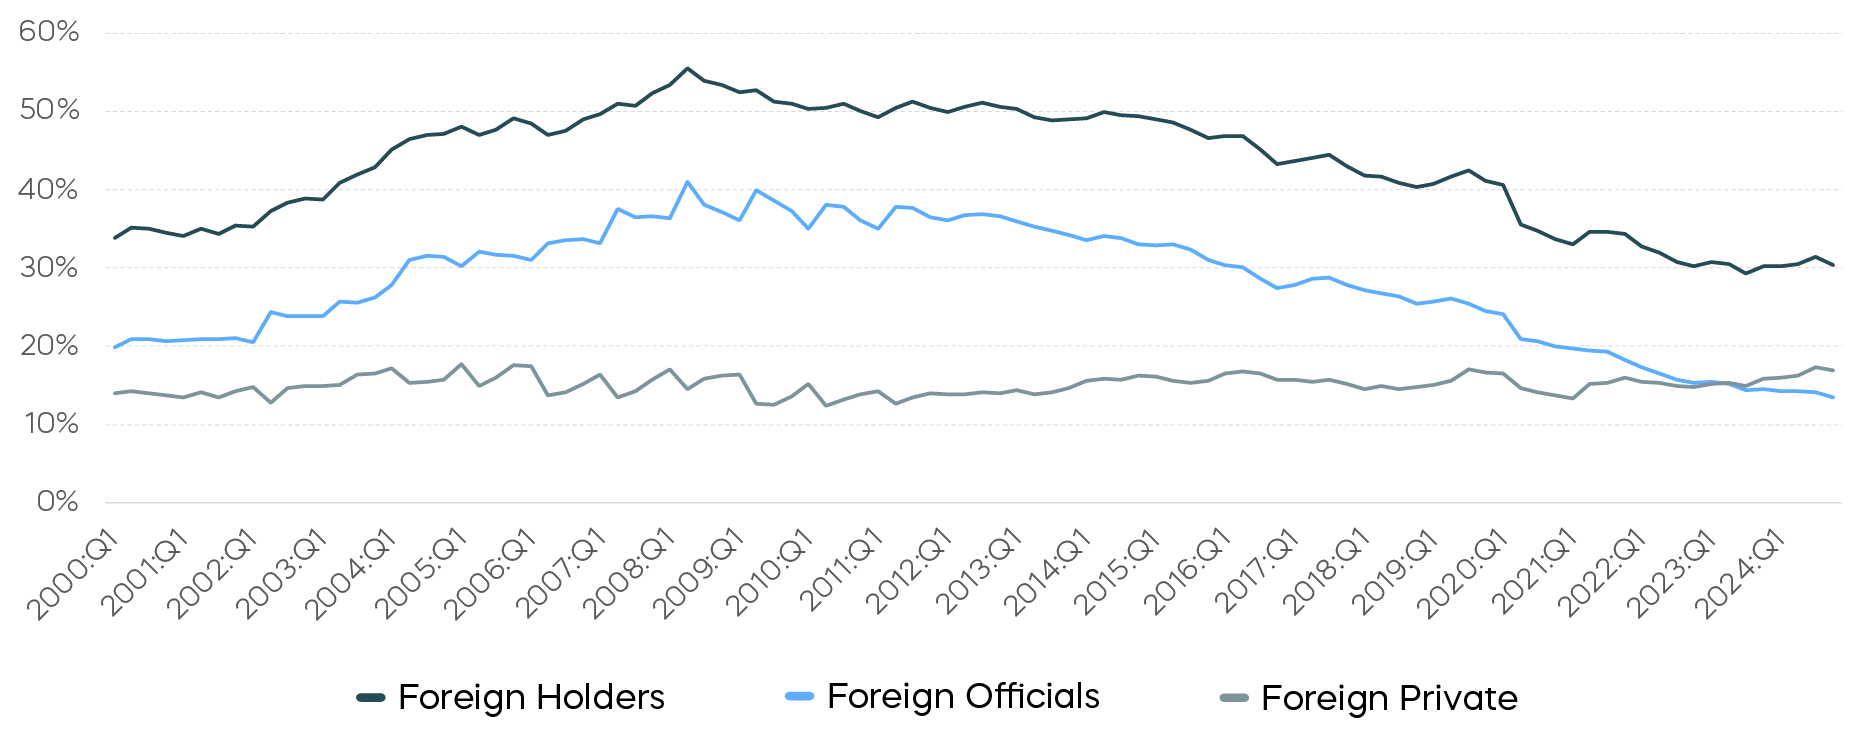
Source: The Federal Reserve, Financial Accounts of the United States, Q4 2024. U.S. Department of the Treasury, Treasury International Capital System, Q4 2024. Past performance does not guarantee future results.
With potential depreciations in the U.S. dollar, foreign buyers of Treasury bonds will need to consider the currency’s impact on their returns. A common way for foreign private investors to own U.S. Treasury bonds while limiting exchange rate risk is to hedge with short-term FX forwards. Since the start of the year, a 10-year Treasury bond hedged with one-year FX forwards has seen its yield drop below those of other major sovereign bonds like the Bund, Gilt and JGB. Despite the recent sell-off in Treasuries, hedged yields remain unattractive. This is due in part to elevated hedging costs driven by the Fed’s reluctance to cut short-term rates preemptively amid tariff-induced inflation uncertainty. The yield spread indicates that a further rise in term premium may be needed to restore foreign demand.
Comparative Yield Spreads of a 10-Year Treasury Hedged with One-Year FX Forwards
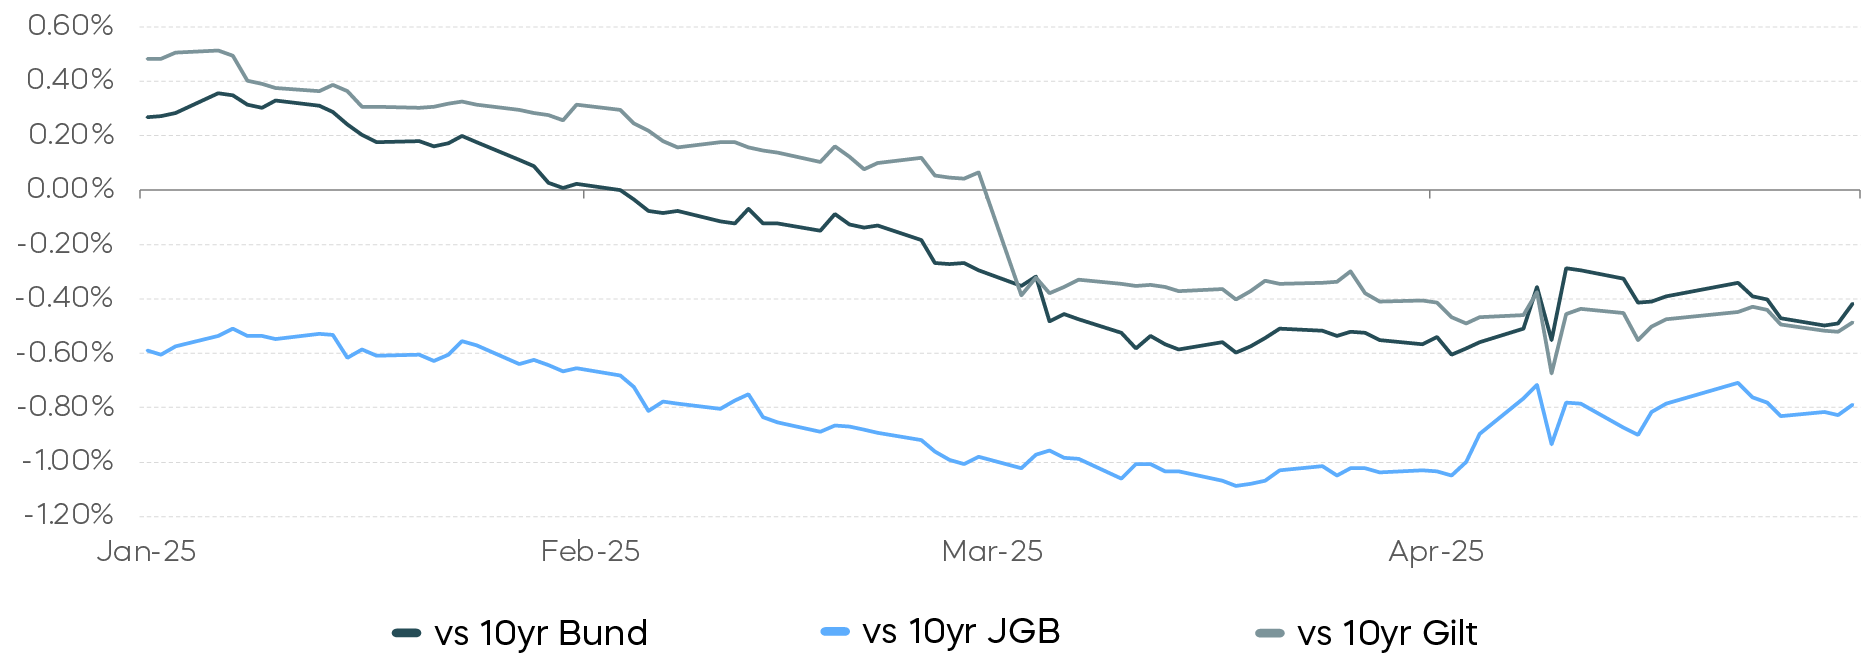
Source: Bloomberg. Data 1/1/25–4/30/25. Past performance does not guarantee future results.
Ultimately, near-term Treasury yields may depend more on the outcome of ongoing tariff negotiations. If trade tensions escalate to the point of triggering a recession, domestic demand for Treasuries could rise as investors retreat from risk assets. Weaker aggregate demand would likely weigh on inflation, giving the Federal Reserve room to ease, further supporting bonds. However, if tariffs continue to be the primary driver of market volatility, the role of Treasury bonds in global portfolios will remain a key consideration.
[1] Source: Bloomberg. Data as of 5/7/25.
[2] Source: Bloomberg. Data as of 4/30/25.
[3] Source: Bloomberg. Data as of 12/31/07.
[4] Source: Bloomberg. Data as of 4/30/25.
[5] Source: Bloomberg. Data 4/21/25–4/30/25.
[6] Source: American Association of Individual Investors. Data as of 5/1/25.
[7] Source: Bloomberg. Data 4/4/25–4/11/25.
Sources for data and statistics: Bloomberg, FactSet, Morningstar, and ProShares.
The different market segments represented in the performance recap charts use the following indexes: U.S. Large Cap: S&P 500 TR; U.S. Large Cap Growth: S&P 500 Growth TR; U.S. Large Cap Value: S&P 500 Value TR; U.S. Mid Cap: S&P Mid Cap TR; U.S. Small Cap: Russell 2000 TR; International Developed Stocks: MSCI Daily TR NET EAFE; Emerging Markets Stocks: MSCI Daily TR Net Emerging Markets; Global Infrastructure: Dow Jones Brookfield Global Infrastructure Composite; Commodities: Bloomberg Commodity TR; U.S. Bonds: Bloomberg U.S. Aggregate; U.S. High Yield: Bloomberg Corporate High Yield; International Developed Bonds: Bloomberg Global Agg ex-USD; Emerging Market Bonds: DBIQ Emerging Markets USD Liquid Balanced.
The different market segments represented in the fixed income returns charts use the following indexes: Global Agg Bond Market: Bloomberg Global-Aggregate Total Return Index Value Unhedged USD; Mortgage Backed Securities: Bloomberg U.S. MBS Index Total Return Value Unhedged USD; Treasury Bonds: Bloomberg U.S. Treasury Total Return Unhedged USD; U.S. Agg Bond Market: Bloomberg U.S. Agg Total Return Value Unhedged USD; Corporate Bonds: Bloomberg US Corporate Total Return Value Unhedged USD; High Yield Bonds: Bloomberg U.S. Corporate High Yield Total Return Index Value Unhedged USD; Interest Rate-Hedged High Yield Bonds: FTSE High Yield (Treasury Rate-Hedged) Index; Treasury Inflation Protected (TIPS): Bloomberg U.S. Treasury Inflation Notes TR Index Value Unhedged USD; Short term (1-3 Yr) High Yield: Bloomberg U.S. Corporate 0-3 Year Total Return Index Value Unhedged USD; Senior Loans: Morningstar LSTA U.S. Leveraged Loan 100 Index; Short term (1-3 Yr) Corp Bonds: Bloomberg U.S. Corporate 1-3 Yr Total Return Index Value Unhedged USD; Floating Rate: Bloomberg U.S. FRN < 5 yrs Total Return Index Value Unhedged USD; Interest Rate-Hedged Corporate Bonds: FTSE Corporate Investment Grade (Treasury Rate-Hedged) Index.
The S&P 500 is a benchmark index published by Standard & Poor's (S&P) representing 500 companies with large-cap market capitalizations. The S&P 500 Dividend Aristocrats Index targets companies that are currently members of the S&P 500 that have increased dividend payments each year for at least 25 years. The S&P 500 Daily Covered Call Index seeks to measure the performance of a long position in the S&P 500 TR and a short position in a standard S&P 500 daily call option, aiming to reflect higher income generation and lower timing risk by using daily options versus monthly options. The CBOE S&P 500 BuyWrite Index is a benchmark designed to show the hypothetical performance of a portfolio that engages in a buy-write strategy using S&P 500 call options. The Dow Jones Brookfield Global Infrastructure Composite Index measures the performance of companies in developed markets that are owners and operators of pure-play infrastructure assets. The Indxx U.S. Infrastructure Development Index is designed to measure the performance of companies that provide exposure to infrastructure development in the United States. THESE ENTITIES AND THEIR AFFILIATES MAKE NO WARRANTIES AND BEAR NO LIABILITY WITH RESPECT TO PROSHARES.
This is not intended to be investment advice. Indexes are unmanaged, and one cannot invest directly in an index. Past performance does not guarantee future results.
Any forward-looking statements herein are based on expectations of ProShare Advisors LLC at this time. Whether or not actual results and developments will conform to ProShare Advisors LLC’s expectations and predictions, however, is subject to a number of risks and uncertainties, including general economic, market and business conditions; changes in laws or regulations or other actions made by governmental authorities or regulatory bodies; and other world economic and political developments. ProShare Advisors LLC undertakes no duty to update or revise any forward-looking statements, whether as a result of new information, future events or otherwise.
Investing involves risk, including the possible loss of principal. This information is not meant to be investment advice.
The “S&P 500®,” “S&P 500 Daily Covered Call Index” and “Dow Jones Brookfield Global Infrastructure Composite Index” are products of S&P Dow Jones Indices LLC and its affiliates. "S&P®" is a registered trademark of Standard & Poor’s Financial Services LLC (“S&P”), and “Dow Jones®" is a registered trademark of Dow Jones Trademark Holdings LLC (“Dow Jones”) and they have been licensed for use by S&P Dow Jones Indices LLC and its affiliates. All have been licensed for use by ProShare Advisors LLC. ProShares ETFs based on these indexes are not sponsored, endorsed, sold or promoted by these entities or their affiliates, and they make no representation regarding the advisability of investing in ProShares ETFs. THESE ENTITIES AND THEIR AFFILIATES MAKE NO WARRANTIES AND BEAR NO LIABILITY WITH RESPECT TO PROSHARES.