Where Dividends Stand in June
The United States and countries around the world are in various stages of reopening, but financial markets are still wary and dividend cuts in the U.S. equity market have continued. We have also seen a continued pattern of significant dividend resilience based on quality.
Dividend Scorecard:
Dividend Cutters versus Dividend Raisers, by Market Cap
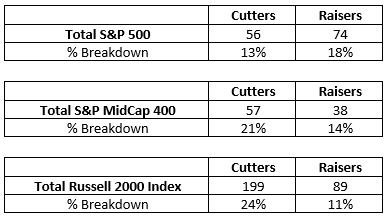
Source: Bloomberg, ProShares. Based on DPS announcements from 1/1/20–6/22/20 broken down as a percentage of dividend payers in each index. Past performance is no guarantee of future results. Chart is provided for illustrative purposes.
What Makes the Dividend Aristocrats Resilient? Quality.
There is an elite group of companies that has been less susceptible to dividend cuts this year. So far, just one company among the S&P 500® Dividend Aristocrats® Index has cut its dividend. To become a Dividend Aristocrat, an S&P 500 company has to increase its dividends for a minimum of 25 consecutive years. Many of the Dividend Aristocrats have actually raised their dividends continuously for 40 years, 50 years or more. This is relevant for today’s investors because that 25-year minimum requirement means the Dividend Aristocrats have increased their dividends even through the Great Recession, the bursting of the Dot-com bubble, and many more market disruptions.
What is the likely source of their resiliency, both current and historical? Quality. In our previous Dividend Viewpoint article, The Quality-Based Differences Developing in Dividends, we showed how both current dividend cuts, and cuts during the Great Recession, came disproportionately from lower credit rated, lower quality companies. The chart below shows where the Dividend Aristocrats fall within the quintiles of the S&P 500 based on credit rating.
S&P 500 Dividend Aristocrats Index Quintile Representation
Dividend Aristocrats Have Higher Credit Ratings
(within the S&P 500, by quintile)
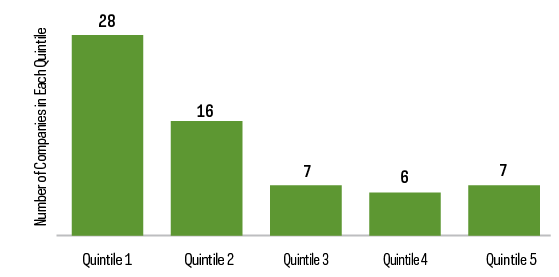
Source: Bloomberg, ProShares. Dividend Aristocrats holdings as of 3/31/20; credit ratings as of 12/31/19.
As you can see, the S&P 500 Dividend Aristocrats Index has a high distribution of companies among the top two quintiles by credit rating. This attribute of overall higher credit quality has been closely associated with dividend resiliency during previous market disruptions. And as 2020 results indicate so far, it may support similar resiliency in today’s pandemic-driven market. Note, however, that the S&P 500 Dividend Aristocrats Index does not specifically screen for credit ratings or quality. It screens exclusively for companies that have continuously increased dividends, and the resulting quality of the companies in the index is an elegant by-product of the high minimum requirement for dividend growth.
Dividend Growth, High Dividend Yield and Dividend Risk
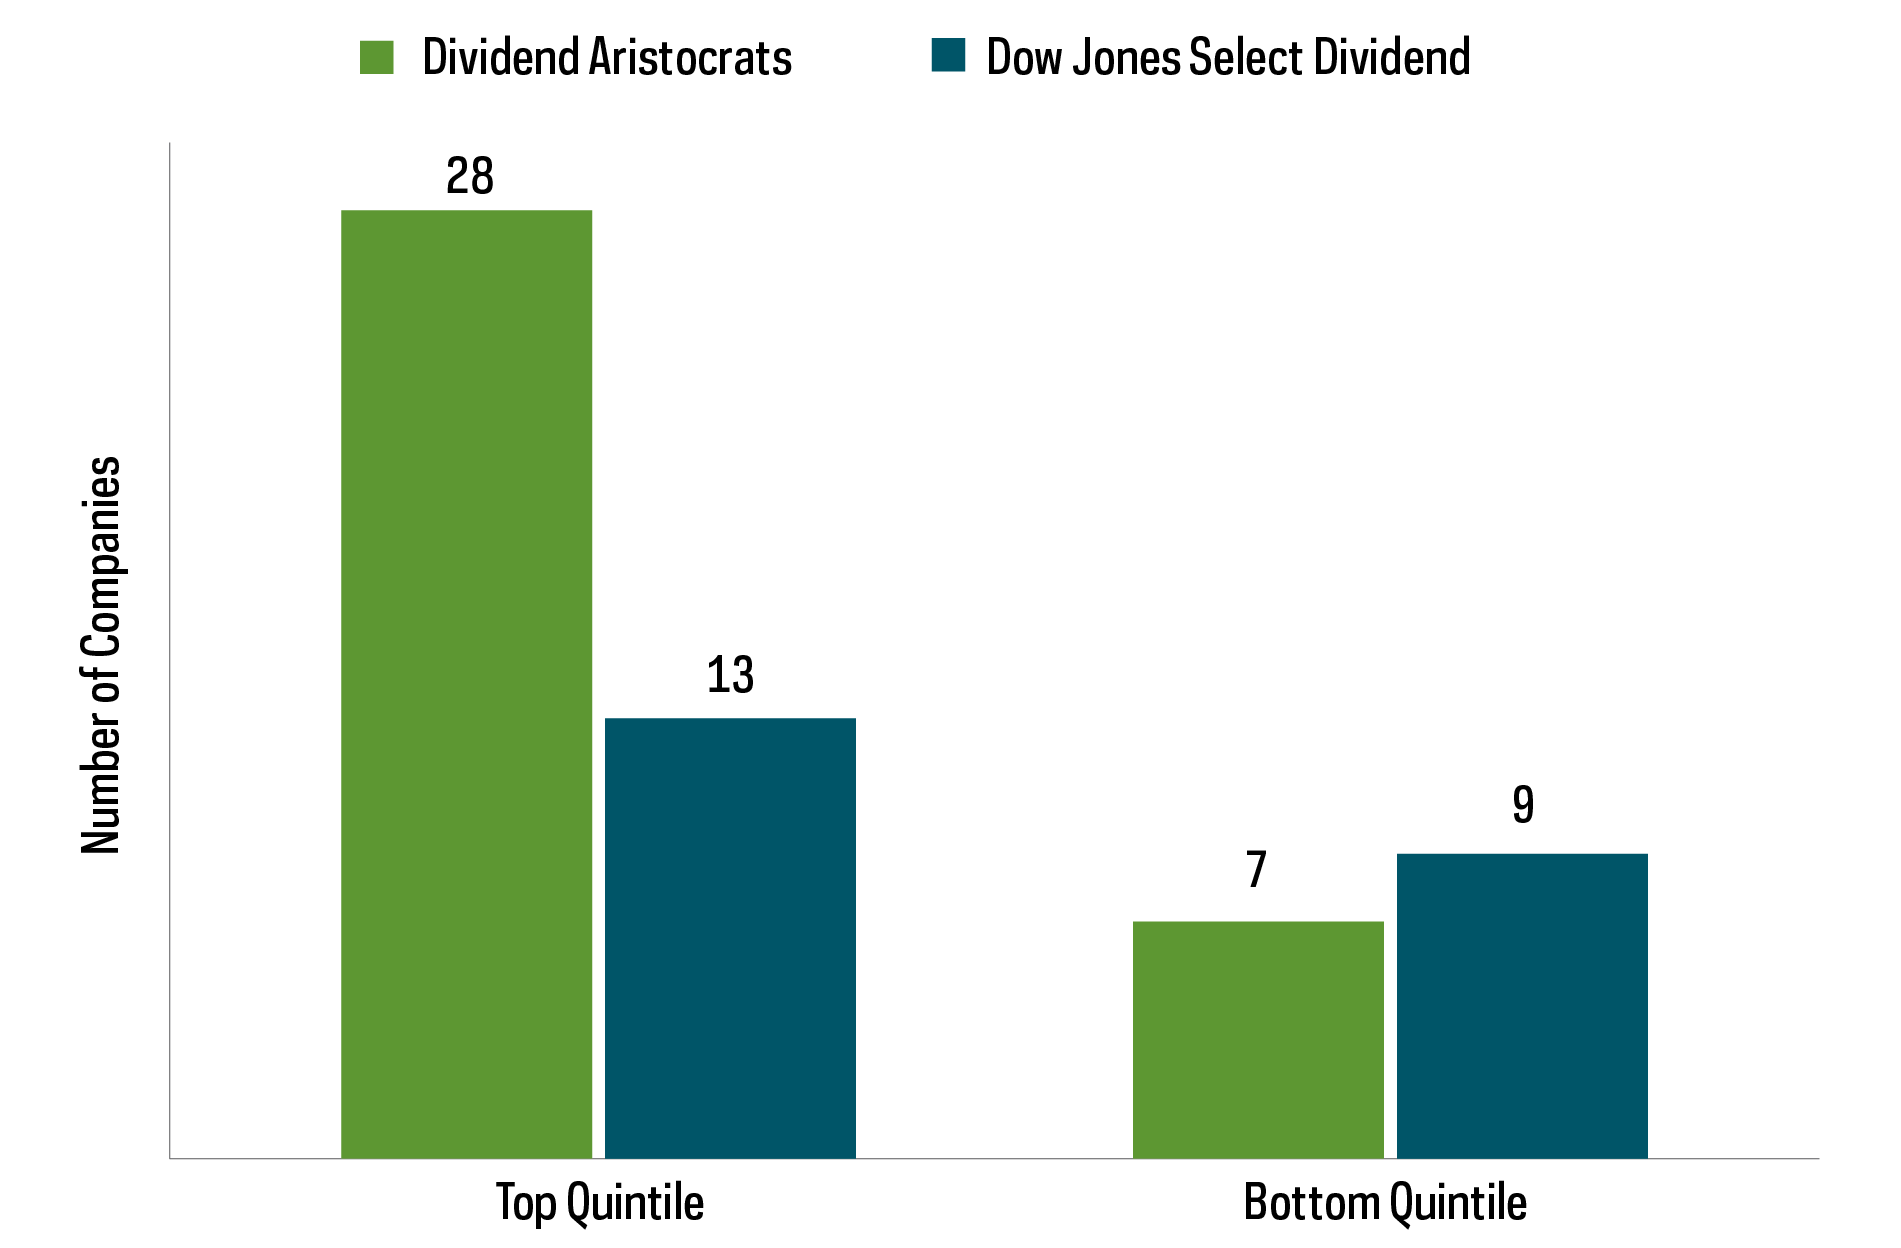
With bond yields near all-time lows, it is likely that many yield-seeking investors will be tempted to consider equities that pay high dividend yields as a source of income. Those high dividend yields, however, often come with higher dividend risk. Let’s look at the Dow Jones U.S. Select Dividend Index, which is composed of 100 high-yielding equities. Nearly 20% of its companies have cut dividends this year (as of 6/22/20). The following charts compare the relative quality of the companies in the S&P 500 Dividend Aristocrats and the Select Dividend Index.
S&P 500 Dividend Aristocrats versus Dow Jones U.S. Select Dividend Index
Dividend Growers and High Yielders, by Quality
(highest versus lowest credit quality)
Dividend Growers and High Yielders, by % Yield
(highest versus lowest yield)
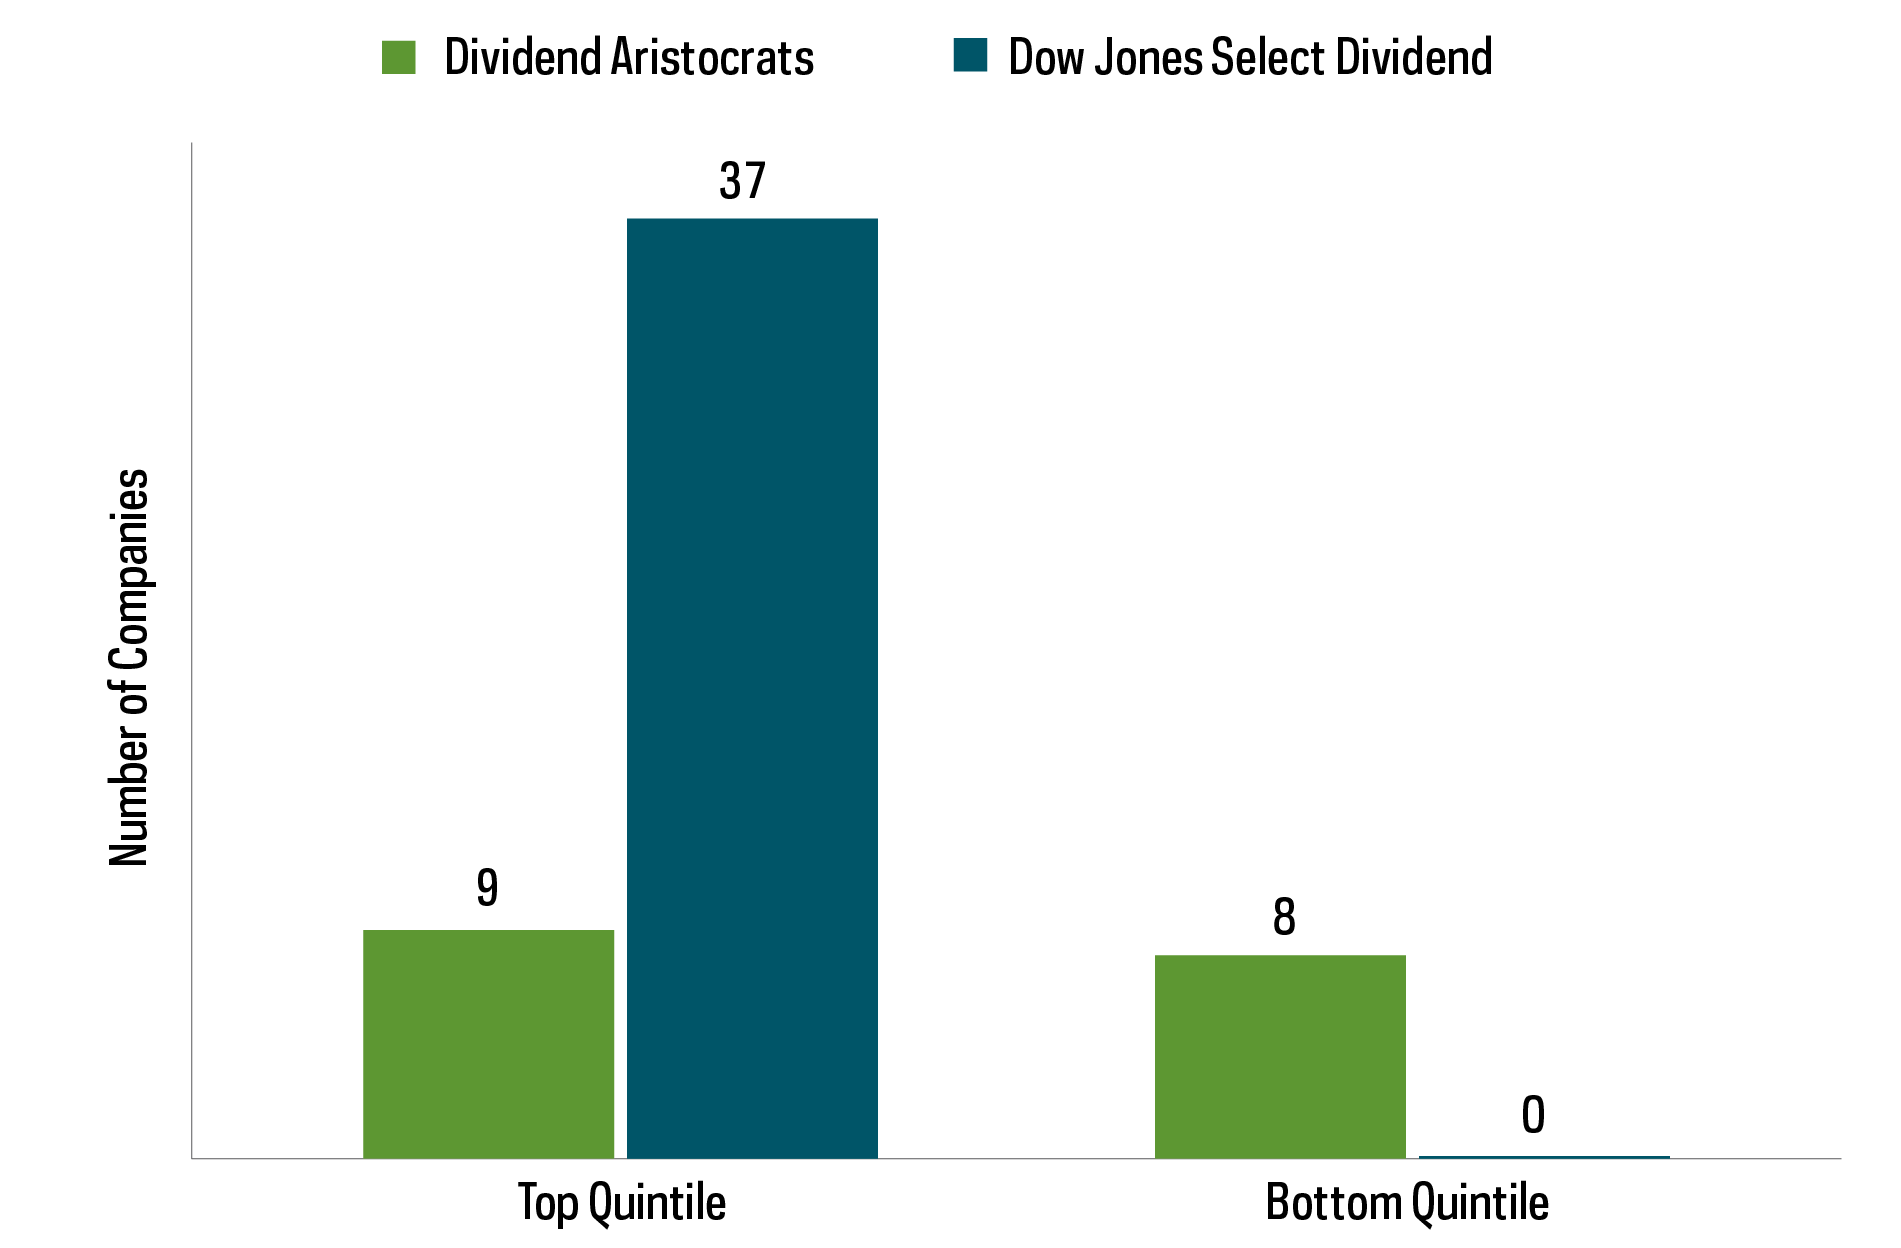
Source: Bloomberg, ProShares. Index holdings as of 3/31/20; credit ratings and yields as of 12/31/19.
Once again, the quality of the companies appears central to the story. The charts above clearly demonstrate that a higher proportion of the Dow Jones U.S. Select Dividend Index’s constituents are in the bottom fifth of companies by credit quality, while among the highest 20% for dividend yield. Their low quality and high yields are indicative of notable dividend risk. If there is a muted pandemic recovery, we believe it is much more likely to cause a disruption in their cash flow and ability to continue paying high dividends. Moreover, a longer-term look at dividend growers versus high yielders highlights that the benefits of higher yield have tended to dissipate over time.
Dividend Growth Has Delivered Greater Long-Term Growth
Yield-on-Cost Comparison
Higher Yield Benefits Versus Dividend Growth Dissipated Over Time
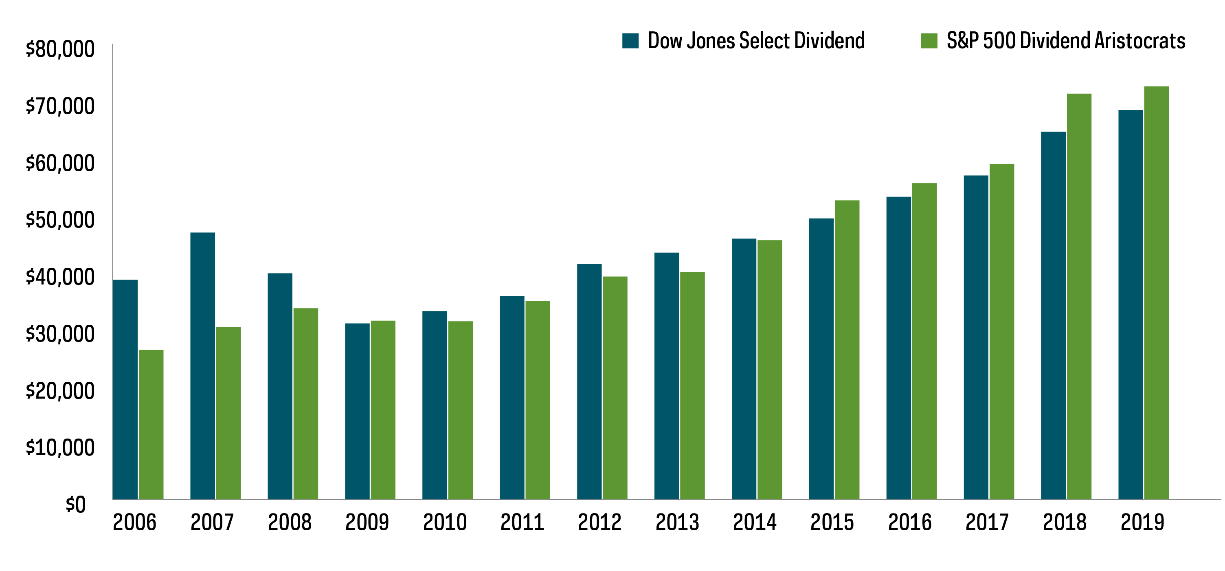

Source: Bloomberg, ProShares. S&P 500 Dividend Aristocrats ETF (NOBL) standardized performance, as of 3/31/20: one-year -13.00% (NAV)/-12.96% (Market Price); three-year 3.03% (NAV)/3.04% (Market Price); five-year 5.00% (NAV)/4.99% (Market Price); since inception (10/9/13) 7.94% (NAV)/7.95% (Market Price). Past performance does not guarantee future results.
While the Dow Jones U.S. Select Dividend Index typically begins with a higher dividend yield than the S&P 500 Dividend Aristocrats index, the dividends paid by the Dividend Aristocrats have grown nearly twice as fast. Investors choosing the higher credit quality approach seen among the S&P 500 Dividend Aristocrats have witnessed their dividend yield catch up in just four years. And over the longer term, it has edged even higher. Some might call that a bit like having your cake and eating it too.
What's Next in this Series?
In our next Dividend Viewpoint article, we intend to look at how dividends have been holding up among mid-cap and small-cap stocks. We will also explore how a dividend growth strategy can be effective in those equity segments.
This is not intended to be investment advice. Any forward-looking statements herein are based on expectations of ProShare Advisors LLC at this time. ProShare Advisors LLC undertakes no duty to update or revise any forward-looking statements, whether as a result of new information, future events or otherwise.
Investing is currently subject to additional risks and uncertainties related to COVID-19, including general economic, market and business conditions; changes in laws or regulations or other actions made by governmental authorities or regulatory bodies; and world economic and political developments.
Investing involves risk, including the possible loss of principal. There is no guarantee any ProShares ETF will achieve its investment objective.
Carefully consider the investment objectives, risks, charges and expenses of ProShares before investing. This and other information can be found in their summary and full prospectuses. Read them carefully before investing.
The "S&P 500® Dividend Aristocrats® Index," "S&P MidCap 400®" and “Dow Jones U.S. Select Dividend Index” are products of S&P Dow Jones Indices LLC and its affiliates. The "Russell 2000® Index" and "Russell®" are trademarks of Russell Investment Group. All have been licensed for use by ProShares. "S&P®" is a registered trademark of Standard & Poor's Financial Services LLC ("S&P") and "Dow Jones®" is a registered trademark of Dow Jones Trademark Holdings LLC ("Dow Jones") and have been licensed for use by S&P Dow Jones Indices LLC and its affiliates. ProShares have not been passed on by these entities and their affiliates as to their legality or suitability. ProShares based on these indexes are not sponsored, endorsed, sold or promoted by these entities and their affiliates, and they make no representation regarding the advisability of investing in ProShares.
THESE ENTITIES AND THEIR AFFILIATES MAKE NO WARRANTIES AND BEAR NO LIABILITY WITH RESPECT TO PROSHARES.
Learn More
NOBL
S&P 500 Dividend Aristocrats ETF
Seeks investment results, before fees and expenses, that track the performance of the S&P 500® Dividend Aristocrats® Index.
REGL
S&P MidCap 400 Dividend Aristocrats ETF
Seeks investment results, before fees and expenses, that track the performance of the S&P MidCap 400® Dividend Aristocrats® Index.
SMDV
Russell 2000 Dividend Growers ETF
Seeks investment results, before fees and expenses, that track the performance of the Russell 2000® Dividend Growth Index.