 Dividend Growers
Dividend Growers
Dividend Growers
A Critical Distinction To Be Made
The threat to dividend sustainability during 2020 appears to have abated, at least for now. When the pandemic began, investors feared cuts en masse to dividends because of the many businesses forced to close or drastically alter operations. Thankfully, that worst-case scenario didn’t materialize for dividend-focused investors.
While there were many companies that cut or suspended their dividends, the damage was largely confined to the early stages of the pandemic. Once the economy began to stabilize, so seemingly did dividends. By the end of 2020, approximately three times as many companies in the S&P 500 raised their dividends as cut them.
2020 Full Year Dividend Scorecard
In the previous installment of Dividend Viewpoint, we noted that dividends stabilized entering 2021 and expectations had shifted toward a belief that companies would reinstate dividends and buybacks. The new year has indeed brought far more dividend raises than cuts through late March 2021. The performance differential between growers and cutters has also remained wide.
| Cutters | Raisers | |
| Total S&P 500 | 60 | 188 |
| % Breakdown | 14% | 45% |
| Cutters | Raisers | |
| Total S&P MidCap 400 | 60 | 95 |
| % Breakdown | 22% | 35% |
| Cutters | Raisers | |
| Total S&P Russell 2000 | 211 | 209 |
| % Breakdown | 25% | 25% |
Source: Bloomberg, ProShares. Based on dividend per share announcements from 1/1/20—12/31/20 broken down as a percentage of dividend payers in each index. Past performance is no guarantee of future results.
This distinction in dividend policy had a significant impact on performance. Across the market-cap spectrum, there was a performance spread of approximately 20% between dividend growers and dividend cutters. This dynamic also had important performance impacts on dividend investing strategies. Dividend strategies focused on high yield (represented by the Dow Jones U.S. Select Dividend Index) held proportionately more dividend cutters. They also saw their performance struggle. Dividend growth strategies (represented by the S&P 500 Dividend Aristocrats Index), on the other hand, fared much better during an otherwise challenging year for dividends.
What you should take away from this is to “know what you own” in terms of your dividend strategy. It is worth making the distinction between strategies focused on high dividend yield and those focused on dividend growth.
2020 Performance by Dividend Policy
Raisers vs Cutters
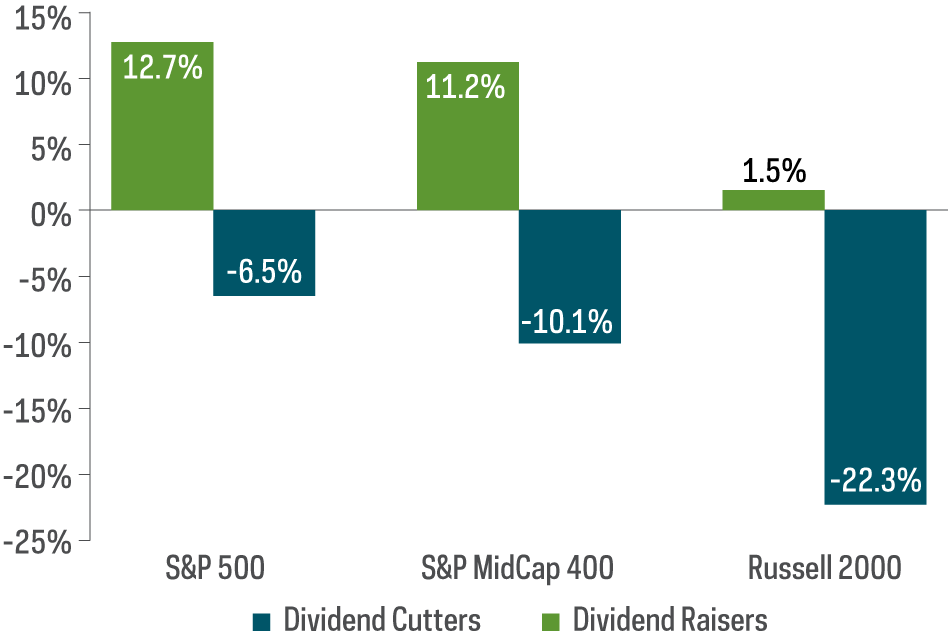
Source: Bloomberg, ProShares. Based on dividend per share announcements from 1/1/20—12/31/20. Past performance is no guarantee of future results.
Not All Dividend Strategies Are Created Equal
2020 Returns of Dividend Growers versus High Yielders
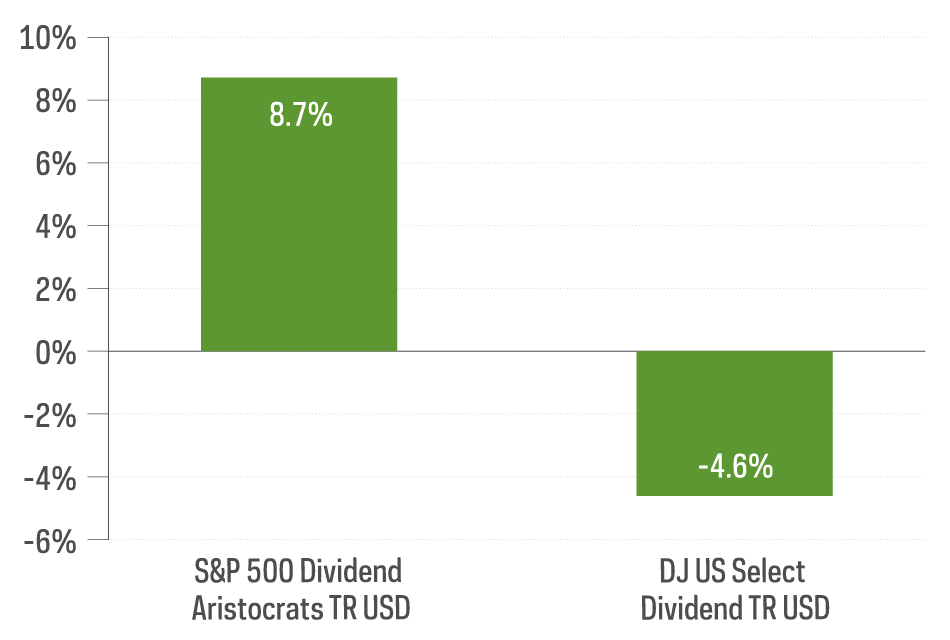
Source: Morningstar, data from 1/1/20—12/31/20. Past performance is no guarantee of future results.
Where Is the Dividend Growth?
Despite the market avoiding a worst-case scenario of widespread dividend cuts in 2020, dividend growth has been hard to come by of late. While we noted there were more companies that grew their dividends than cut them in 2020, the S&P 500’s aggregate rate of dividend growth was flat. The rate of dividend growth among large-cap stocks has actually been trending lower for the last several years. And mid-cap stocks fared even worse, posting a dividend decline of roughly 8% for 2020.
S&P 500 Historical Dividend Growth Rate
2008 through 2020
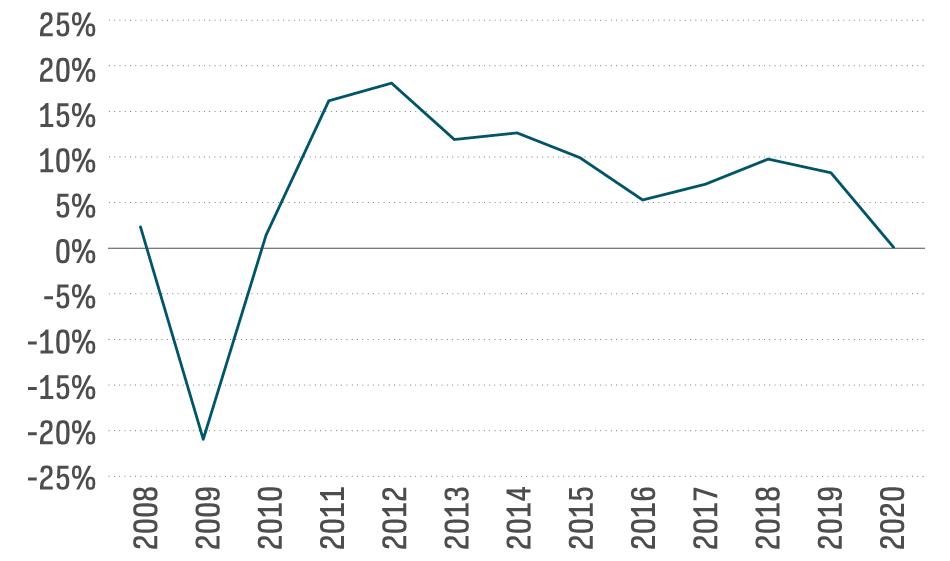
Source: S&P Dow Jones Indices, dividend growth rate from 1/1/08—12/31/20.
This issue takes on perhaps greater significance given the low yield environment in which we find ourselves. Many income investors have been forced to assume greater risk over the years to earn adequate levels of yield. If that yield cannot grow above the rate of inflation (at a minimum), the challenges become even greater—and yield traps abound. As tempting as it may be to turn to higher-yielding strategies, dividend sustainability in today’s economically challenging times remains an open question.
A rather obvious place to look for sustainable and increasing income is dividend growth strategies. While dividends for the broad-market indexes were flat or down, S&P Dividend Aristocrat strategies delivered robust rates of dividend growth.
2020 S&P Rates of Dividend Growth
S&P Dividend Aristocrats Indexes versus S&P 500
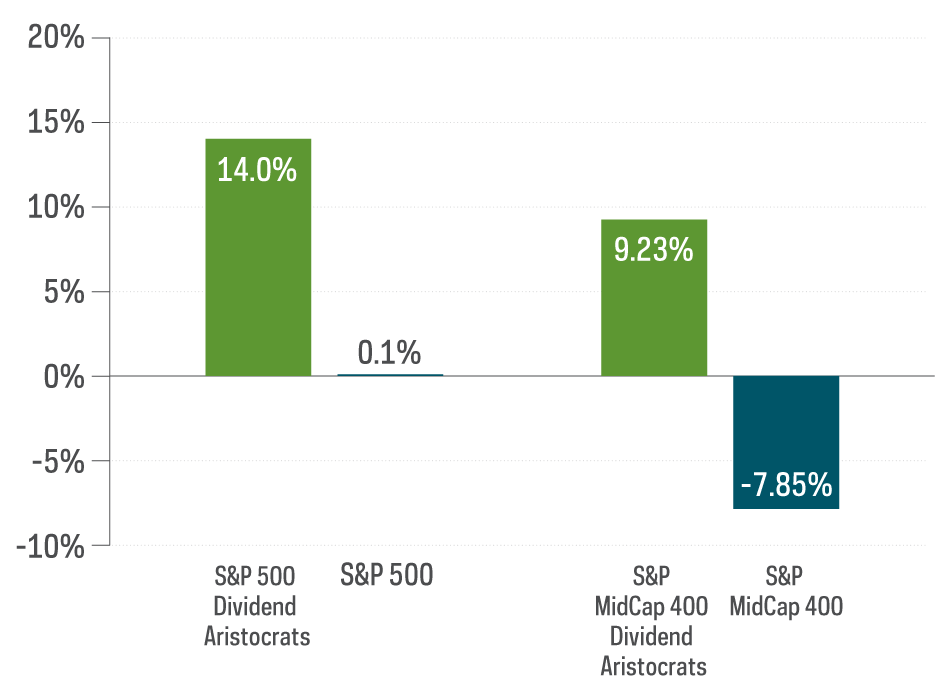
Source: S&P Dow Jones Indices, dividend growth rates from 1/1/08—12/31/20.
Finding Durable Dividends in 2021
As we move deeper into 2021, investors face the challenge of finding durable dividends—income sources that are both sustainable and growing. It is likely this idea will be front-and-center in many dividend discussions for the foreseeable future, especially as investors wait for corporate earnings and cash flows to rebound to pre-COVID-19 levels.
One of the best ways to identify companies capable of producing durable dividends is to look at their fundamentals. Specifically, you should look at their cash flows, which are the lifeblood of dividends. Over time, companies must create enough cash flow to pay expenses, invest in their business via capital expenditures, service their debt, and (sometimes) return money to shareholders via dividends and buybacks.
Without getting overly technical, let’s take a high-level look at one critical cash-flow metric.
Free cash flow (“FCF”) measures the cash left over after a company pays its operating expenses and capital expenditures, and it represents the resources available to pay dividends.
Cash Flows from Operations (CFO) – Capital Expenditures = Free Cash Flow
Free cash flows can be turned into a payout ratio by calculating how much the company’s dividend represents measured as a percentage of free cash flows.
Dividends / Free Cash Flow = Free Cash Flow Payout Ratio
All else being equal, a lower payout ratio is better. It gives a company the flexibility to continue paying and growing dividends, even if the company has some variability in its underlying cash flows. In contrast, a company with a high payout ratio has very little flexibility. A higher payout ratio may also indicate a greater likelihood that the company will cut or suspend dividends if earnings and cash flow falter. Dividend growth strategies generally appear better positioned, relative to high dividend yielding strategies, to sustain and grow their dividends.
Free Cash Flow Payout Ratios
Dividend Growers versus High Yielders
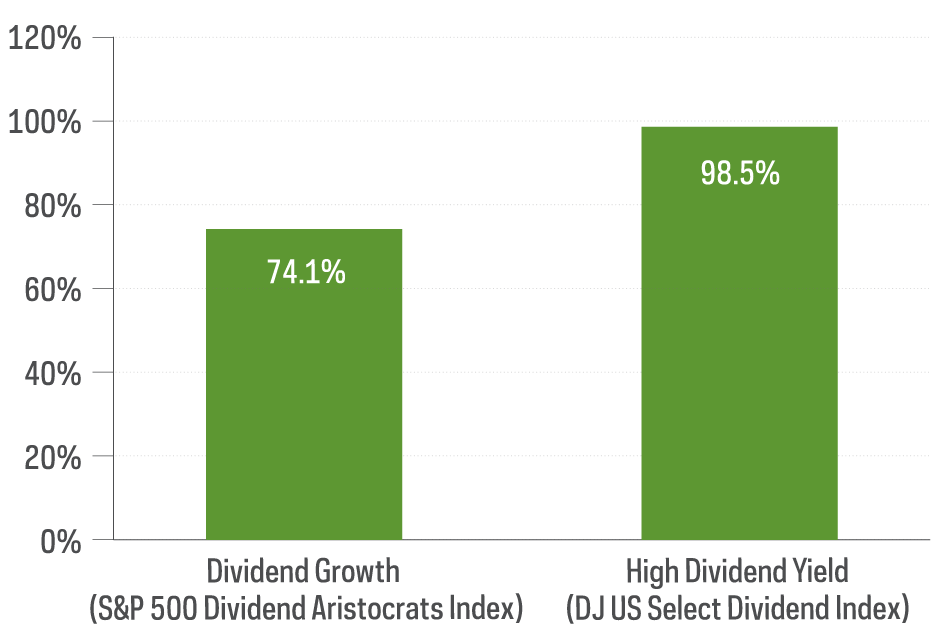
Source: FactSet, cash flow ratios from 1/1/20—12/31/20.
While the worst of the pandemic’s impact on dividends appears to be behind us, we urge dividend investors to remain vigilant in today’s market environment. Making a distinction between dividend growth and high yield strategies had important implications in 2020, and it will remain a key topic moving forward in 2021. Investors searching for durable dividends should consider fundamentals like free cash flow payout ratios to help identify companies positioned to deliver a sustainable and growing source of income over time.
This is not intended to be investment advice. Any forward-looking statements herein are based on expectations of ProShare Advisors LLC at this time. ProShare Advisors LLC undertakes no duty to update or revise any forward-looking statements, whether as a result of new information, future events or otherwise.
Investing is currently subject to additional risks and uncertainties related to COVID-19, including general economic, market and business conditions; changes in laws or regulations or other actions made by governmental authorities or regulatory bodies; and world economic and political developments.
The "S&P 500® Dividend Aristocrats® Index" and "S&P MidCap 400® Dividend Aristocrats Index" are products of S&P Dow Jones Indices LLC and its affiliates. All have been licensed for use by ProShares. "S&P®" is a registered trademark of Standard & Poor's Financial Services LLC ("S&P") and "Dow Jones®" is a registered trademark of Dow Jones Trademark Holdings LLC ("Dow Jones") and have been licensed for use by S&P Dow Jones Indices LLC and its affiliates. ProShares have not been passed on by these entities and their affiliates as to their legality or suitability. ProShares based on these indexes are not sponsored, endorsed, sold or promoted by these entities and their affiliates, and they make no representation regarding the advisability of investing in ProShares.
THESE ENTITIES AND THEIR AFFILIATES MAKE NO WARRANTIES AND BEAR NO LIABILITY WITH RESPECT TO PROSHARES.
Learn More
NOBL
S&P 500 Dividend Aristocrats ETF
Seeks investment results, before fees and expenses, that track the performance of the S&P 500® Dividend Aristocrats® Index.
REGL
S&P MidCap 400 Dividend Aristocrats ETF
Seeks investment results, before fees and expenses, that track the performance of the S&P MidCap 400® Dividend Aristocrats® Index.
SMDV
Russell 2000 Dividend Growers ETF
Seeks investment results, before fees and expenses, that track the performance of the Russell 2000® Dividend Growth Index.
Dividend Growers
Dividend Growers