
Natural gas prices surged to multi-year highs in January on the back of sharply increased demand resulting from a major late-month storm and persistent cold snap that left much of the United States blanketed in ice and snow.
This year’s heightened gas price volatility is especially notable compared with the recent past. Let’s look at standardized daily returns (Z-scores,[1] based on roughly three years of history) for natural gas prices during the December 2025 to January 2026 period compared with the same window in 2023 and 2024.
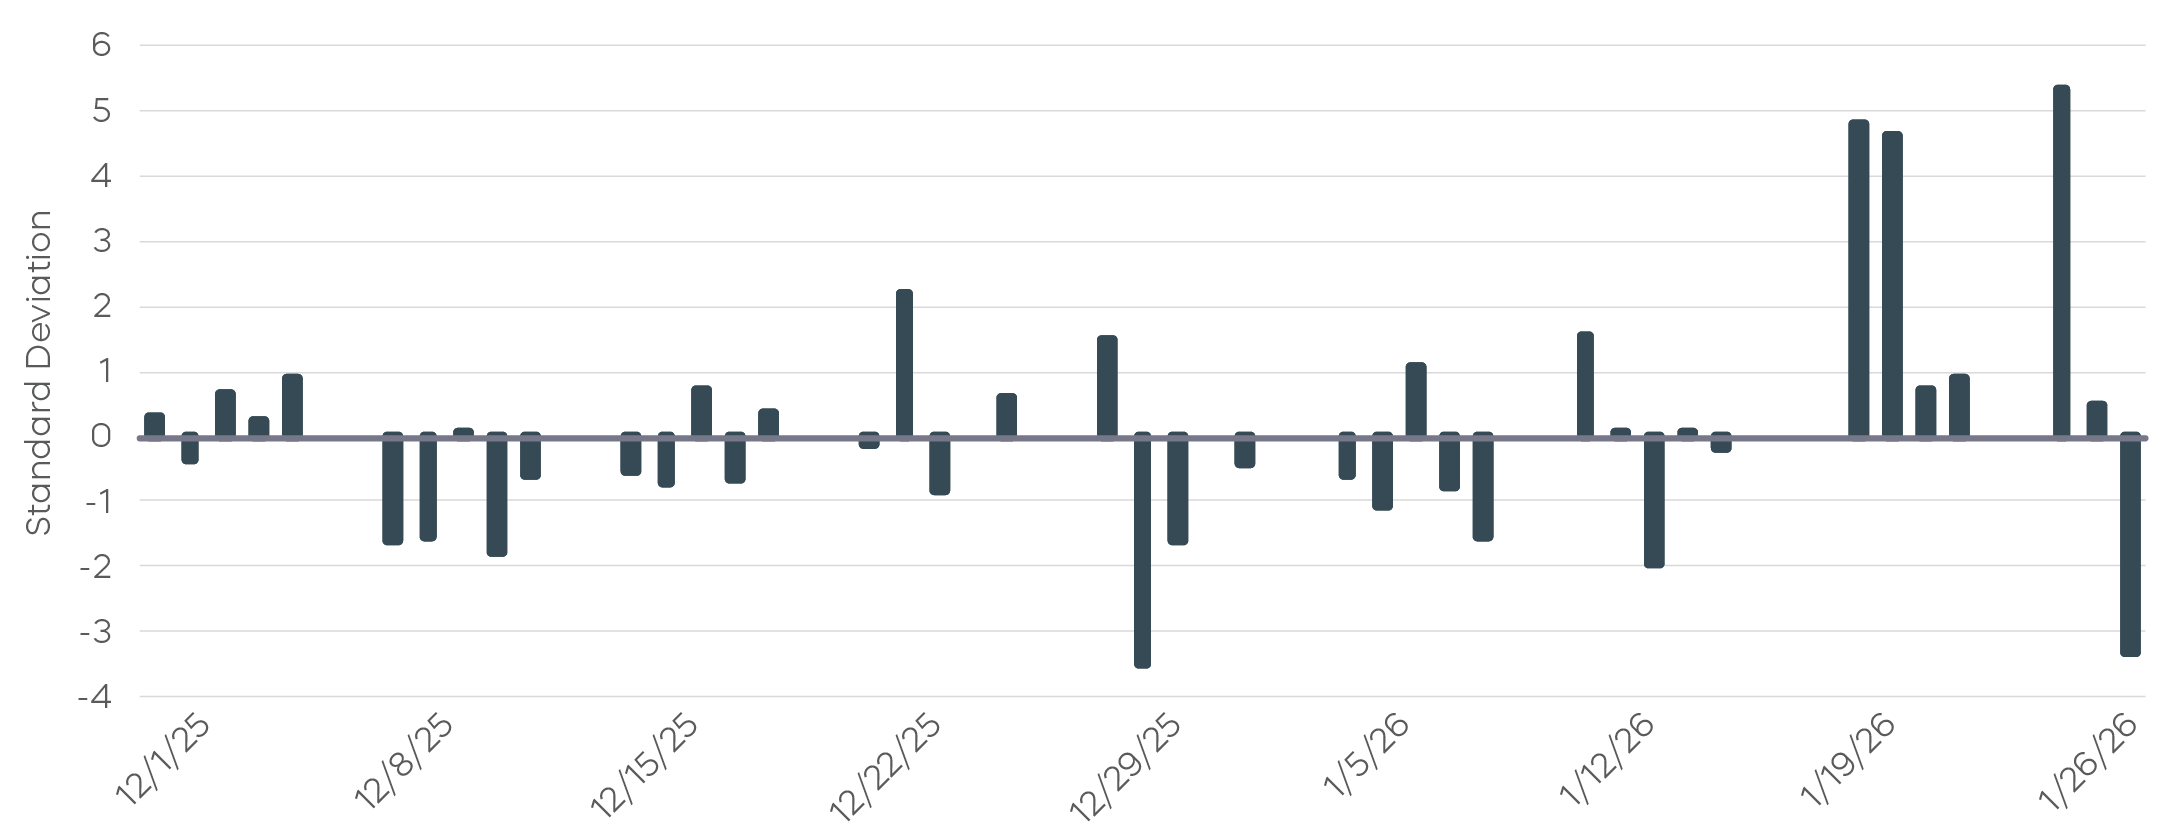
As of January 28, the current period (charted below) had already seen six days with price moves exceeding two standard deviations—four to the upside and two to the downside—pointing to an unusually volatile regime. By contrast, markets recorded just two such extreme moves during the same periods in each of the previous two winters (see 2023-2024 example in second chart), underscoring how exceptional the current period’s price behavior has been.
December 2025–January 2026
December 2023–January 2024
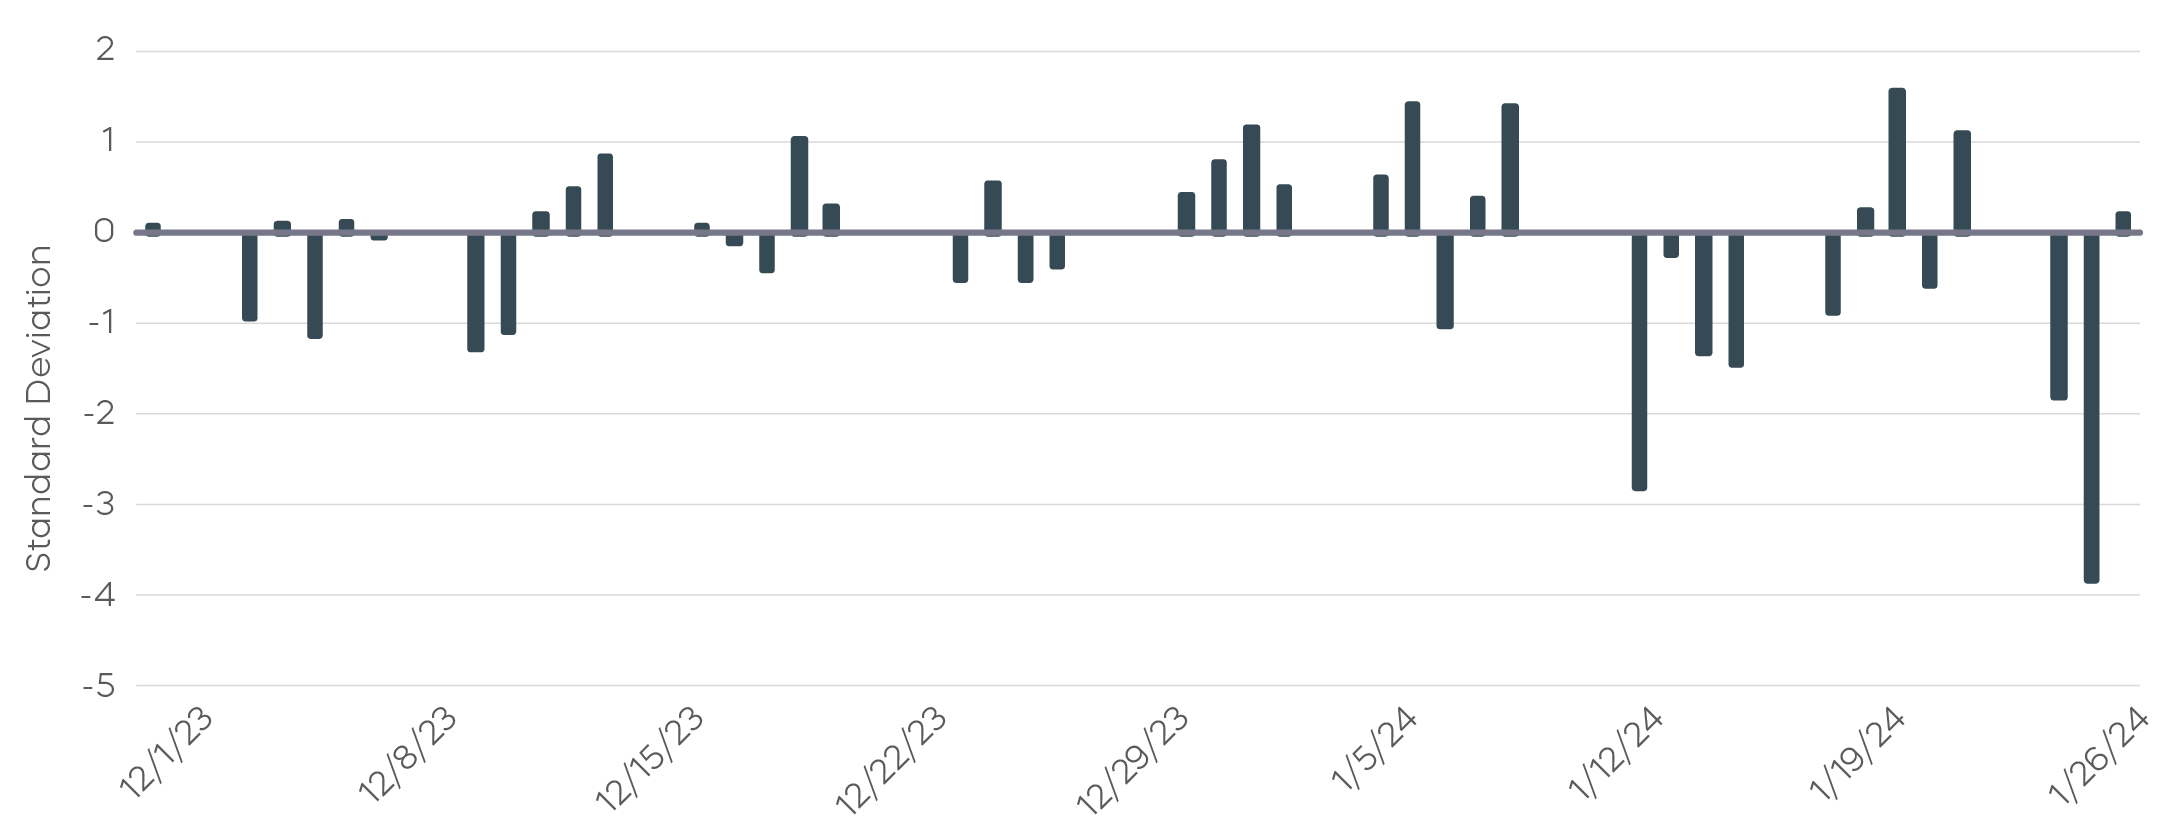
Source: Bloomberg, based on NYMEX generic front month natural gas prices and ProShares calculations of Z-scores 1/26/23–1/28/26.
Looking ahead, the risk of additional cold-weather outbreaks suggests the potential for further price spikes and elevated volatility. Beyond weather, the broader macro backdrop may also support higher prices in 2026, as rising Liquified Natural Gas (LNG) demand from Asia and Europe combined with ongoing geopolitical and weather-related risks sustains global competition for supply.
Offsetting these factors are meaningful supply expansions in the United States and Qatar along with signs of softer demand in some regions. Europe’s influence remains nuanced: while overall natural gas demand is declining structurally, the phase-out of Russian pipeline gas may increase reliance on LNG at the margin, which can still lend support to prices during periods of stress.
[1]Z-scores are a standardized measure of how far a particular data value is from the mean of a normally distributed data set calculated by subtracting the mean from a data value and then dividing by the standard deviation.