 Dividend Growers
Dividend Growers
Dividend Growers
Where Dividends Stood in July
Amid the tug-of-war between improving economic data and a resurgence of the coronavirus in the United States and around the world, dividend cuts have continued. But we have also seen a pattern of resilience from quality companies known for dividend growth. High-quality companies with long track records of consistently growing their dividends—companies that generally have had stable earnings, solid fundamentals, and strong histories of profit and growth—have so far shown a significant ability to maintain their dividend growth this year despite the pandemic and related economic crises.
While our Dividend Viewpoint series has focused to date on the large-cap companies of the S&P 500® Dividend Aristocrats® Index, in this article we will review the resilience of mid-cap and small-cap dividend growth strategies as well. But first, here is a look at the state of dividends through July.
Dividend Scorecard:
Dividend Cutters versus Dividend Raisers, by Market Cap
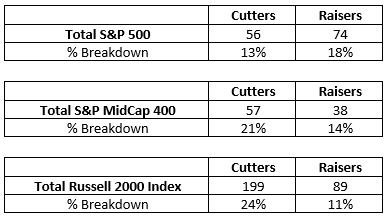
Source: Bloomberg, ProShares. Based on dividend per share announcements from 1/1/20–7/31/20 broken down as a percentage of dividend payers in each index. Past performance is no guarantee of future results.
Dividend Cutter Performance Comparison
Companies that Cut Dividends Have Been Punished
(Year-to-Date Returns)
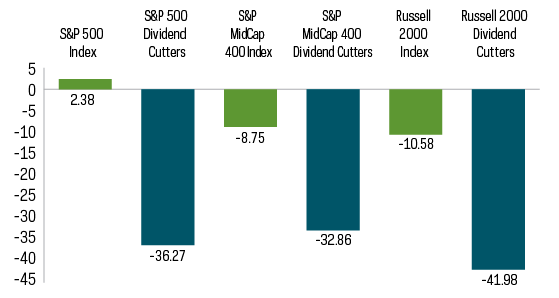
Source: Bloomberg, ProShares. Performance data from 12/31/19–7/31/20. “Cutters” represent the average return of companies within the respective indexes that have cut dividends. Past performance is no guarantee of future results.
The Resiliency of Dividend Growth Companies in Mid and Small Caps
As we discussed in our previous article, The Dividend Growth Advantage: Resilience for Today's Markets, there is an elite segment of the large-cap equity market that has been less susceptible to dividend cuts this year. Among the S&P 500 Dividend Aristocrats—an index of high-quality companies that have increased their dividends for at least 25 consecutive years—just one has cut its dividend and been removed from the index. Now, we are extending our analyses to include mid- and small-cap companies. Has there been similar resiliency among dividend growers in those asset classes?
S&P and Russell both systematically review and remove from their dividend growth indexes companies that have had dividend cuts. As of July 31, only two companies that were in the S&P MidCap 400® Dividend Aristocrats® —an index of mid-cap companies that have raised their dividends for at least 15 consecutive years—had cuts. Among small caps, only seven companies that were previously in the Russell 2000® Dividend Growth Index—companies that have grown their dividends for at least 10 consecutive years—had cuts.
This resiliency among mid-cap and small-cap dividend growers is particularly impressive. Dividend cuts are typically more prevalent the farther down one looks in market capitalization. In fact, during 2020 so far, nearly one quarter of all mid- and small-cap dividend-paying companies (as seen in Figure 1) have been forced to cut their dividends.
Once Again, Quality Is a Driving Factor
In The Dividend Growth Advantage: Resilience for Today's Markets, we made the case that the likely source of current and historical resiliency among large-cap dividend growth companies was quality (measured by credit quality in the previous article as a broad proxy for hallmarks such as stable earnings, solid fundamentals, and strong histories of profit and growth) . Quality appears to be a key driver of dividend resiliency in mid- and small-cap stocks as well.
Dividend Growers Key Metric Comparison
The Hallmarks of Quality Across Market Caps
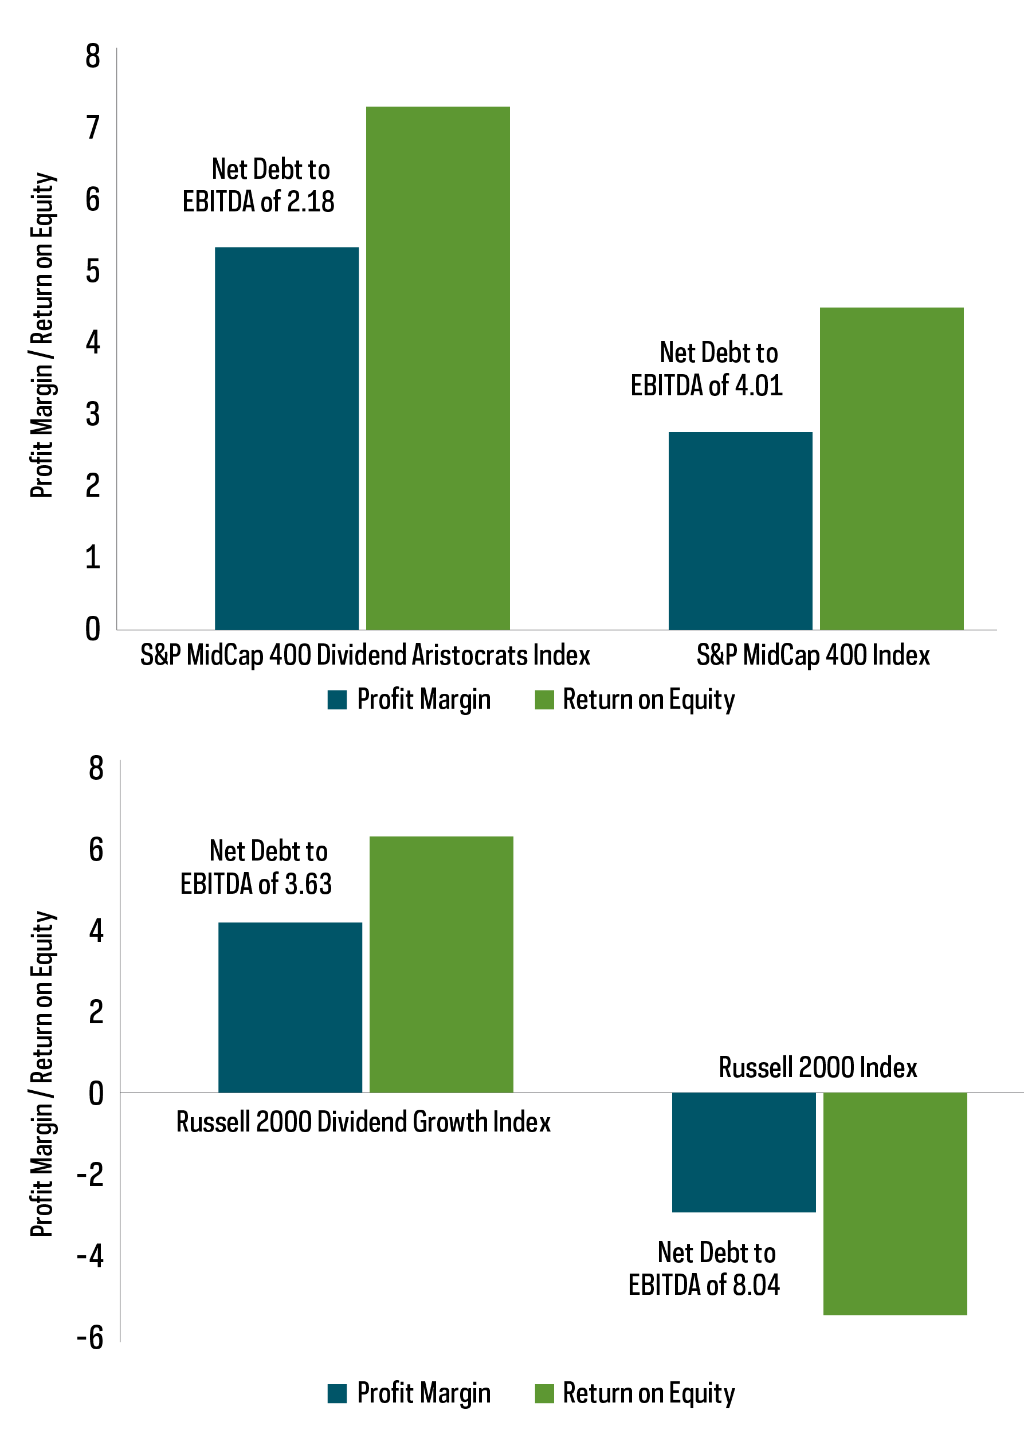
Source: Bloomberg, as of 7/31/20. EBITDA stands for earnings before interest, taxes, depreciation and amortization. It is a commonly used measure of a company's financial performance. Past performance is no guarantee of future results.
Both the S&P MidCap 400 Dividend Aristocrats and the Russell 2000 Dividend Growth Indexes generate higher profit margins, return on equity and have lower debt levels than their broader parent indexes. Of note, profit margins and return on equity are negative for the overall Russell 2000, while positive for the Russell 2000 Dividend Growth. And, as is the case with the S&P 500 Dividend Aristocrats Index, the S&P MidCap 400 Dividend Aristocrats and the Russell 2000 Dividend Growth Indexes do not specifically screen for credit, quality or other factors. They screen exclusively for companies that have continuously increased dividends, and the resulting quality of the companies is an elegant by-product of that consistent track record of dividend growth.
High Dividend Yielders at Risk in Mid and Small Cap Too
We have also noted before that equities with high dividend yields may be particularly at risk for dividend cuts. Here again, we note the same pattern of risk in mid- and small-cap stocks.
Dividend Cutters by Dividend Yield
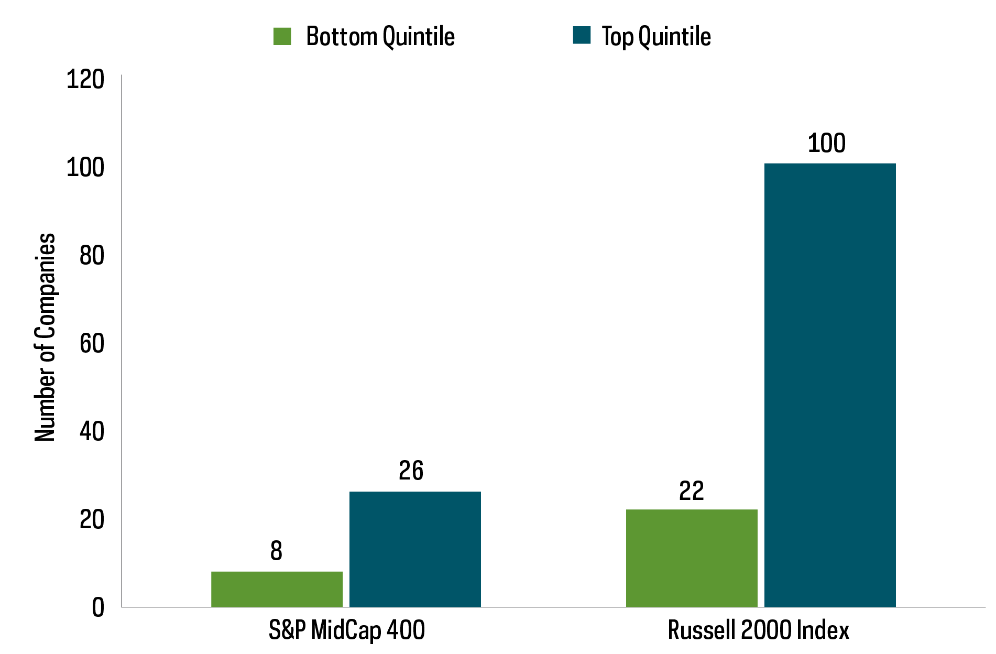
Source: Bloomberg, ProShares, based on dividend per share announcements 1/1/20–7/31/20. Past performance is no guarantee of future results.
Quality at a Reasonable Price
Quality comes at a price, as the saying goes. And historically that has been true for both the S&P MidCap 400 Dividend Aristocrats and the Russell 2000 Dividend Growth Indexes, which have historically traded at higher valuations multiples compared to the S&P MidCap 400 and Russell 2000, respectively. Of course, valuation is a multifaceted concept, with several metrics having their own distinct advantages and trade-offs. Given the likely volatility in earnings, price-to-book value can be viewed as a more stable valuation measure. Looking at valuation through this lens in the figure below, we can see that the outperformance of technology, among other factors, leaves both the S&P MidCap 400 Dividend Aristocrats and the Russell 2000 Dividend Growth Indexes trading at a discount today—you could call it getting quality at a reasonable price.
Price-to-Book Comparison: Mid- and Small-Cap Dividend Growth Indexes Have Recently Traded at a Relative Discount
(2020 Estimated Price-to-Book Value)
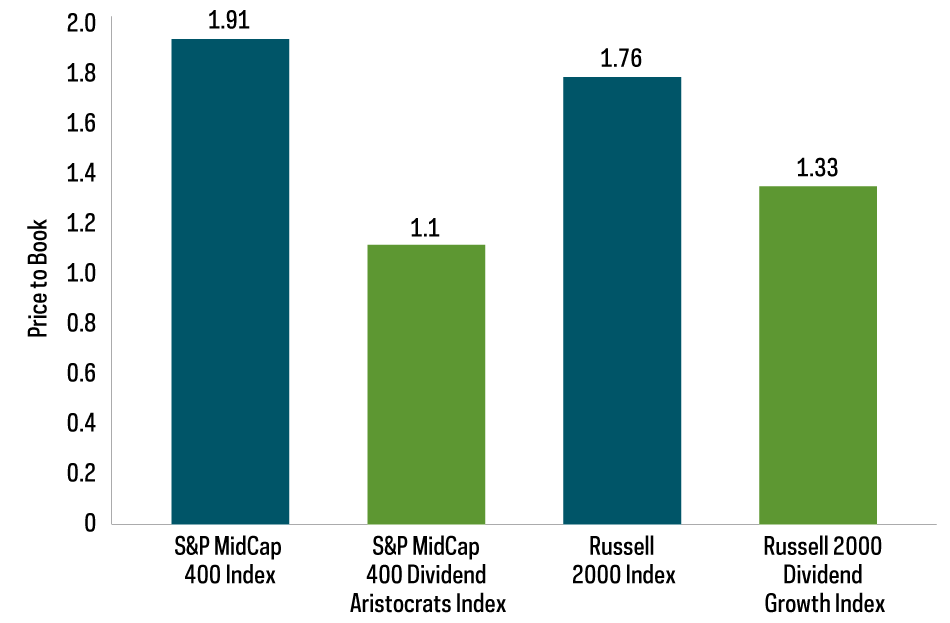
Source: Bloomberg, ProShares, 2020 estimated price-to-book values as of 7/31/20. The price-to-book ratio is a measure of valuation that compares a company’s stock price per share by its book value per share, which is tangible assets minus liabilities. Past performance is no guarantee of future results.
Resilient dividend growth companies across mid and small caps and the potential to invest in quality at a reasonable price—that seems like quite a compelling combination.
This is not intended to be investment advice. Any forward-looking statements herein are based on expectations of ProShare Advisors LLC at this time. ProShare Advisors LLC undertakes no duty to update or revise any forward-looking statements, whether as a result of new information, future events or otherwise.
Investing is currently subject to additional risks and uncertainties related to COVID-19, including general economic, market and business conditions; changes in laws or regulations or other actions made by governmental authorities or regulatory bodies; and world economic and political developments.
Investing involves risk, including the possible loss of principal. Investments in smaller companies typically exhibit higher volatility. Small- and mid-cap companies may have limited product lines or resources, may be dependent upon a particular market niche and may have greater fluctuations in price than the stocks of larger companies. Small- and mid-cap companies may lack the financial and personnel resources to handle economic or industry-wide setbacks and, as a result, such setbacks could have a greater effect on small- and mid-cap security prices. There is no guarantee any ProShares ETF will achieve its investment objective.
Carefully consider the investment objectives, risks, charges and expenses of ProShares before investing. This and other information can be found in their summary and full prospectuses. Read them carefully before investing.
The "S&P 500," "S&P 500® Dividend Aristocrats® Index," S&P MidCap 400®," S&P MidCap 400® Dividend Aristocrats Index" are products of S&P Dow Jones Indices LLC and its affiliates. "Russell 2000® Dividend Growth Index" and "Russell® " are trademarks of Russell Investment Group. All have been licensed for use by ProShares. "S&P® " is a registered trademark of Standard & Poor's Financial Services LLC ("S&P") and "Dow Jones® " is a registered trademark of Dow Jones Trademark Holdings LLC ("Dow Jones") and have been licensed for use by S&P Dow Jones Indices LLC and its affiliates. ProShares have not been passed on by these entities and their affiliates as to their legality or suitability. ProShares based on these indexes are not sponsored, endorsed, sold or promoted by these entities and their affiliates, and they make no representation regarding the advisability of investing in ProShares.
THESE ENTITIES AND THEIR AFFILIATES MAKE NO WARRANTIES AND BEAR NO LIABILITY WITH RESPECT TO PROSHARES.
Learn More
NOBL
S&P 500 Dividend Aristocrats ETF
Seeks investment results, before fees and expenses, that track the performance of the S&P 500® Dividend Aristocrats® Index.
REGL
S&P MidCap 400 Dividend Aristocrats ETF
Seeks investment results, before fees and expenses, that track the performance of the S&P MidCap 400® Dividend Aristocrats® Index.
SMDV
Russell 2000 Dividend Growers ETF
Seeks investment results, before fees and expenses, that track the performance of the Russell 2000® Dividend Growth Index.
Dividend Growers
Dividend Growers