 Dividend Growers
Dividend Growers
Dividend Growers
Many investors are—sensibly—considering rebalancing their portfolios away from the large-cap tech and growth stocks that have driven market performance. The search is on for strategies that may potentially lead the next leg of a rally. Value stocks are one example, as they tend to trade at lower prices relative to their fundamentals. While value stocks are indeed less expensive, they may represent a “value trap”—cheap for a reason. As a group, the companies in the S&P 500 Dividend Aristocrats Index offer a compelling alternative of historically attractive valuation, higher quality—as measured by credit ratings, price/earnings (P/E) ratios and return on assets (ROA)—resiliency, better total return and higher historical dividend growth.
Price/earnings (P/E) ratio shows how much investors are paying for a dollar of a company's earnings. Return on assets (ROA) indicates how efficiently a company utilizes its assets, by determining how profitable a company is relative to its total assets.
Large-Cap Tech and Growth Stocks: Some Considerations
What’s not to love about large-cap tech and growth stocks? The tech sector accounts for nearly 40% of the market-cap weighted S&P 500 Growth Index. If you include Facebook, Google and Amazon, that figure rises to more than 55%.
Shouldn’t these companies be driving the market? The pandemic alignment is clear: Working from home, e-commerce, cloud computing and other transformative business changes have helped buoy technology-related companies. Low interest rates help, too. In fact, low interest rates disproportionately help growth stocks by increasing the value of big cash flows out into the future. The fear of missing out—or more formally, “momentum”—has also supported tech stocks. If fundamentals are important to you, note that, as opposed to 20 years ago, most of these high-flying tech companies are highly profitable. So what’s the problem?
S&P 500 Growth Index Price to Book Ratio
Rising Growth Valuations
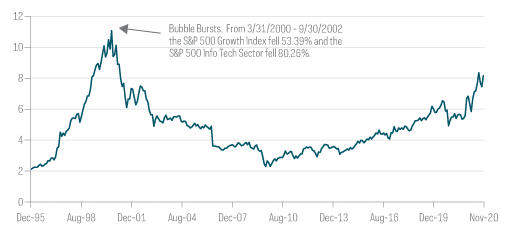
Source: Bloomberg, 12/29/95-11/30/20. Price-to-book ratio measures market value of a fund or index relative to the collective book values of its component stocks. For illustrative purposes only. Past performance is no guarantee of future results.
While tech valuations are extremely high, this time around many tech stocks are generating strong earnings and cash flow. Thus, the risk of an 80% decline in tech and a 50% decline in the S&P 500 Growth Index may be quite low. Even a modest economic rebound could help as well.
What Are the Alternatives?
When faced with potentially volatile markets, some investors consider low volatility strategies such as the S&P 500 Low Volatility Index. Low volatility strategies can deliver on their objectives, but that generally means investors are happy if they own them when the market goes down, but not so much if the market goes up. This is a great solution if you happen to have a market timing buzzer in your pocket. Other investors, noting the low bond yields in their fixed income portfolios, may consider high dividend-yielding equities. As we’ve noted in our previous article, The Quality-Based Differences Developing in Dividends, a stock’s high yield may too often be an indicator of lower quality, with higher odds of a dividend cut.
Is It Time for Value?
The classic alternative to tech and growth stocks is value stocks. However, it’s been a long time since value stocks were market leaders.
Relative Price to Book:
S&P 500 Value/S&P 500 Growth—Value Gets Cheaper
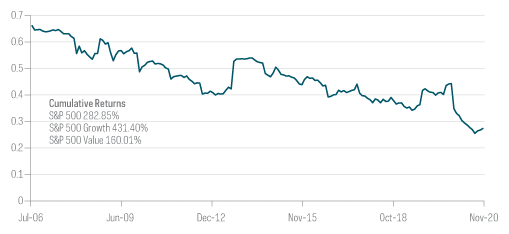
Source: Bloomberg, 7/31/06-11/30/20. 7/31/06 was a long-term peak relative valuation for value stocks. For illustrative purposes only. Past performance is no guarantee of future results.
Value proponents—some of whom have been pounding the table for more than 15 years—will point to those attractive valuations or say that the theory of mean reversion (performance eventually returns to long-term averages) suggests value will work again. There is also the notion that value stocks will be outsized beneficiaries of an economic recovery. From a sector standpoint, the smaller tech allocation is a vote in favor for some, as are extra allocations to financials and healthcare for a post-pandemic world.
So what are the marks against value? With regard to Figure 2, consider the size of the penalty for being wrong. Even if value begins to outperform, value represents a dilemma. The call may be right eventually, but an investor can suffer sustained underperformance before the call proves right. And could those low prices be justified? Of course value stocks are not expected to have the same growth prospects as growth stocks. But many fundamentals of value stocks are weaker across the board on such measures as gross margin, profit margin, return on assets and return on equity. Weak fundamentals can also point to dividends at risk—and dividend cuts are typically not well received.
Dividend Scorecard: Dividend Cutters Are Punished
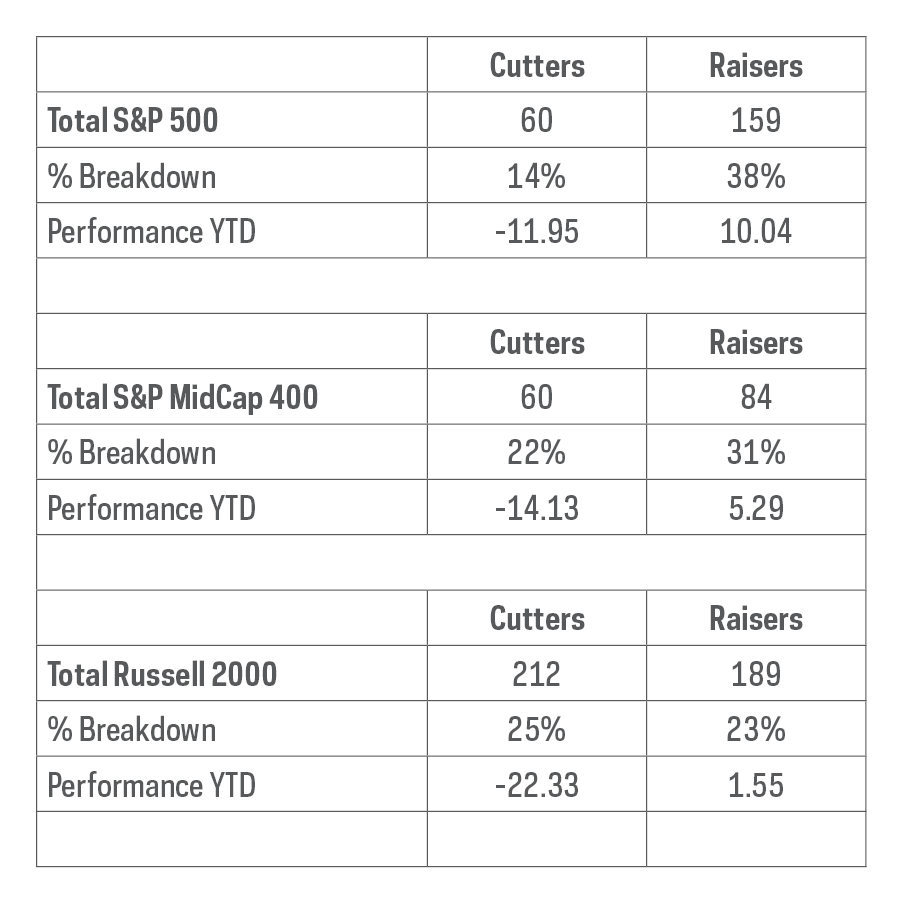
Source: Bloomberg, ProShares. Based on DPS announcements from 1/1/20–11/30/20 broken down as a percentage of dividend payers in each index. Past performance is no guarantee of future results. Chart is provided for illustrative purposes.
Dividend Growth: Quality at a Reasonable Price
As a group, companies that have consistently grown their dividends for at least 25 years present a compelling combination of quality at a reasonable price that may be a particularly robust alternative to large-cap tech and growth stocks, and a more compelling choice than value.
First, let’s check in on quality in terms of credit ratings.
S&P 500 Dividend Aristocrats Index vs. S&P 500 Value Index Credit Rating Comparison
Higher Credit Quality in Dividend Growth
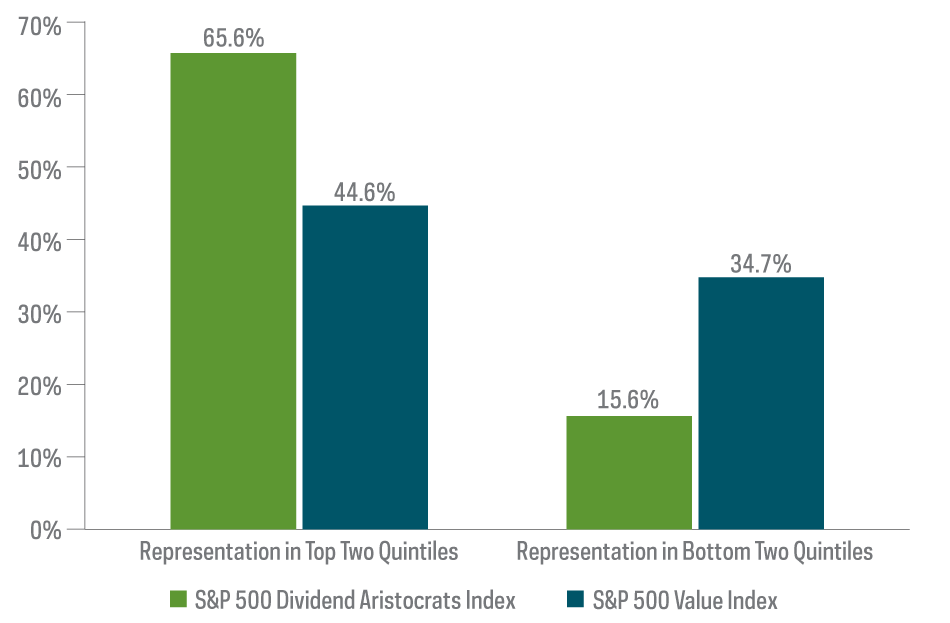
Source: Bloomberg, as of 12/31/19. For illustrative purposes only.
Credit ratings provide a convenient quality snapshot since they consider a range of fundamental characteristics. The companies in the S&P 500 Dividend Aristocrats Index (companies that have increased their dividends for at least 25 consecutive years) are substantially skewed to higher credit ratings, while the companies in the S&P 500 Value Index tilt notably to lower credit ratings. While credit ratings are a measure of quality, introducing valuation to the comparison is particularly revealing.
Dividend Growth: Quality at a Reasonable Price
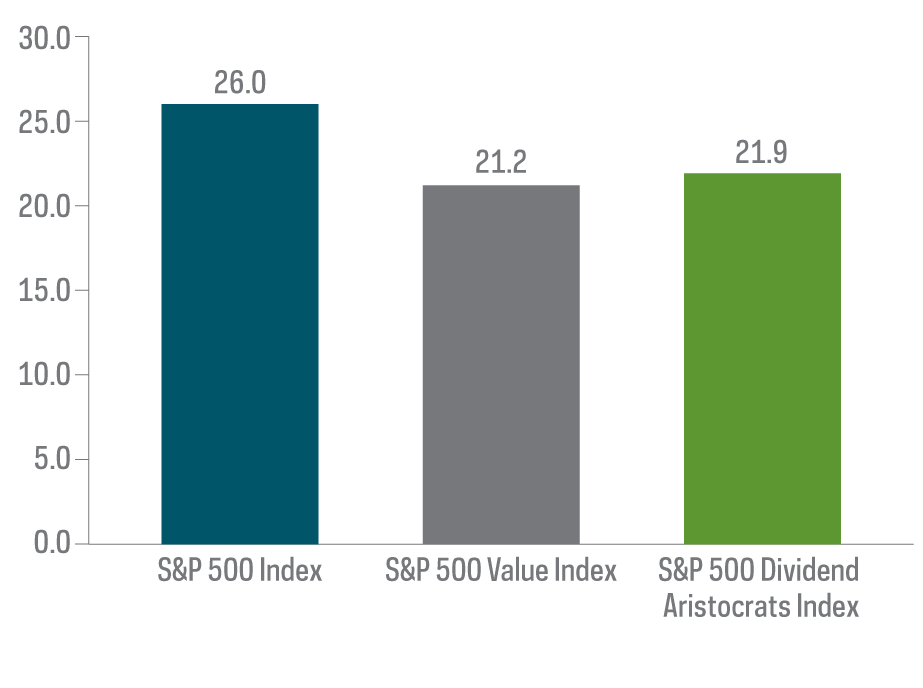
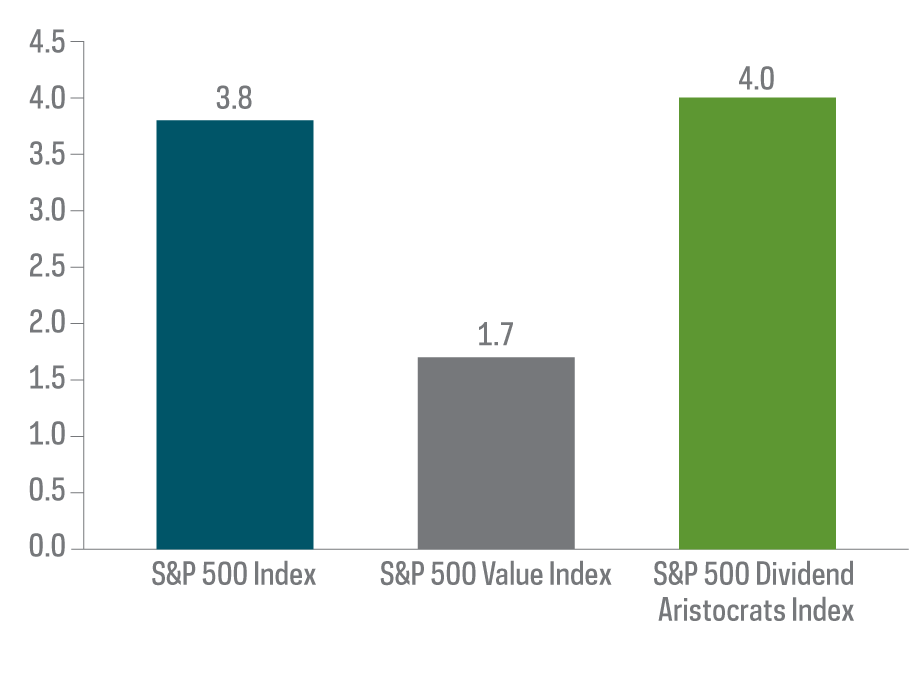
Comparison of 2020 P/E and ROA Estimates
Price/Earnings (PE) Ratio
Return on Assets (ROA)
Source: Bloomberg, calendar year estimates as of 12/11/20. For illustrative purposes only.
While both the S&P 500 Value Index and the S&P 500 Dividend Aristocrats Index are trading at similar discounts to the S&P 500, the S&P 500 Value Index is delivering an anemic return on assets (ROA), while the S&P 500 Dividend Aristocrats Index is producing higher ROA than the S&P 500—hence, quality at a reasonable price.
Using a price to book multiple to provide insight to valuation over time reinforces the attractiveness of the S&P 500 Dividend Aristocrats Index price-and-credit-quality combination. Historically, the higher credit quality of the S&P 500 Dividend Aristocrats Index has driven a premium valuation to the S&P 500, not a discount. The S&P 500 Dividend Aristocrats Index is trading at just under 85% of the S&P 500’s price to book multiple, down from a high point in the last five years of nearly 140%. While the S&P 500 Value Index is trading at a larger discount—56% of the S&P 500 price to book multiple—this is only a modest discount from its five-year high point of just over 70%.
The Resiliency of Dividend Growth Companies
The S&P 500 Dividend Aristocrats Index requirement of a minimum of 25 consecutive years of dividend increases means that these companies increased their dividends in difficult environments like the Great Recession and the Tech Wreck. As a group, they have exhibited the same resiliency in today’s pandemic-challenged environment.
Dividend Cutters and Raisers: Dividend Growth Delivers Dividend Resiliency
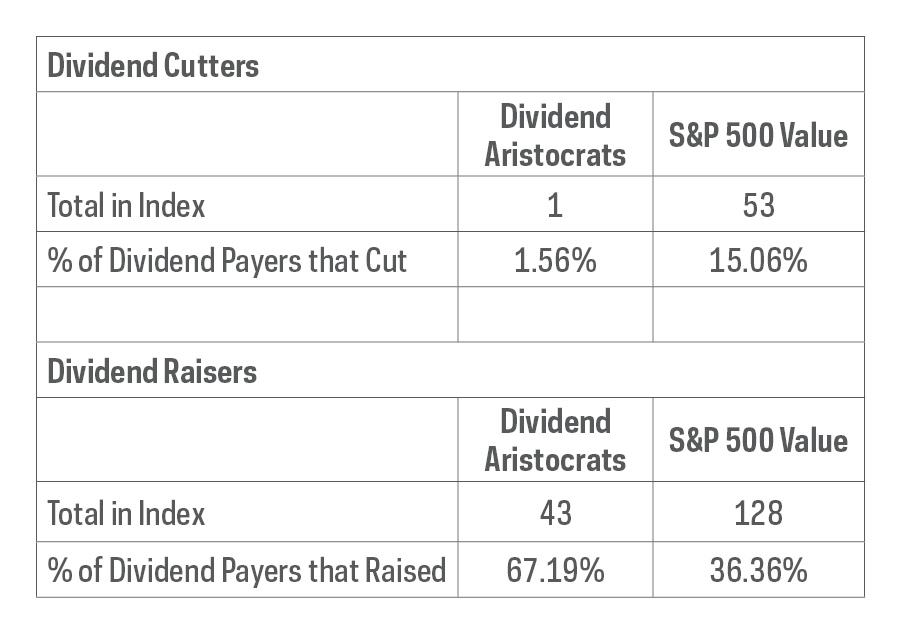
Source: Bloomberg, ProShares, 1/1/20–11/30/20. The company that cut its dividend has been removed from the index. Past performance is no guarantee of future results.
In fact, more than two-thirds of the companies in the S&P 500 Dividend Aristocrats Index have already increased their dividends so far this year—nearly double that of the S&P 500 Value Index. In addition, only one Dividend Aristocrat has cut its dividend and was removed from the index in June 2020, far fewer than in the S&P 500 Value Index on both an absolute and percentage basis. Given the market’s punishing of dividend cutters noted above, it follows that the S&P 500 Dividend Aristocrats Index has significantly outperformed the S&P 500 Value Index, gaining 7% as of YTD 11/30/20, compared with a 2% loss for the S&P 500 Value Index during the same period. That higher quality and resiliency have driven long-term outperformance as well.
Long-Term Performance of S&P 500 Dividend Aristocrats Index vs. S&P 500 Value Index—Dividend Growth has Outperformed
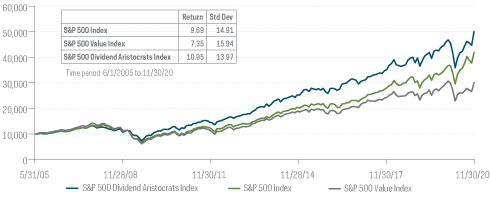
Source: Bloomberg, ProShares, 5/31/05–11/30/20. For illustrative purposes only.
Not only has the S&P 500 Dividend Aristocrats Index substantially outperformed the S&P 500 Value Index with less volatility since inception, it has outperformed the S&P 500 as well.
Dividend Growth Delivers… Dividend Growth
Since dividend yield is simply dividend divided by price, value stocks should have an attractive dividend yield. Indeed, the current dividend yield for the S&P 500 Value Index is 2.64% as of 11/30/20, which is significantly higher than the 1.66% yield of the S&P 500 during the same period. The shortcoming of the S&P 500 Value Index, however, has been anemic dividend growth, both a detriment to investors focused on yield, and a key source of historical underperformance of total return.
S&P 500 Dividend Aristocrats Index vs. S&P 500 Value Index
Dividend Growth Delivers… Higher Dividend Growth
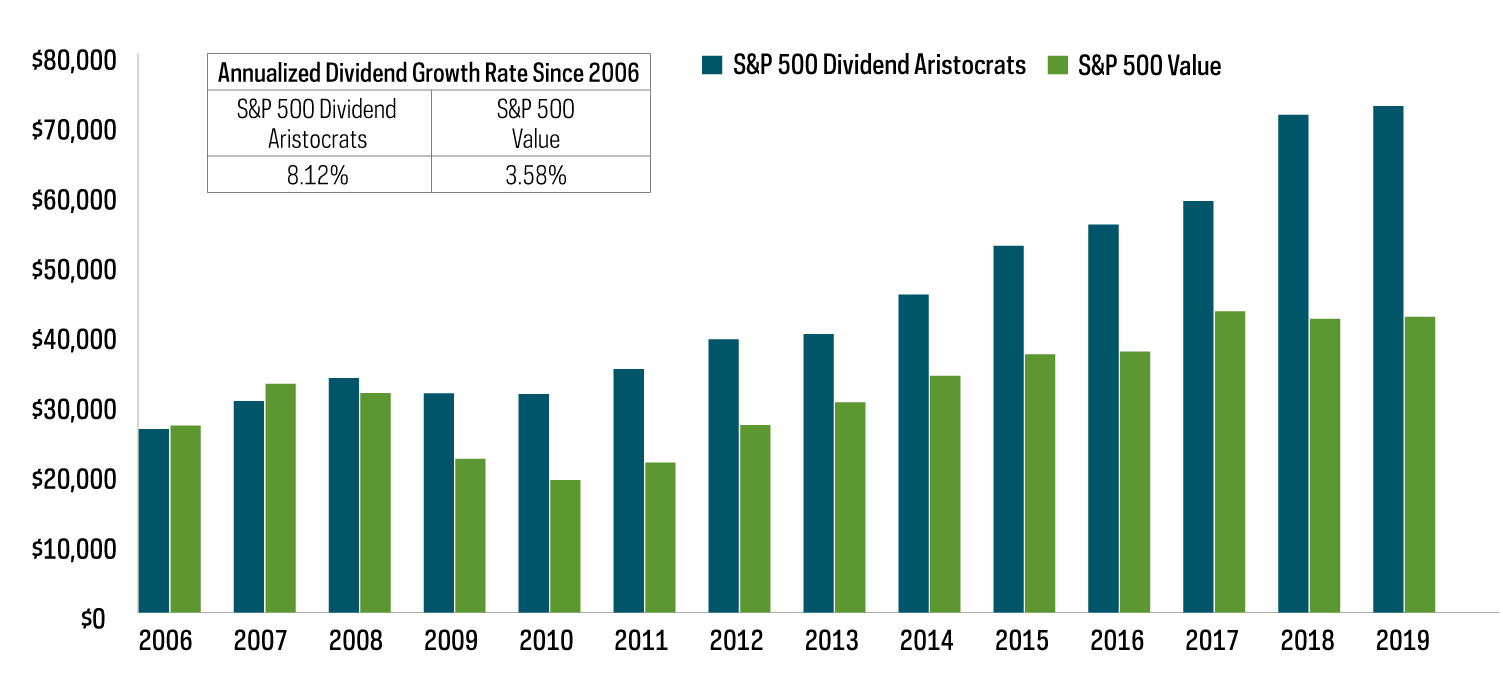
Source: Bloomberg, ProShares, 12/31/05-12/31/19. Yield on cost is a measure of dividend yield calculated by dividing a stock's current dividend by the price initially paid for that stock. For illustrative purposes only.
The yield on the S&P 500 Dividend Aristocrats Index stands at 2.61% as of 11/30/20, just a hair below the yield on the S&P 500 Value Index. However, with a historical dividend growth rate more than double, the S&P 500 Dividend Aristocrats Index has reaped a higher yield on the original investment cost, providing an attractive growing income stream and contributing to strong historical total return.
This is not intended to be investment advice. Any forward-looking statements herein are based on expectations of ProShare Advisors LLC at this time. ProShare Advisors LLC undertakes no duty to update or revise any forward-looking statements, whether as a result of new information, future events or otherwise.
Investing is currently subject to additional risks and uncertainties related to COVID-19, including general economic, market and business conditions; changes in laws or regulations or other actions made by governmental authorities or regulatory bodies; and world economic and political developments.
The "S&P 500® Dividend Aristocrats® Index" and "S&P MidCap 400® Dividend Aristocrats Index" are products of S&P Dow Jones Indices LLC and its affiliates. "Russell 2000® Dividend Growth Index" and "Russell®" are trademarks of Russell Investment Group. All have been licensed for use by ProShares. "S&P®" is a registered trademark of Standard & Poor's Financial Services LLC ("S&P") and "Dow Jones®" is a registered trademark of Dow Jones Trademark Holdings LLC ("Dow Jones") and have been licensed for use by S&P Dow Jones Indices LLC and its affiliates. ProShares have not been passed on by these entities and their affiliates as to their legality or suitability. ProShares based on these indexes are not sponsored, endorsed, sold or promoted by these entities and their affiliates, and they make no representation regarding the advisability of investing in ProShares.
THESE ENTITIES AND THEIR AFFILIATES MAKE NO WARRANTIES AND BEAR NO LIABILITY WITH RESPECT TO PROSHARES.
Learn More
NOBL
S&P 500 Dividend Aristocrats ETF
Seeks investment results, before fees and expenses, that track the performance of the S&P 500® Dividend Aristocrats® Index.
REGL
S&P MidCap 400 Dividend Aristocrats ETF
Seeks investment results, before fees and expenses, that track the performance of the S&P MidCap 400® Dividend Aristocrats® Index.
SMDV
Russell 2000 Dividend Growers ETF
Seeks investment results, before fees and expenses, that track the performance of the Russell 2000® Dividend Growth Index.
Dividend Growers
Dividend Growers