
The Long-Term Appeal of Companies That Consistently Increase Dividends
Companies that consistently grow their dividends, year after year, have become especially popular with investors in recent years. Generally, these high-quality companies have displayed durable business models, stable earnings, solid fundamentals, and strong histories of profit and growth. As a result, strategies featuring companies with consistent dividend growth have exhibited strong performance characteristics under a wide range of market conditions.
Hallmarks of Consistent Dividend Growth

Have Delivered Stronger Risk-Adjusted Return
Investment strategies focused on consistent dividend growth have generally outperformed their benchmarks over the long term. For example, one of the most widely followed dividend growth strategies is the S&P 500® Dividend Aristocrats® Index, which focuses on companies with at least 25 years of uninterrupted dividend growth. Since its inception, the index has outperformed the S&P 500 on a risk-adjusted basis.
S&P 500 Dividend Aristocrats Index vs. S&P 500
5/2/05 – 3/31/25
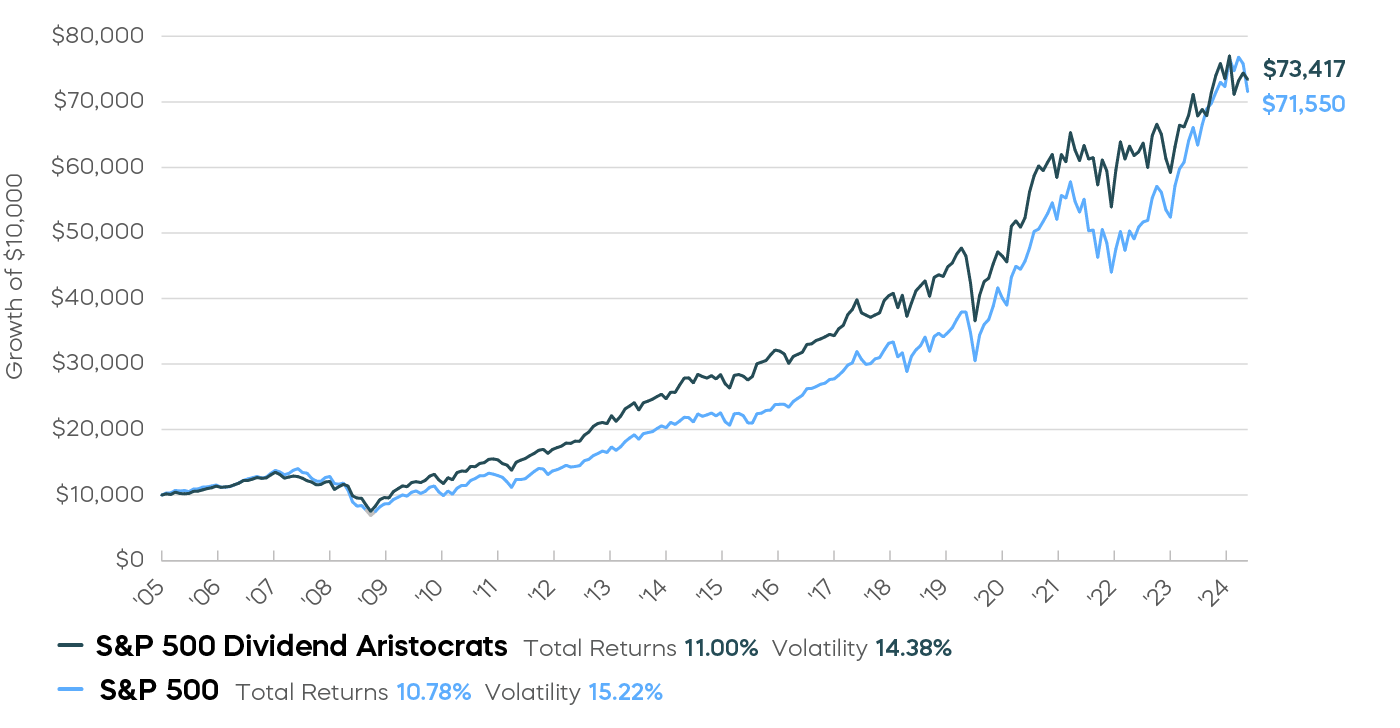
Sources: ProShares, S&P Dow Jones Indices, Bloomberg, Morningstar, Kiplinger, "The Long-Term Allure of Dividends," May 2019. NOBL performance from 10/9/13 (inception) to 3/31/25: NAV 2.83% one-year, 14.52% five-year, 9.66% ten-year, 10.76% since inception; Market Price 2.90% one-year, 14.52% fiveyear, 9.65% ten-year, 10.77% since inception. NOBL’s total operating expenses are 0.35%. Performance quoted represents past performance and does not guarantee future results. Investment return and principal value will fluctuate so that an investor’s shares, when sold or redeemed, may be worth more or less than the original cost. Current performance may be lower or higher than the performance quoted. Performance data current to the most recent month-end may be obtained at ProShares.com.
Consistent Dividend Growers Have Captured More of the Market’s Gain, with Less of the Loss
One way to evaluate how an investment strategy performs is to look at its up/down capture ratio—how it performs in both rising and falling markets over time. Strategies focused on consistent dividend growth have typically displayed highly favorable up/down capture ratios.
For investors, that means the opportunity to participate in the long-term growth of the markets—but importantly, it also means the potential to retain more value when markets inevitably decline.
Since its inception, the S&P 500 Dividend Aristocrats Index has captured 90% of the market’s gains, while experiencing just 83% of the market’s losses—contributing to the long-term outperformance of the strategy.
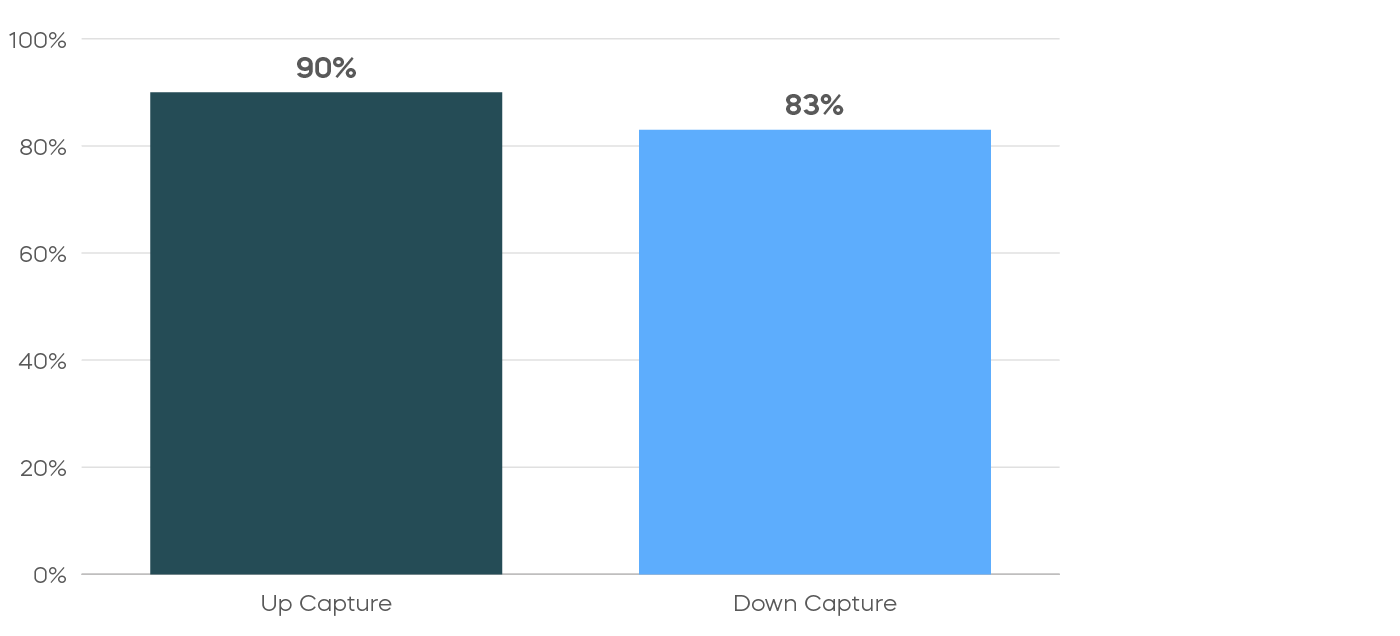
Up capture" measures fund or index performance relative to a benchmark when it has risen. Likewise, “down capture” measures performance when that benchmark has declined. Ratios are calculated by dividing monthly returns for the fund or index by the monthly returns of the benchmark during the stated period and multiplying that factor by 100.
ProShares Dividend Growth ETFs
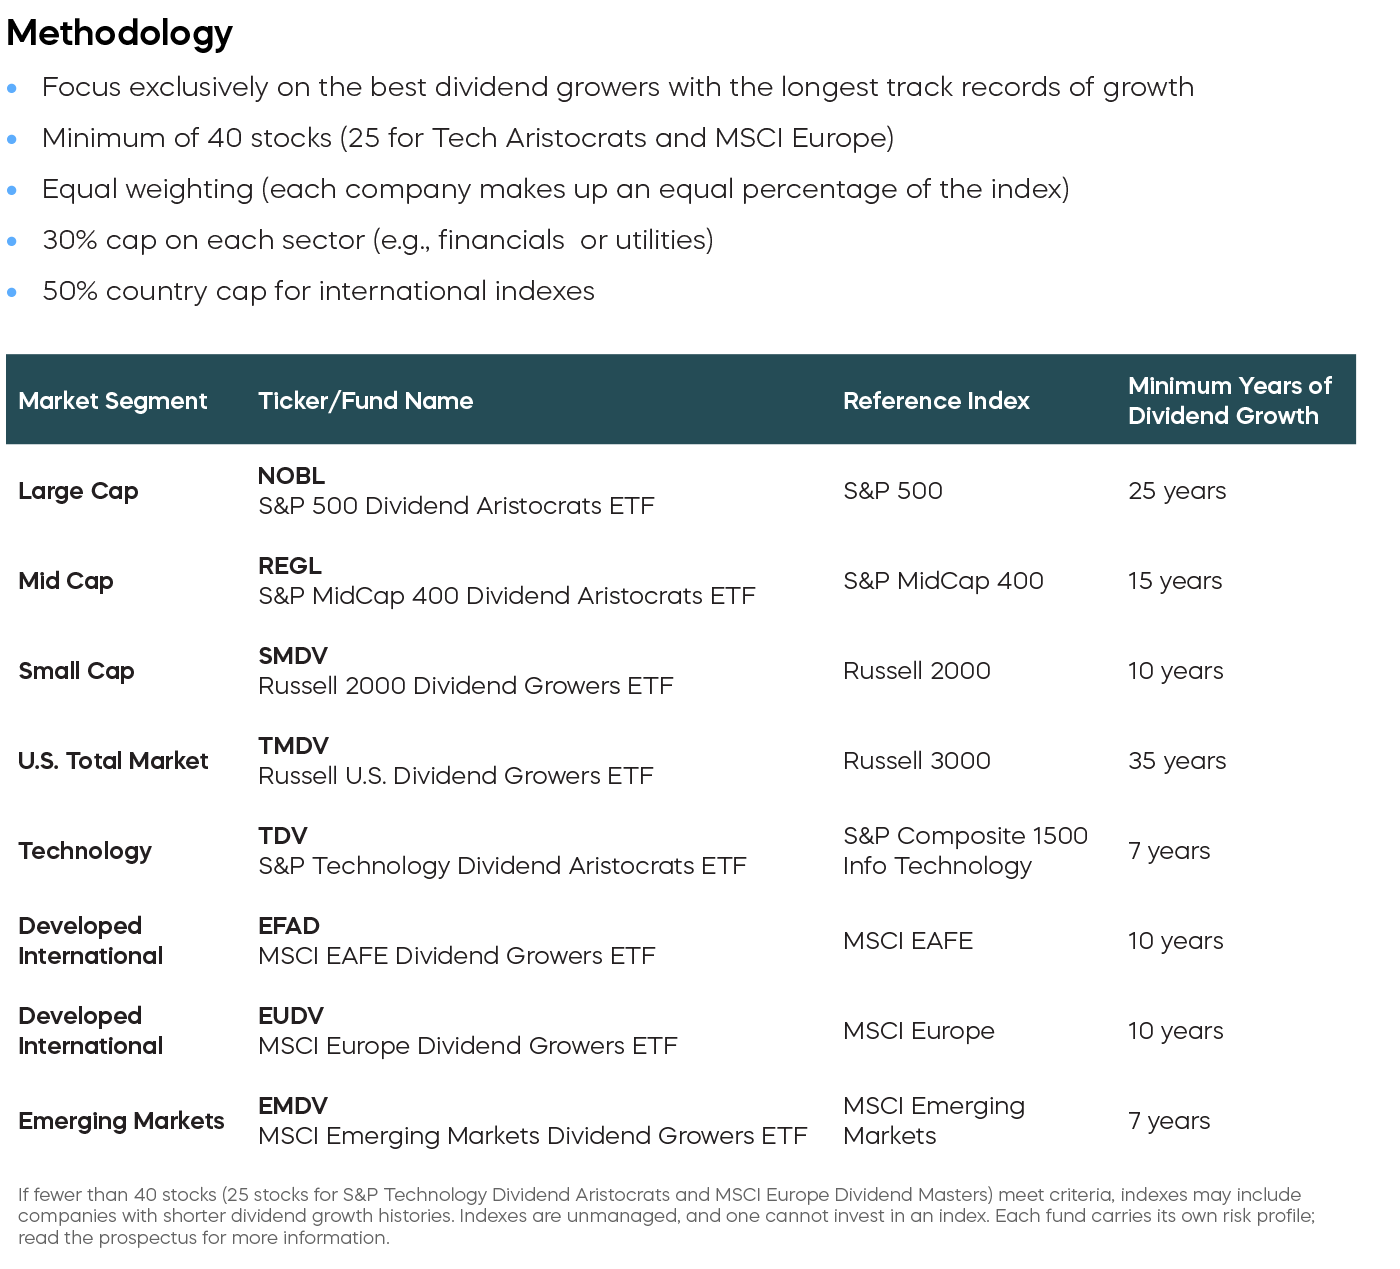
Strategies focused on companies with the longest records of consistent dividend growth can help investors build durable portfolios that may perform well in both strong and turbulent markets. And ProShares offers more dividend growth ETFs than any other company.*
Our flagship fund, NOBL, is the only ETF that invests exclusively in the high-quality names of the S&P 500 Dividend Aristocrats Index. NOBL is the crown jewel in ProShares’ royal family of ETFs designed to enable diverse dividend growth allocations across an array of geographies and market segments.
More Than Just Consistent—the Best Dividend Growers
Not all dividend growth strategies are equal—our funds invest in the best dividend growers, companies with the longest track records of dividend growth in their market segments. Other self-described “dividend growth” strategies don’t require any record of dividend growth from the companies they invest in. ProShares Dividend Growth ETFs and the indexes they follow, however, set a high standard for consistency. For example, just 69 companies in the S&P 500—only 13%—currently meet the requirements of the S&P 500 Dividend Aristocrats Index. Many of them are household names recognized all over the world for their quality characteristics, investment potential and staying power.
Not only are these companies rare, but their commitment to consistent dividend growth is remarkable. Among the S&P 500 Dividend Aristocrats, more than half of its companies have over 40 consecutive years of dividend growth, and 20+ have grown their dividends for more than half a century.
*Source: Morningstar. Data as of 3/31/2025. “Dividend Growth ETF” refers to an exchange-traded fund that tracks an index of companies with aconsecutively increasing dividend payments.
About ProShares
ProShares has been at the forefront of the ETF revolution since 2006. ProShares now offers one of the largest lineups of ETFs, with more than $70 billion in assets. The company is the leader in strategies such as crypto-linked, dividend growth, interest rate hedged bond and geared (leveraged and inverse) ETF investing. ProShares continues to innovate with products that provide strategic and tactical opportunities for investors to manage risk and enhance returns.