


Key Observations

While long-term interest rates have been trending higher driven by a combination of persistent inflation, Fed uncertainty and geopolitical conflict, earnings growth this year has been very strong. If the trend continues, earnings could continue to help equity markets outpace rising interest rate and inflation risks.
Earnings have been very strong in 2026
Bond watchers took notice in July when the 10-year Treasury yield rose by more than 25 basis points.[1] Although debate often centers on the federal funds rate, longer-term yields typically matter more for equities. The bond market’s response to the Fed’s latest decision to hold rates steady underscored that, without quantitative easing, market forces are a greater determining factor of long-term rates.
For bonds with fixed coupons, when yields rise prices fall. For stocks (in isolation from other factors) rising interest rates typically apply downward pressure, as higher rates decrease the value of future earnings.
Unlike a bond, however, a stock’s earnings are not fixed. They generally grow over time, which is why many investors consider stocks to be the quintessential hedge against inflation and rising interest rates. The outlook for stocks when rates rise largely depends on whether their earnings can grow enough to offset the impact of rising interest rates.
For now, earnings momentum seems solid, enough so that worries of a stagflation-era threat like that of the 1970’s, when earnings struggled to keep up with inflation, have receded. By most measures, the story this year has been a positive one. Earnings growth has been outstanding.
Chart of the Month
2026 S&P, Nasdaq and Russell Earnings Growth by Quarter
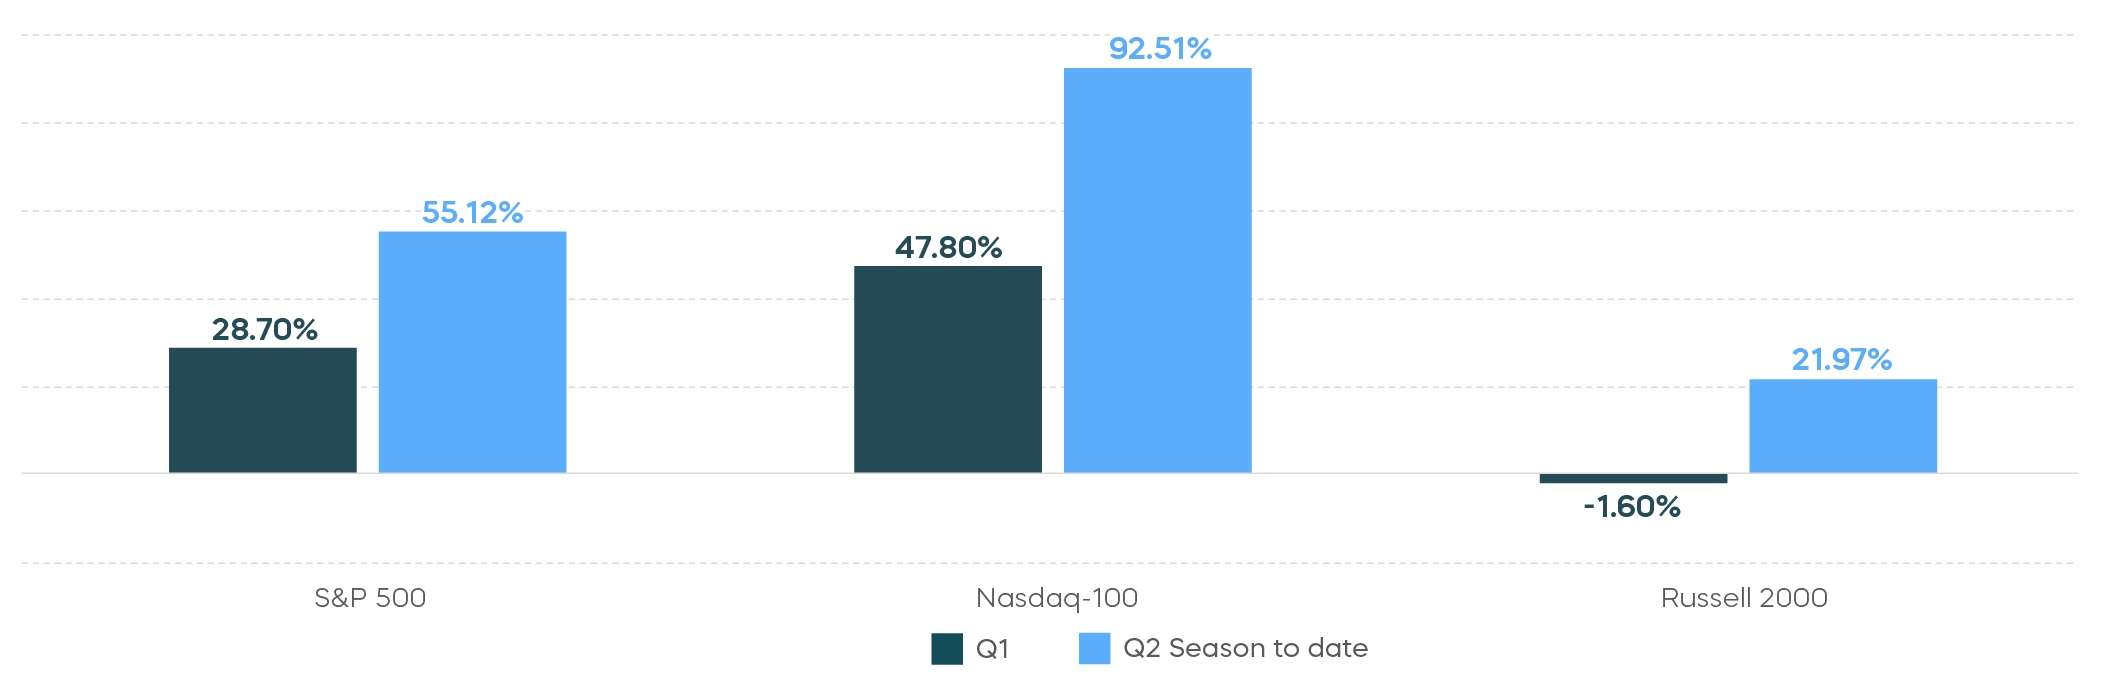
Earnings growth continues to broaden
It would be unwise to assume that earnings growth can continue at this pace forever. Valuation models will start to output “infinity.” But stocks do appear well positioned to offset a period of slightly increasing rates. Supporting this is earnings growth and stock performance that appear to be broadening, with more companies participating. For example:
- While the Magnificent 7 have been roughly flat in 2026, small caps have outperformed large caps.[2]
- The equal weight versions of the S&P 500 and Nasdaq-100 indexes have outperformed their cap-weighted siblings, reflecting broader market participation.[3]
- Nasdaq and S&P 500 earnings have accelerated in the second quarter, as shown in the chart above, and small cap earnings have sharply reversed course from the first to second quarter, suggesting that the broadening of stock performance may continue.
Asset Class Perspectives
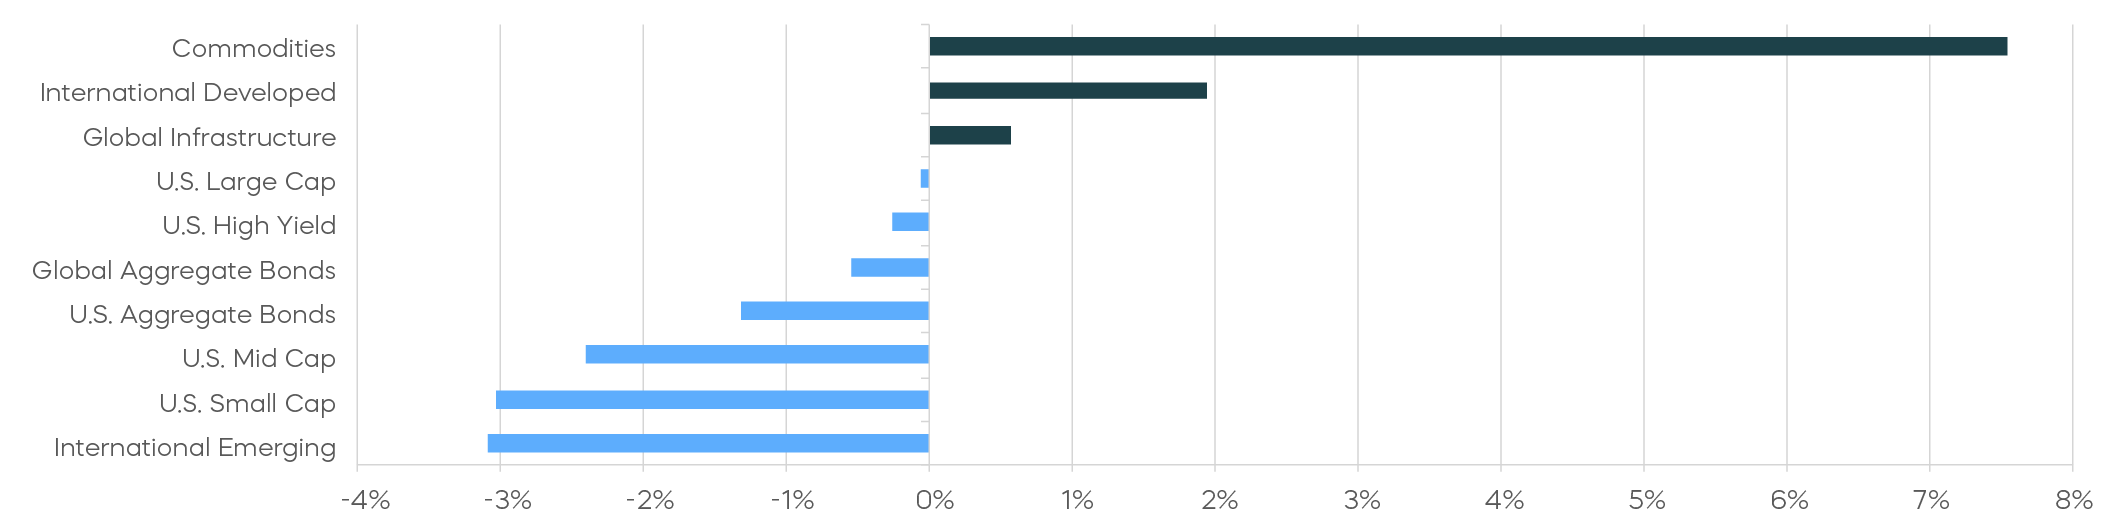
Asset Class Returns—July 2026
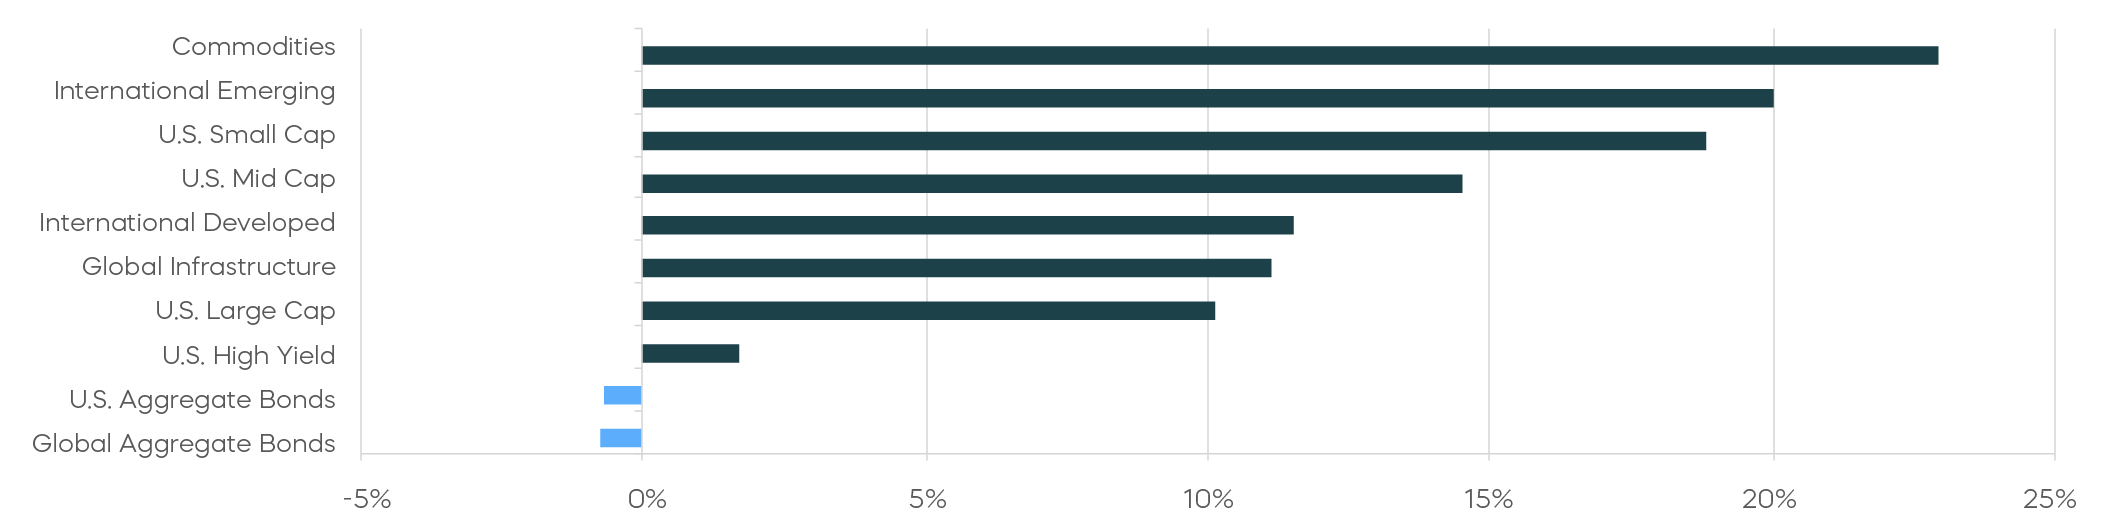
Asset Class Returns—Year-to-date 2026
The following are observations on a range of asset classes. For each, green indicates a constructive backdrop, yellow indicates a neutral environment, and red would indicate a challenging backdrop.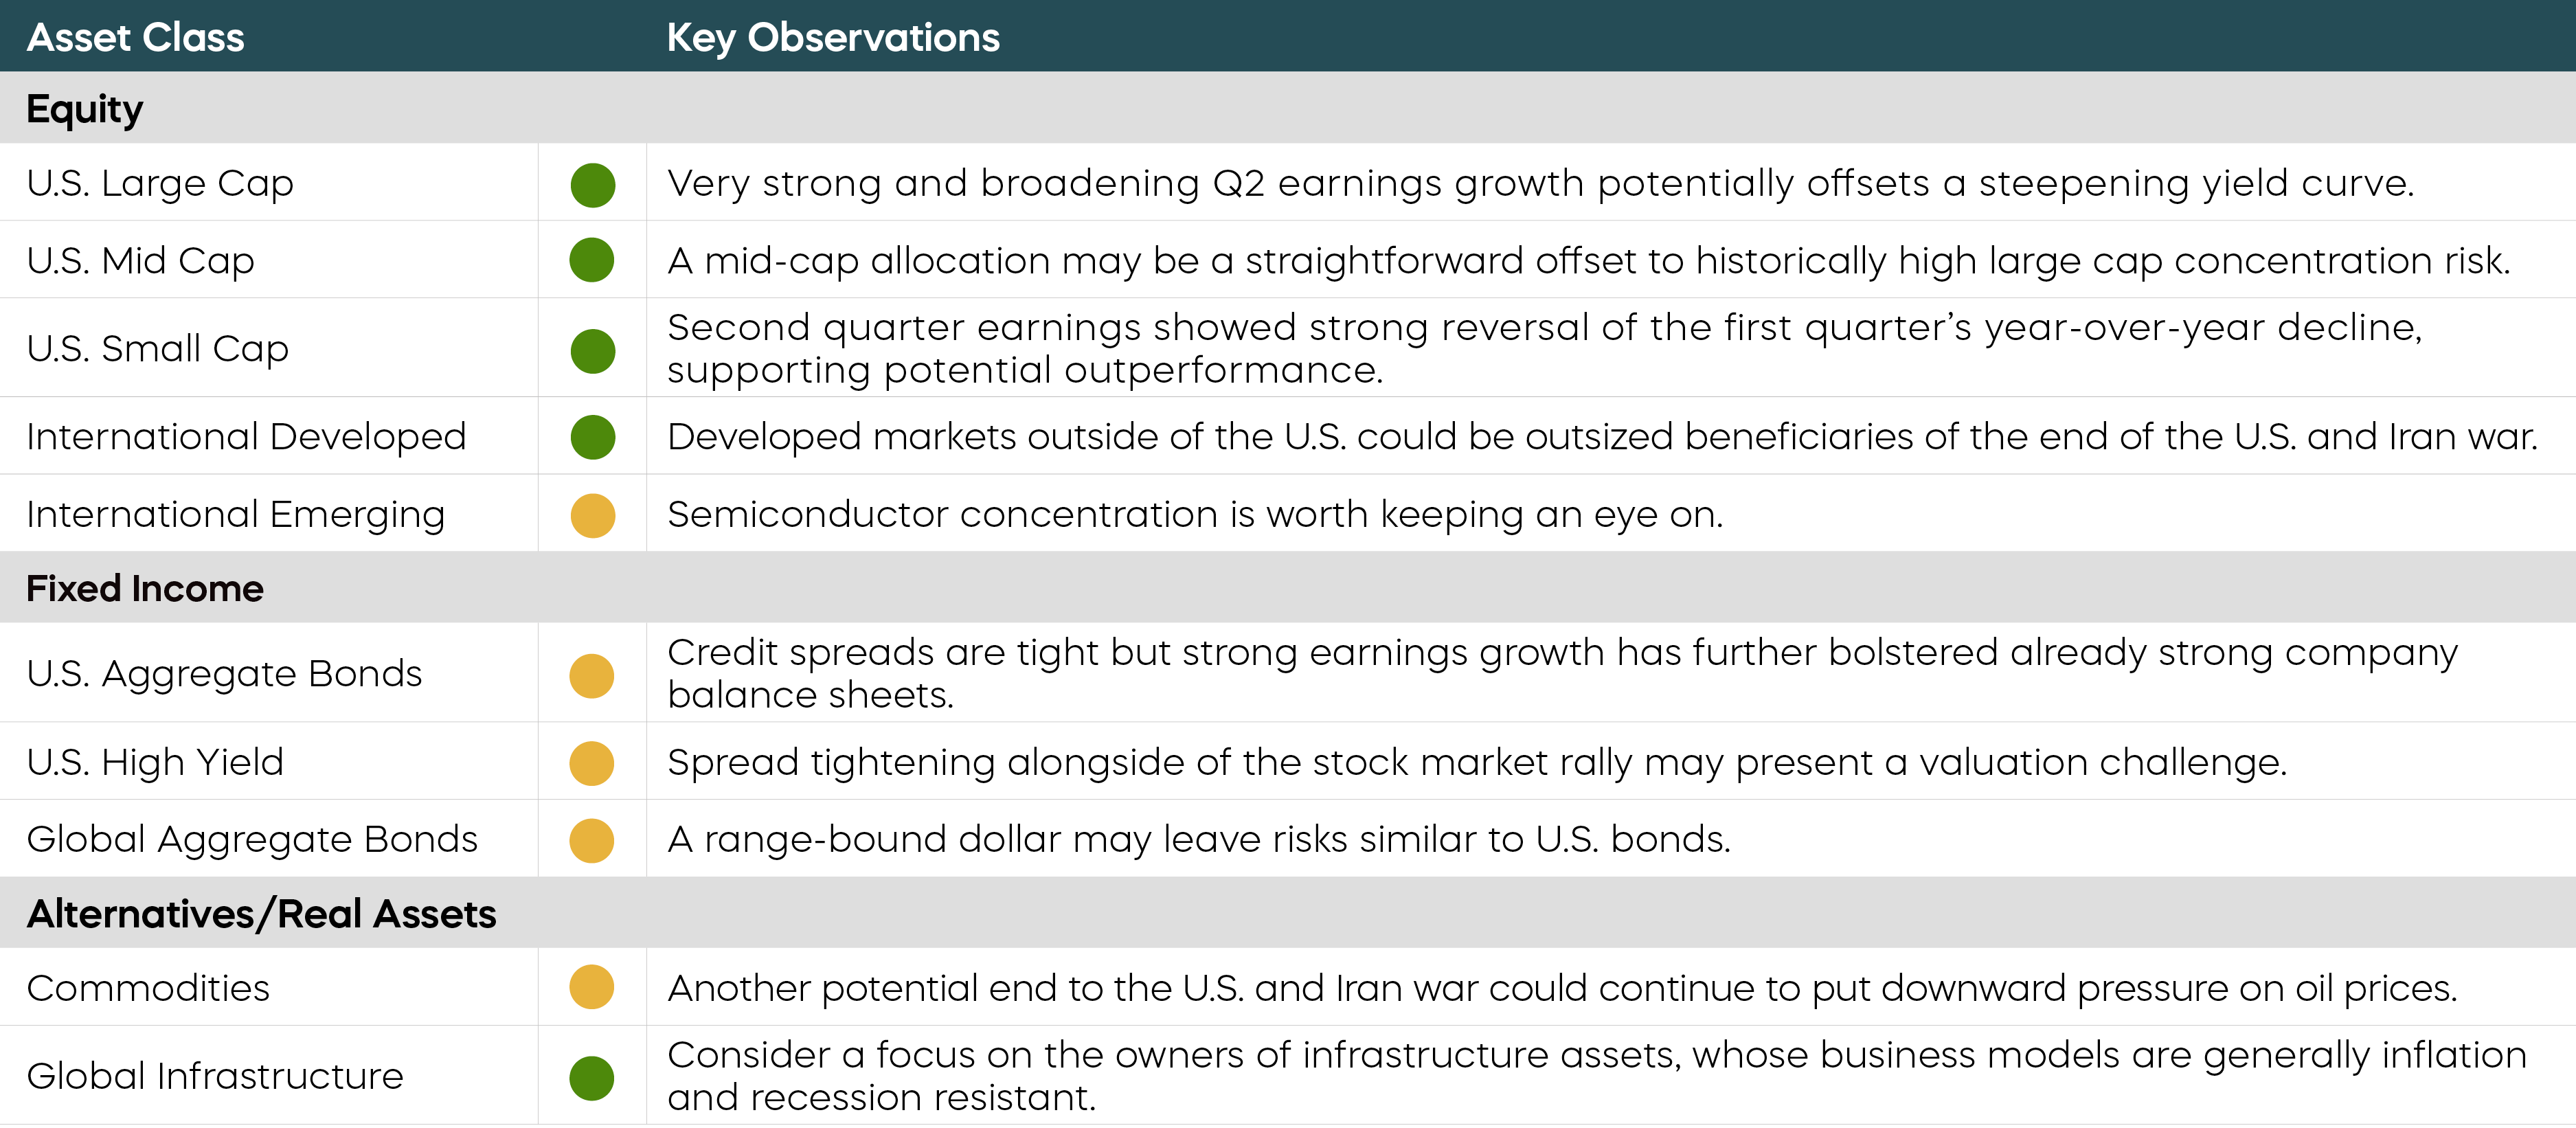
Economic Calendar
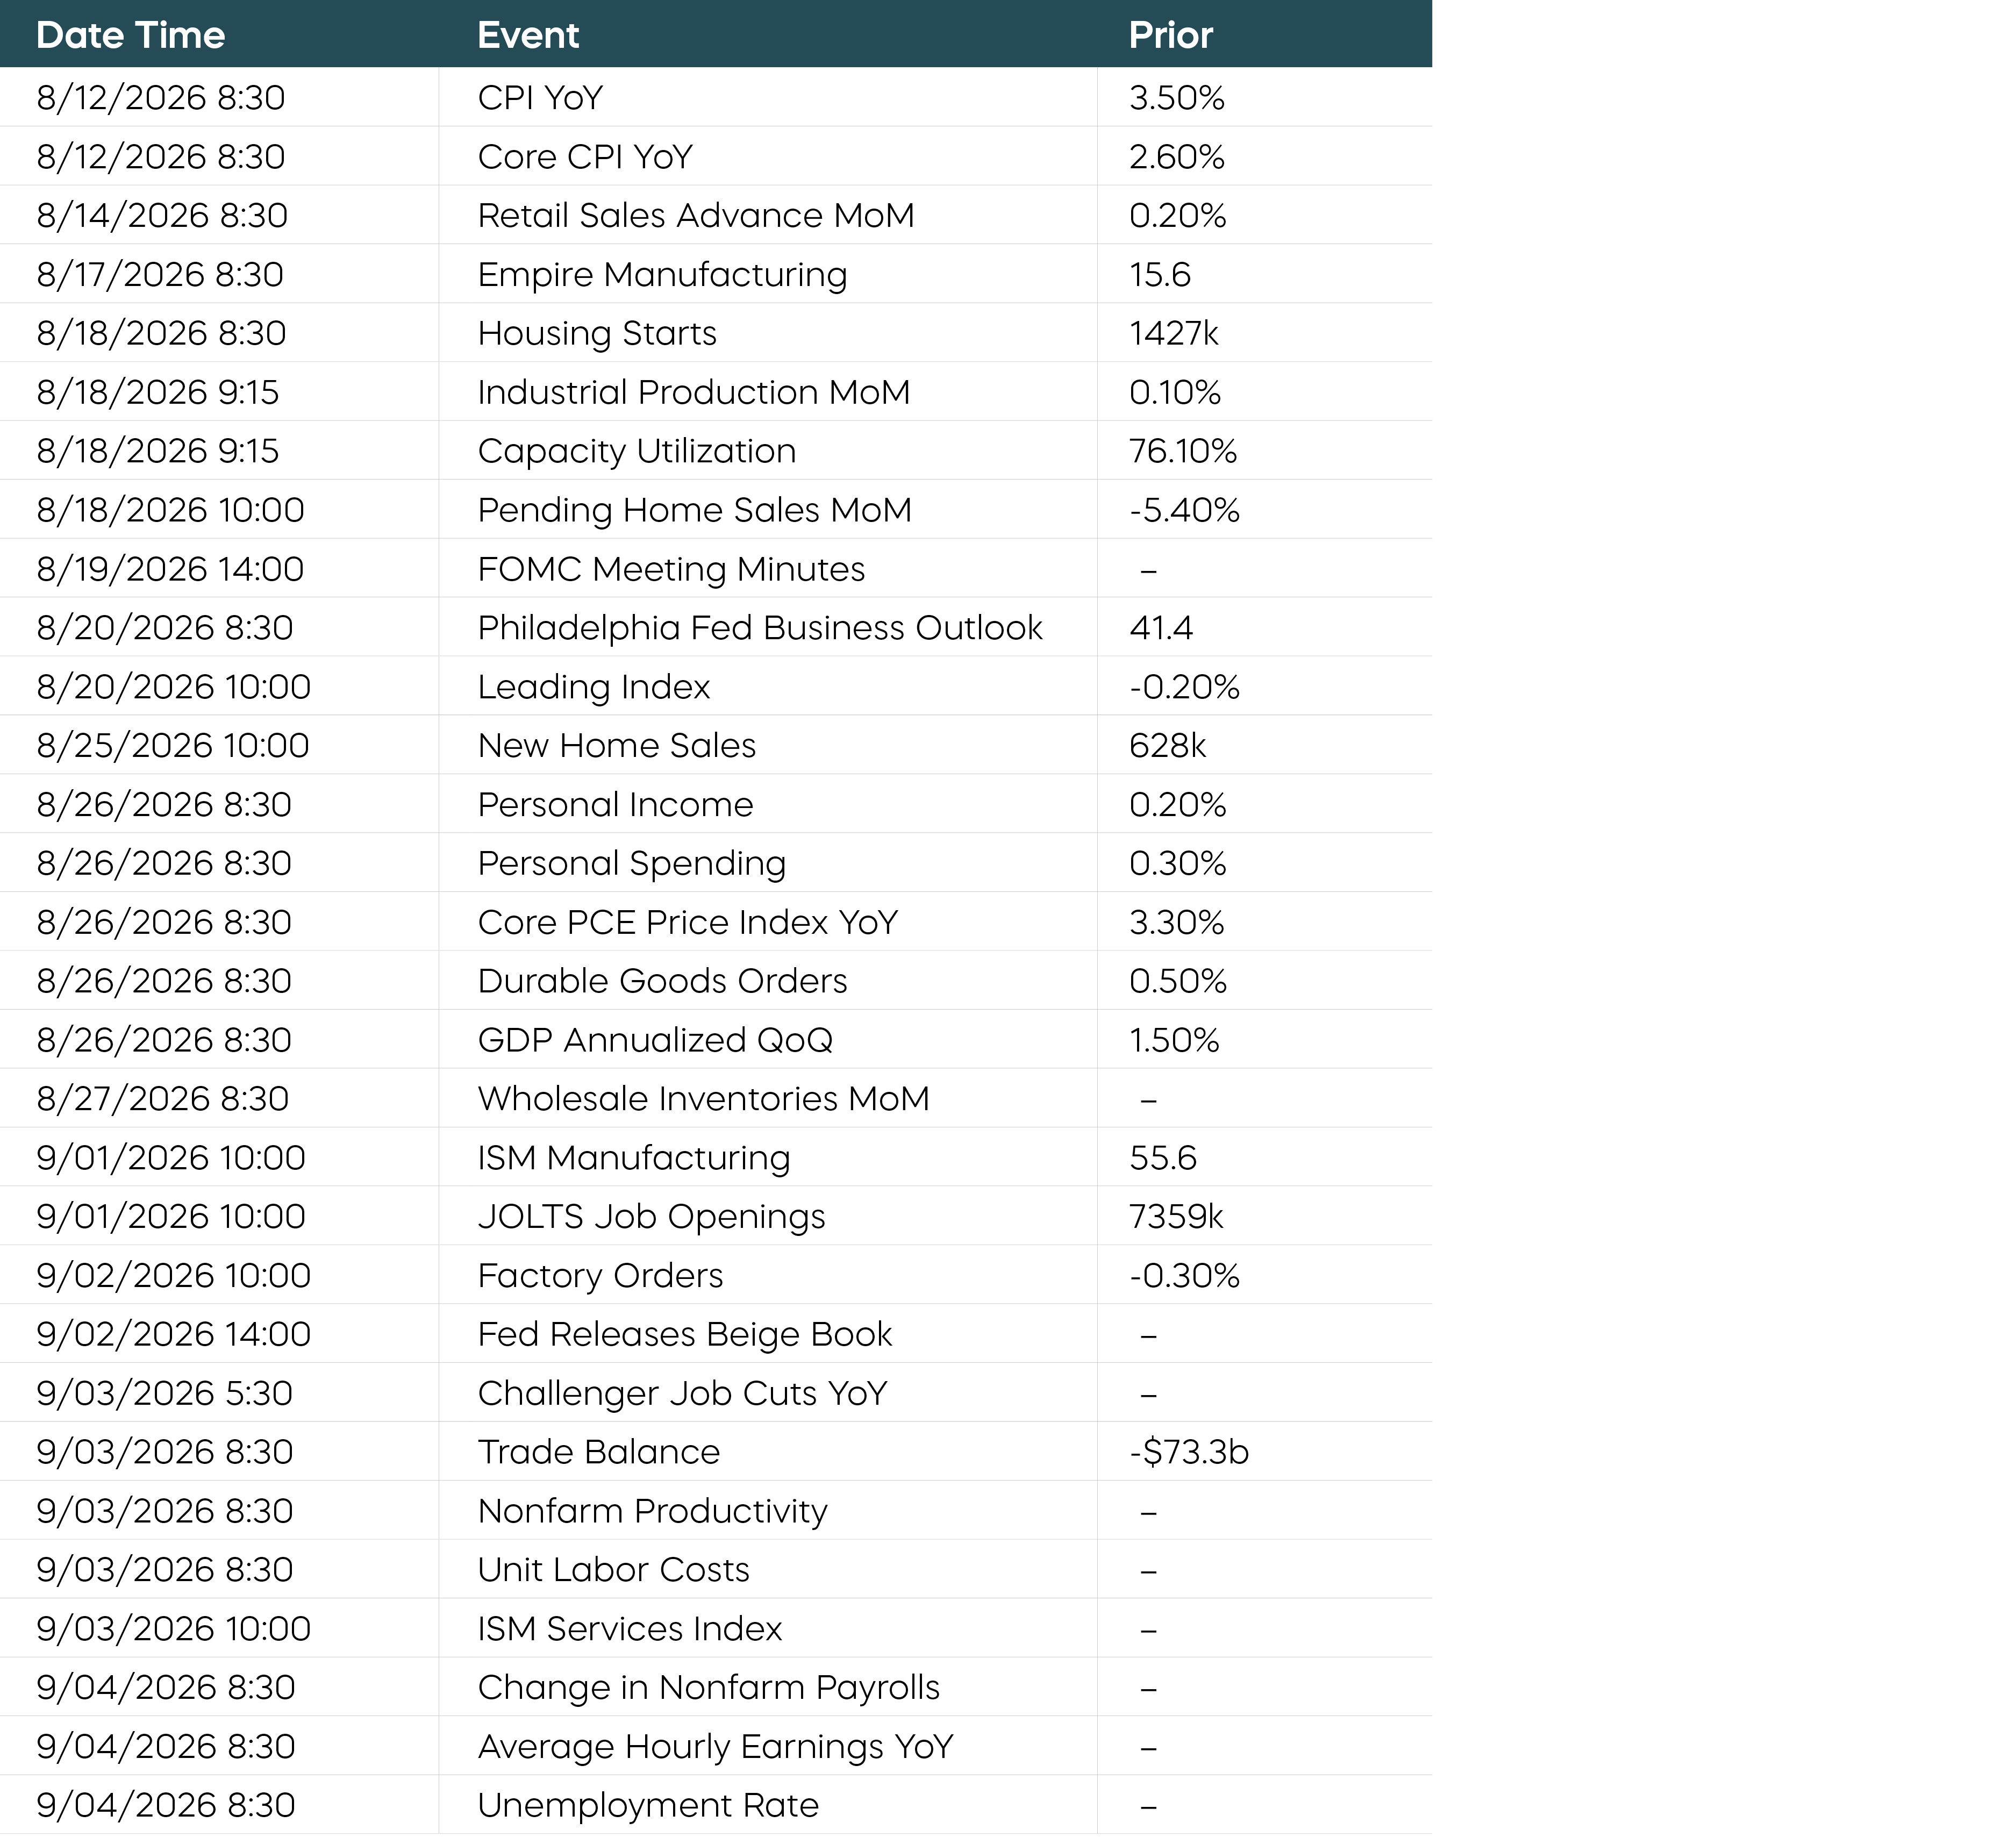
Following is a list of key and upcoming economic releases, which may serve as a guide to potential market indicators.
Equity Perspectives

What's supporting the current market resiliency?
While technology and momentum stocks have wavered, broadening market performance and strong earnings growth through July seem to reflect a bull market that is fundamentally well supported.
Markets were volatile in July, but stocks showed some resilience. Despite a weak showing among technology stocks (the worst performing sector) and a sharp decline in momentum stock performance, the S&P 500 was essentially flat for the month after a strong first half of the year.[4] That the market remained generally resilient without two of what have been its primary drivers seems a healthy sign that the bull market remains fundamentally supported.
Market breadth also continued to improve throughout the month, with more stocks participating in the advance. Per Standard & Poor’s Financials, energy and health care stocks contributed the most to S&P 500 returns for July, helping to offset weakness in semiconductor and AI-related stocks.
As we highlighted, earnings growth has been exceptionally strong this year, even after adjusting for surprises from two prominent Magnificent 7 names. As reported by FactSet, Amazon and Alphabet’s results were aided by hefty one-time investment gains. Earnings releases this quarter have produced some outsized individual stock moves, with strong performers being rewarded and companies that disappoint on profitability or guidance falling sharply lower. However, the earnings bar going forward is high.
We noted in our Mid-Year Outlook that large capital expenditures by the hyperscalers will likely support the AI narrative for the near term. However, while enthusiasm surrounding artificial intelligence investment remains high, the market has become more discerning in rewarding how management teams allocate shareholder capital.
Take, for example, Alphabet’s earnings release after market close on July 22. Despite reporting large top-line and bottom-line beats, GOOGL declined over 7% when trading opened the next day. The likely culprits: the company raised already large cap ex guidance for the remainder of the year, and they reported negative free cash flow for the first time in their history as a public company.
Contrast that with results from IT service provider Cognizant Technology (CTSH) and health care name Abbott Labs (ABT). According to FactSet reporting, both stocks advanced roughly 11% after reporting earnings beats, robust free cash flows, and raising guidance for the remainder of the year. ABT reported they returned over $2 billion to shareholders in the form of dividends and share repurchases, and CTSH returned $1.3 billion for the quarter. Both amounts were large increases over the previous quarter.
How do investors find companies with disciplined capital management?
With spending being scrutinized, today’s market may favor a different class of companies—those with long histories of disciplined capital allocation. Strategies such as the S&P 500 Buyback Aristocrats and the S&P 500 Dividend Aristocrats may be appealing to investors because they have typically demonstrated financial discipline across multiple market cycles, rather than pursuing growth at any cost.
- The S&P 500 Buyback Aristocrats are companies that have consistently bought back shares for at least 10 consecutive years.
- The S&P 500 Dividend Aristocrats are companies that have grown dividends for at least 25 consecutive years.
Companies with these attributes tend to be high-quality, with strong fundamentals typically supported by durable free cash flow generation, strong balance sheets, and management teams with confidence in the long-term prospects of their businesses.
The combination of buybacks and dividend growth represents two complementary expressions of the same philosophy: both reflect shareholder-focused capital allocation. Investors are increasingly rewarding management teams that demonstrate this discipline.
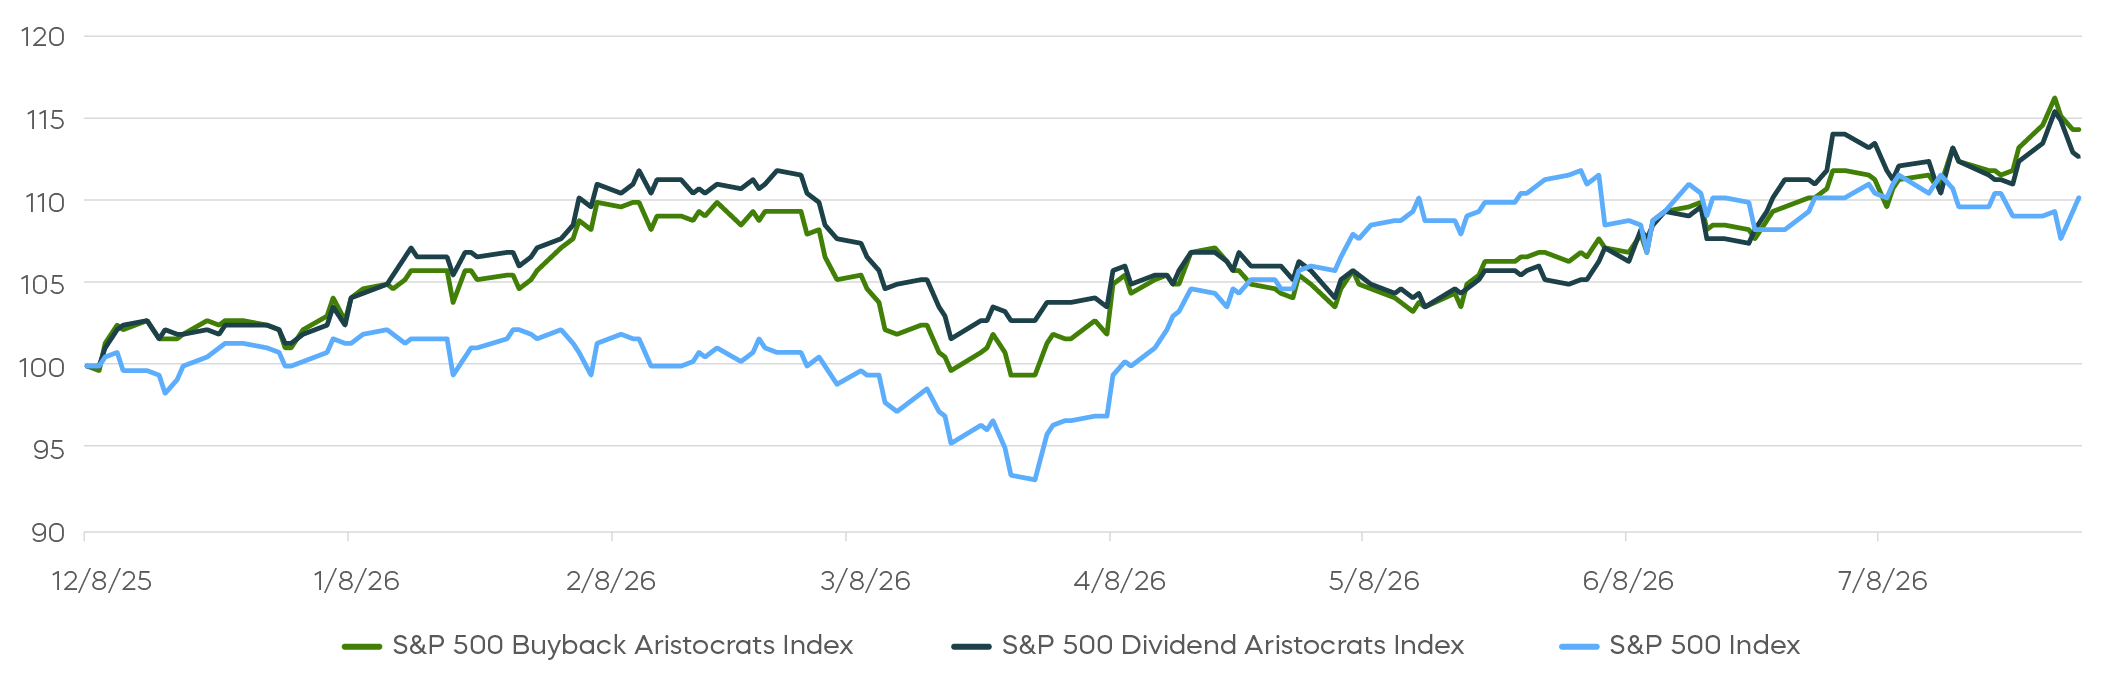
As shown below, since the S&P 500 Buyback Aristocrats Index went live in December of 2025, it has joined the S&P 500 Dividend Aristocrats Index in outperforming the S&P 500.
Companies with Disciplined Capital Management Have Outperformed
Fixed Income Perspectives

How did markets respond to the latest Fed announcement?
Market reaction to the latest FOMC announcement to hold interest rates steady has been unfavorable, despite muted expectations for a rate increase. Yields have risen, the yield curve has steepened, and volatility has increased.
Heading into the July Federal Open Markets Committee meeting, markets had prepared for a possible rate increase given the lack of progress on inflation. Nonetheless, expectations were subdued, with futures pricing roughly a one-in-three chance of a 25-basis point hike. That should have left a relatively low bar for a Fed that ultimately kept rates unchanged. Instead, the market response was decidedly unfavorable.
Since the meeting, both 10-year and 30-year Treasury yields have reached fresh year-to-date highs, the yield curve has steepened, and rate volatility has risen.[5] Market participants and former FOMC officials alike have criticized the Fed’s communication, with many attributing the move to a deterioration in policy credibility.
The potential silver lining is that the magnitude of the market movements has remained contained. The Fed still exerts control over the front end of the yield curve, and Chair Warsh will have many opportunities to clarify the reaction function and repair any damage caused by the July meeting. In addition, we believe the Fed’s position to hold rates steady remains defensible under a data-dependent approach.
At the same time, the somewhat rocky leadership transition has created a tangible risk of higher near-term rate volatility, particularly at the long end of the curve. The uncertainty reflects what Warsh himself has long described as a monetary policy “regime change.” Not only has this transition made the Fed less predictable, but it’s also occurring against a backdrop of strong headline growth and inflation that remains above the Fed’s 2% target.
How could the Fed react to future inflation data?
Warsh has built much of his reputation through sustained criticism of the way the Fed conducted monetary policy. For instance, he has long argued that forward guidance can suppress market signals and ultimately prove counterproductive. That history lends credibility to his effort to eliminate forward guidance. Yet that same history could also leave him boxed into making more abrupt changes to the Fed’s communication framework than markets may be able to absorb.
Warsh has partly justified this more guarded communication style by appointing several task forces now reviewing the Fed’s data, models, and operating framework. In doing so, however, he may have created an ambitious standard for their eventual findings. Markets may now expect these initiatives to produce conclusions significant enough to reshape how monetary policy is conducted. If their findings fail to explain why the Fed kept policy unchanged despite persistent inflation, markets could react adversely again.
Chair Warsh therefore could face a difficult tradeoff. If he is unwilling either to restore some degree of forward guidance or to temper expectations surrounding the task forces, then a sufficiently strong inflation print before year-end could leave a rate hike as the clearest way to demonstrate the Fed’s commitment to price stability. In that scenario, the Fed would effectively cede some control over the timing of policy to the market.
Why has inflation been running above target?
One potential reason inflation progress may have stalled this year and inflation remains persistently above target is the accelerating development and adoption of artificial intelligence. A meaningful share of the resulting inflation pressure may originate on the supply side, which would support the Fed’s decision to remain on hold while it studies these dynamics more extensively.
Meanwhile, the U.S. consumer has continued spending. Our assessment on the K-shaped consumer in our May Commentary produced two main conclusions: consumer income remains healthy compared to history, and a larger share of aggregate spending among wealthy households could support overall consumption, even as lower-income households come under increasing pressure.
A deeper look at consumer health
To further assess consumer health, we need to also look toward wealth distribution. Homeowners and holders of financial assets have experienced substantially stronger wealth gains than less wealthy households, creating another K-shaped divide. However, income distribution does not map neatly onto wealth distribution, in part because retirees make up a large and growing share of the lower-income cohort. These households may report relatively little current income, which could make their discretionary spending more price-sensitive. At the same time, accumulated housing and financial wealth may make them considerably more resilient than their income level suggests.
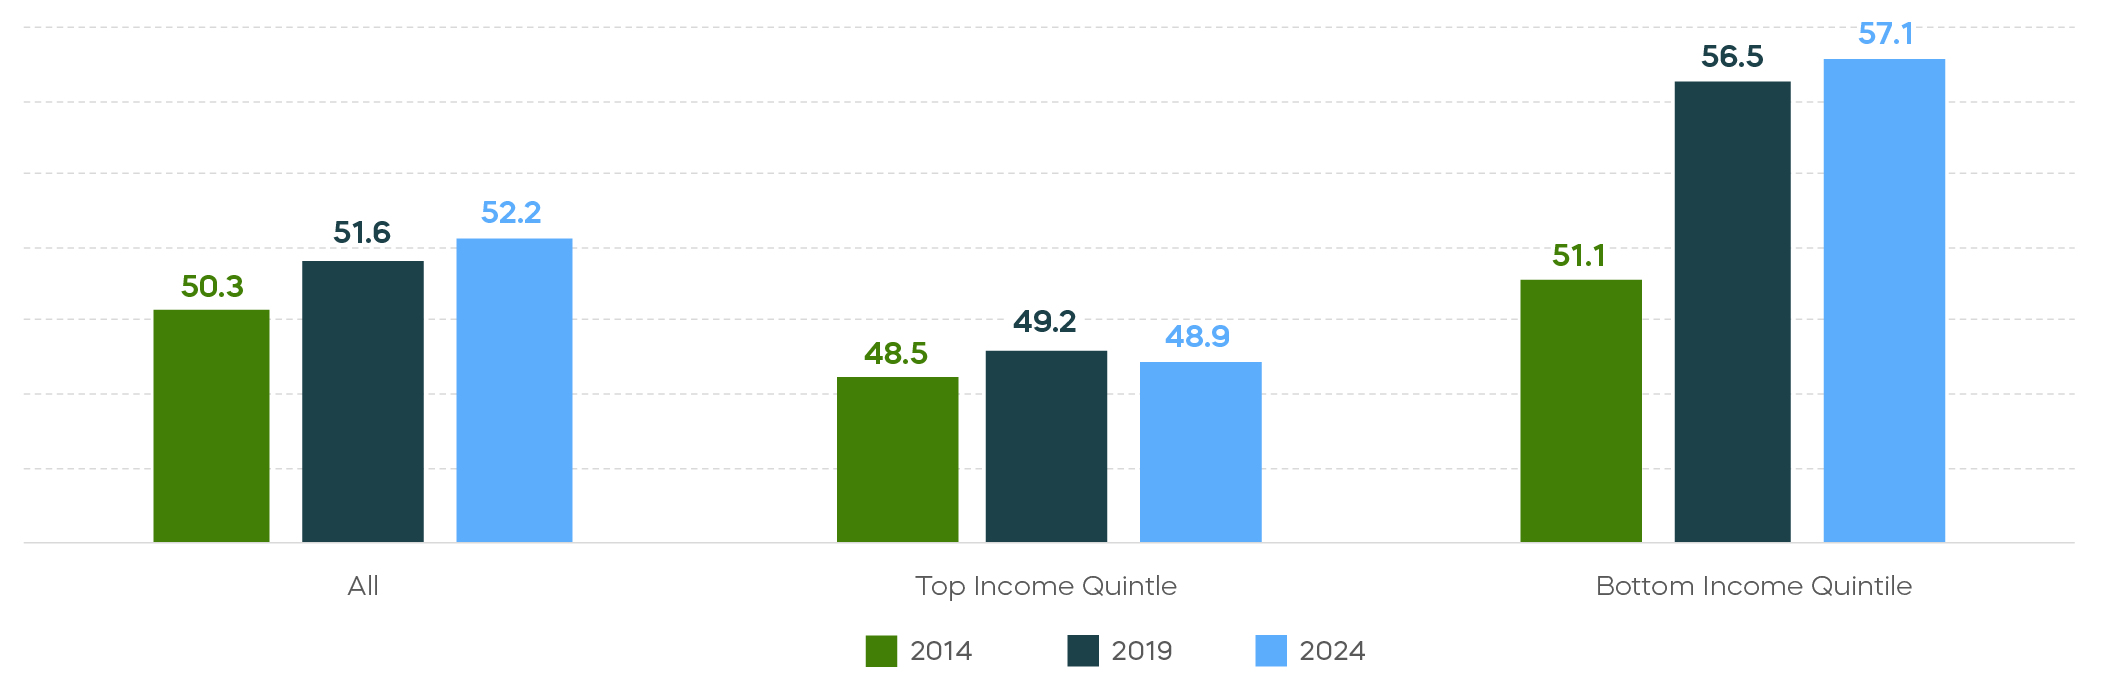
The age of the reference person for the consumer unit (the age of the head of the household) illustrates this shift. Looking at Bureau of Labor Statistics data over the past decade, the reference age in the bottom income quintile has risen from 51 to 57, while the corresponding age in the top quintile has remained broadly unchanged.
Reference Age from Consumer Expenditure Surveys
This demographic shift has important implications for interpreting the condition of lower-income consumers. Homeownership tends to be more prevalent among higher-income households, while lower-income households are generally more likely to rent. This typically makes lower income households more exposed to housing inflation. However, among lower-income households that do own homes, a large majority have paid off their mortgages and hold substantial home equity.
As the retiree share of the bottom income quintile has increased, the proportion of homeowners in that quintile without a mortgage has risen from 66.7% to 72.1% over the past decade. By comparison, only 22.7% of homeowners in the top income quintile are mortgage-free. The imputed rental value of owner-occupied housing alone is estimated to exceed half of pretax income for the bottom quintile. But none of that economic benefit appears in the conventional income measure.
Reported income also excludes potential support from asset withdraws. Lump-sum withdrawals from retirement or other assets are generally not captured as income. A household may therefore appear weak based on annual cash income, while continuing to fund consumption through mortgage-free housing, accumulated savings, or periodic asset withdrawals.
If AI-related investment continues to support economic growth, and household spending remains firm, the Fed may find it increasingly difficult to restore credibility without either moderating some of the institutional changes Warsh has advocated or tightening monetary policy more directly.
[1] Source: Bloomberg. Data as of 8/3/26.
[2] Source: Bloomberg. Data as of 8/3/26.
[3] Source: Bloomberg. Data as of 8/3/26.
[4] Source: Bloomberg. Data as of 7/31/26.
[5] Source: Bloomberg. Data as of 7/31/26.