


Key Observations

Yields on 10-year Treasuries have risen this year after opening near their historical average of about 4%. With core inflation still elevated but holding relatively steady, a rise in real interest rates may be to blame for the increase in Treasury yields.
2026 began with 10-year Treasuries right around 4%, which many viewed as a comfortable place. The comfort came from some simple math—2 plus 2 equals 4. The long-term real yield on the 10-year Treasury was around 2% and the Fed’s inflation target is 2%.
Now, the 10-year Treasury yield is approaching 5%. Why is that?
It’s tempting to blame oil prices and inflation, but the numbers appear to tell a different story. Core CPI sat at 2.6% at the end of 2025, and the latest reading came in at 2.5%.[1] That means the increase in the 10-year Treasury yield must have been driven by an increase in the real yield, rather than accelerating price increases.
Chart of the Month
10-Year Real Treasury Yield: Historical Averages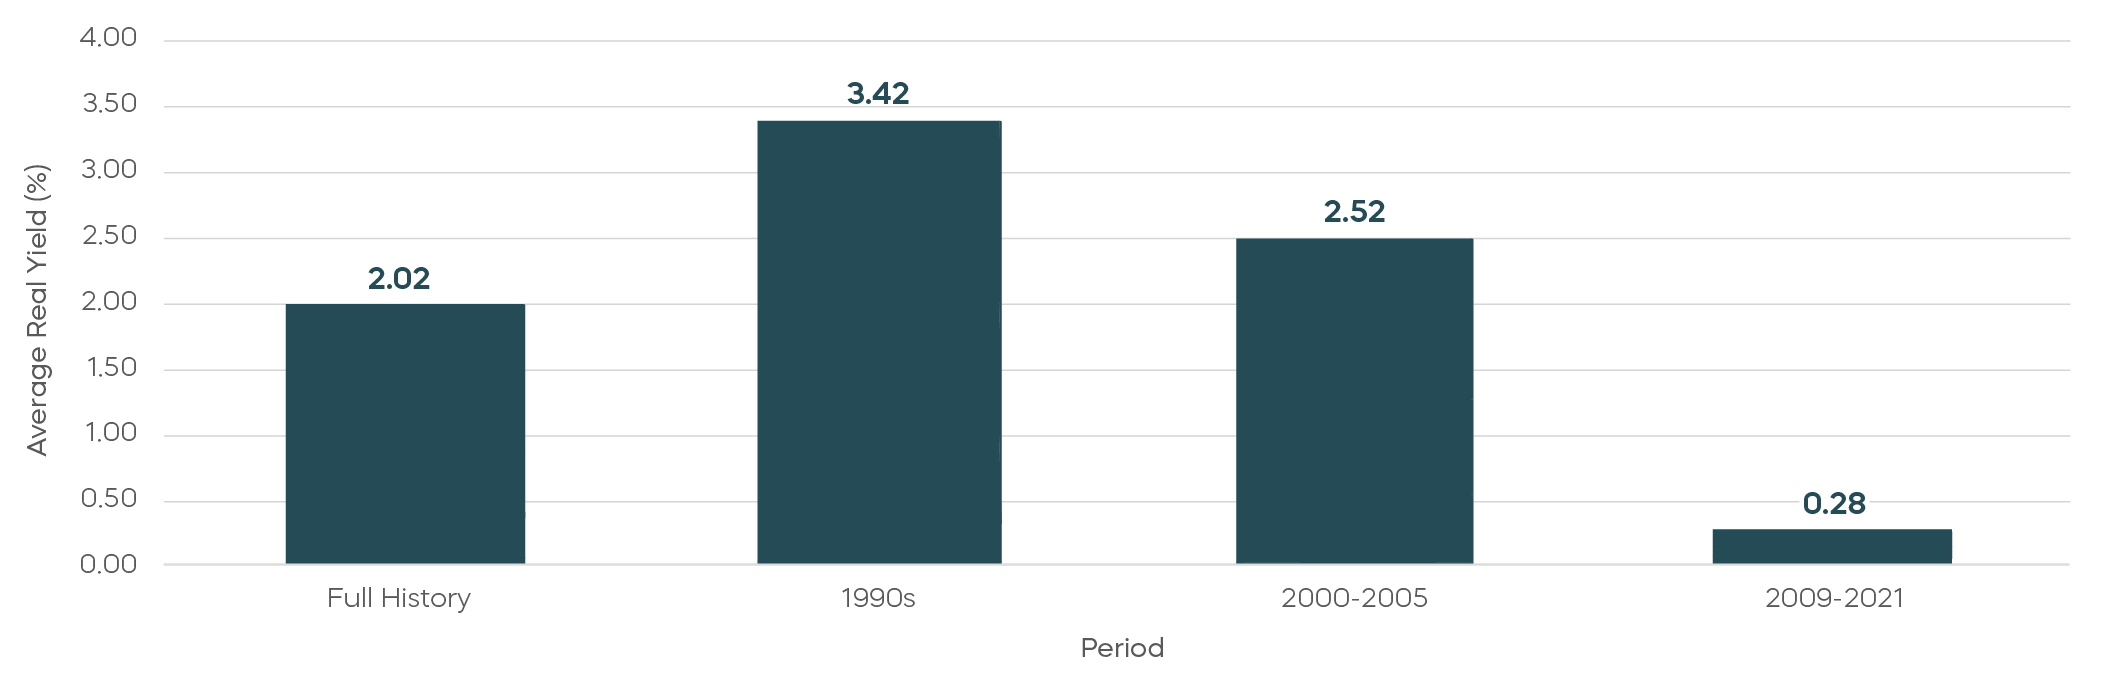
For Treasuries, using long-term averages as a benchmark can be misleading. The average real yield for the 10-year Treasury has been approximately 2%, as you can see from the historical average charted above. But that includes a range of distinct cycles, including the Quantitative Easing period from the Great Financial Crisis through Covid, when the government’s purchasing of long-term bonds to suppress longer-term interest rates did its job by keeping real interest rates near zero.
So then, what is the “right” level for real interest rates today? It’s difficult to predict exactly, but rates were higher throughout the 1990s, and even during the “flight-to-quality” moderation period of the early 2000s, real rates stayed materially above 2%.
The potential for higher real rates for longer may linger; it’s one reason Fed Chair Kevin Warsh’s hawkish Jackson Hole speech and emphatic commitment to 2% inflation didn’t have much impact on longer-term interest rates. That potential may also be part of the reason Secretary Bessent’s August announcement of scaled-up bond buybacks didn’t have much impact either.
But here’s some possibly good news. If a “right” or “regular” level of real interest rates is materially higher than the historical average of 2%, then perhaps current levels (or even modestly higher levels) might not be as much of a headwind to the economy or stocks as many fear.
Asset Class Perspectives
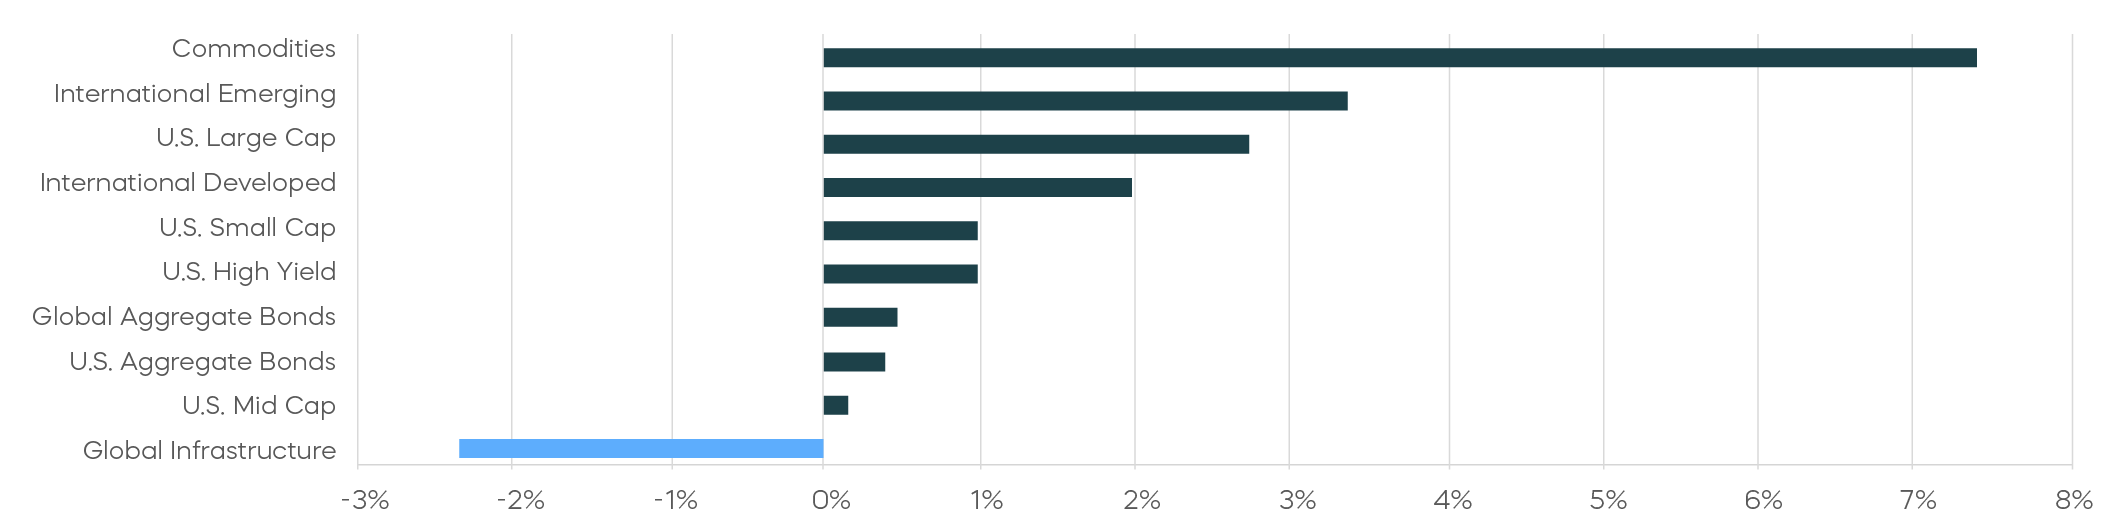
Asset Class Returns—August 2026
Asset Class Returns—Year-to-Date 2026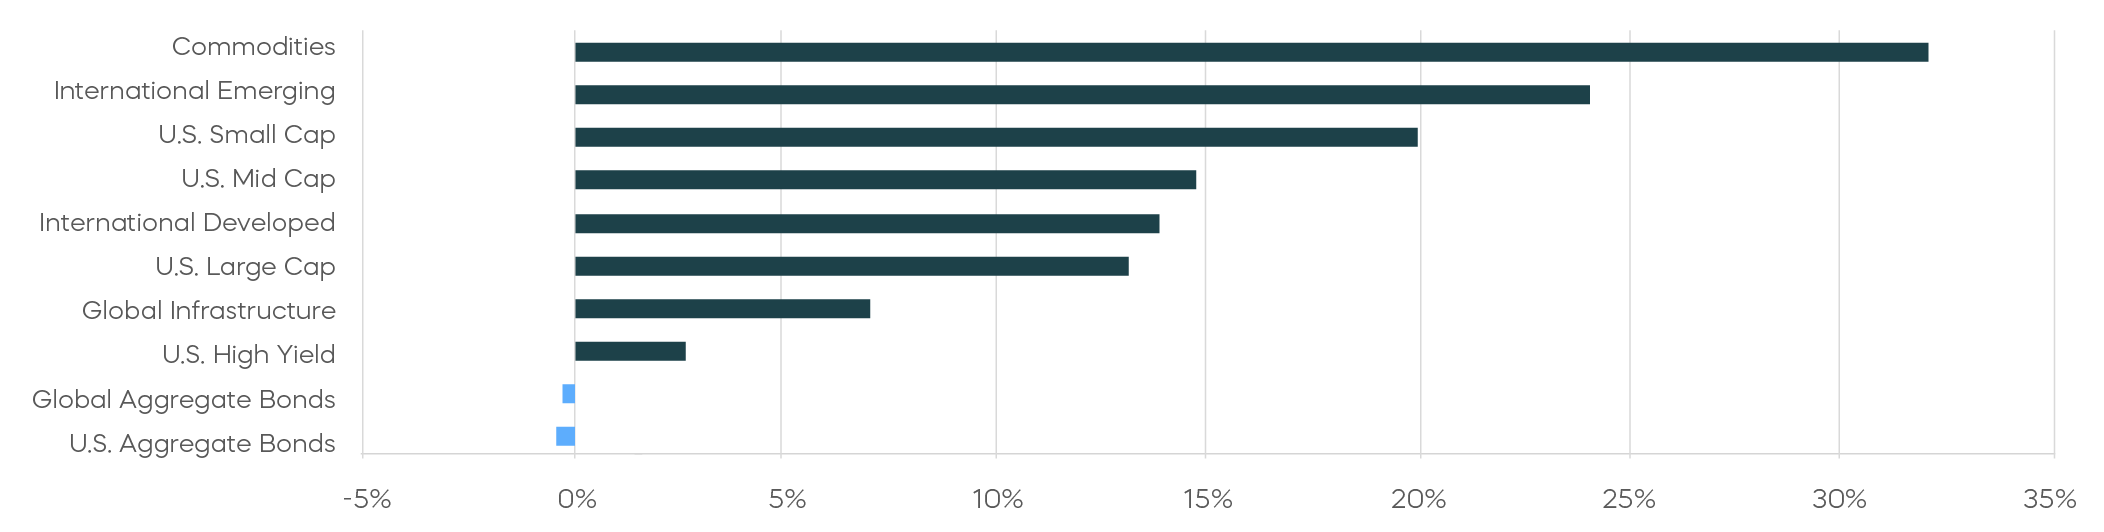
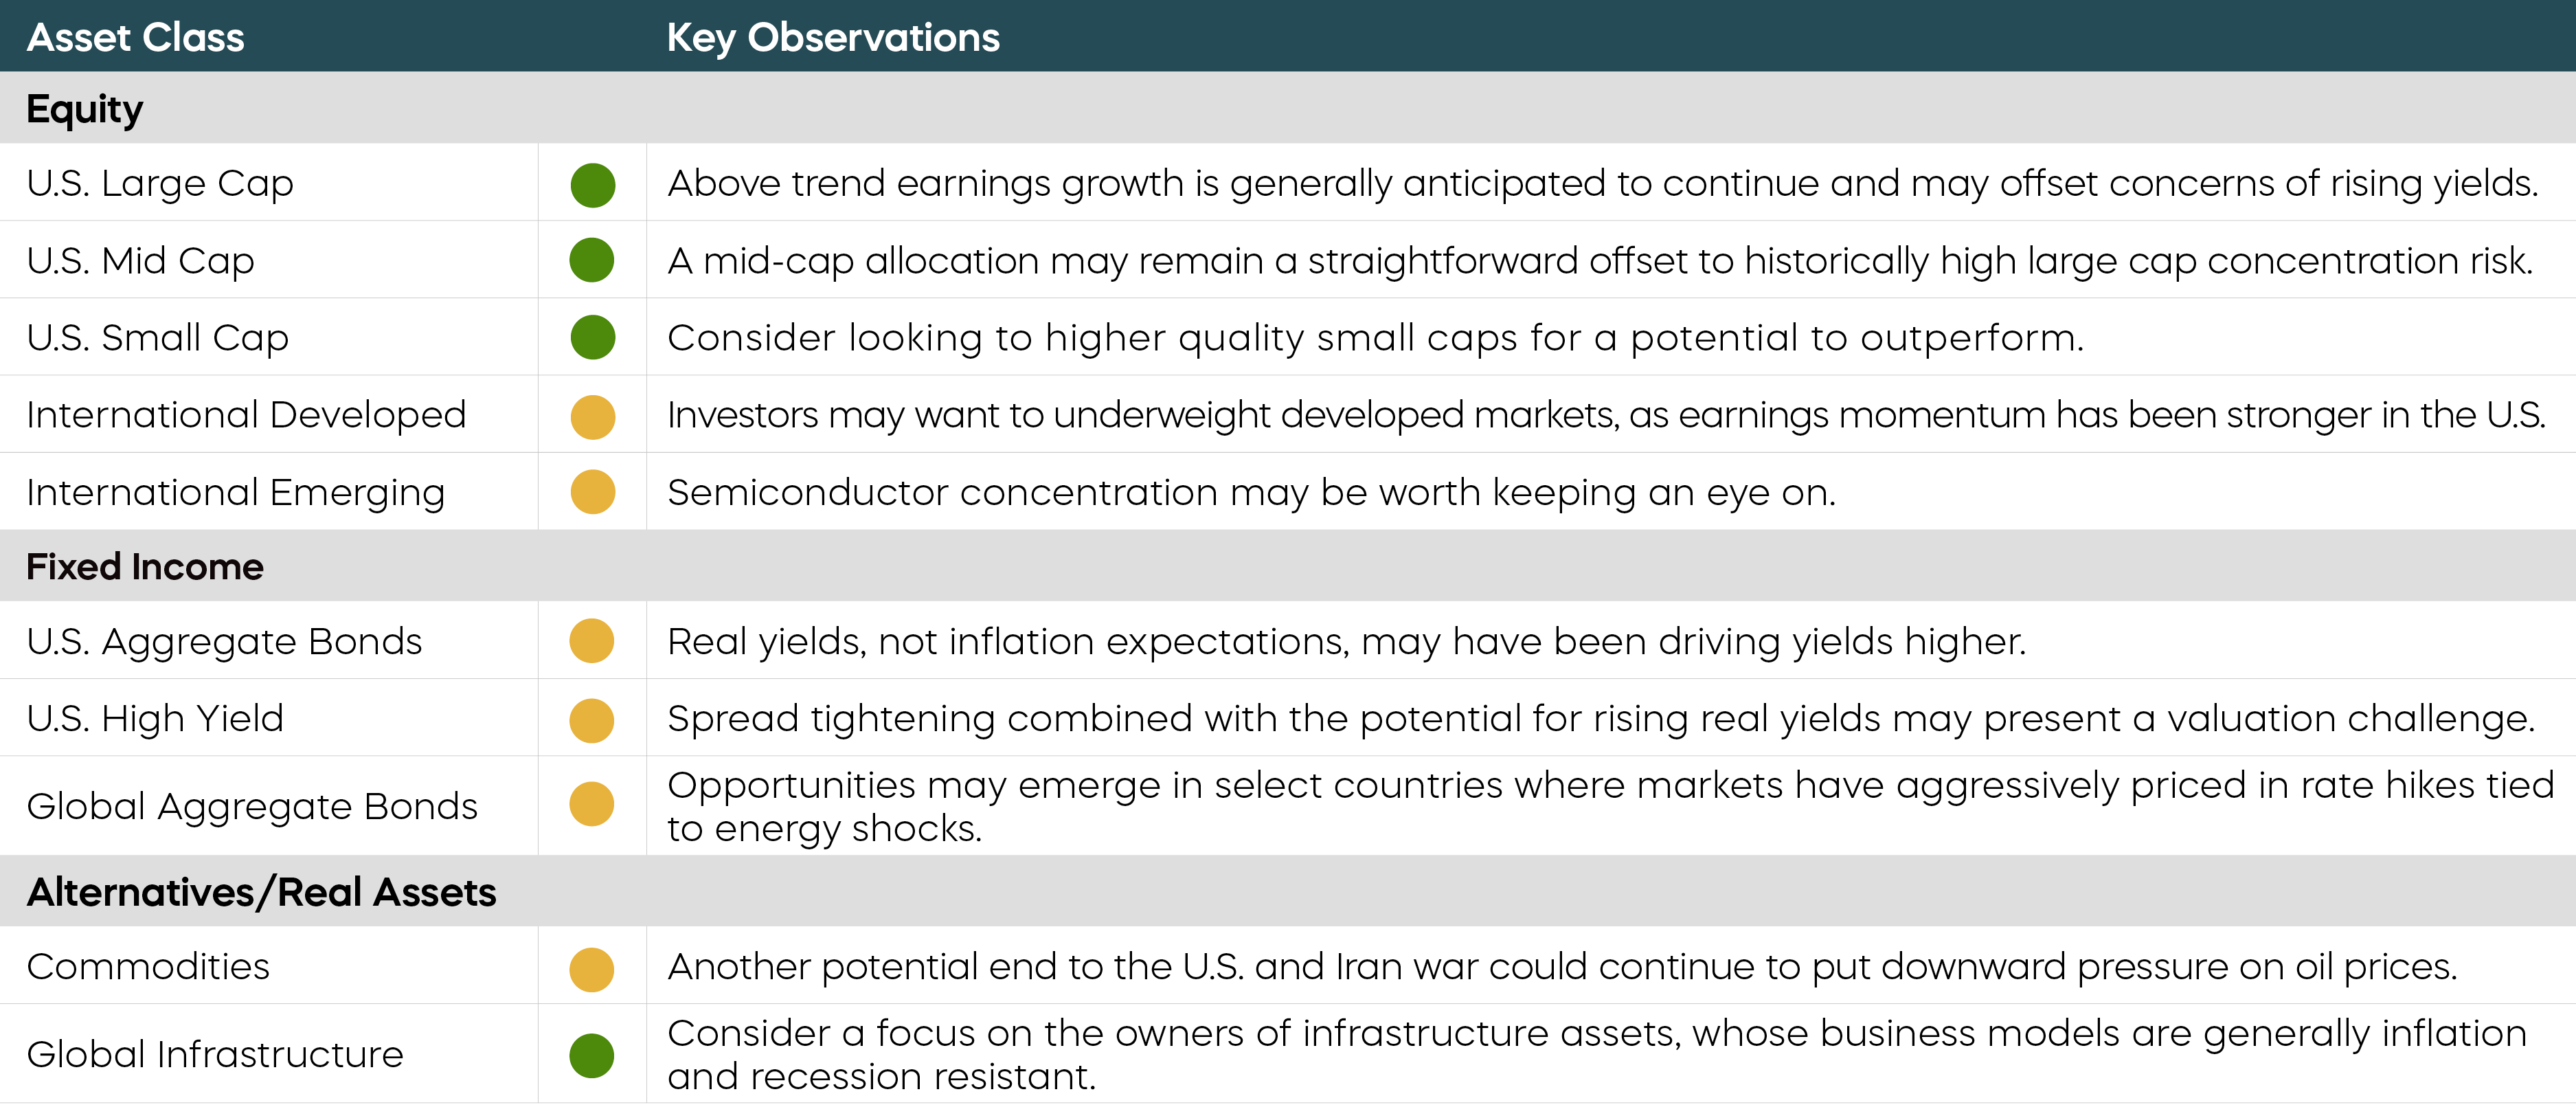
The following are observations on a range of asset classes. For each, green indicates a constructive backdrop, yellow indicates a neutral environment, and red would indicate a challenging backdrop.
Economic Calendar
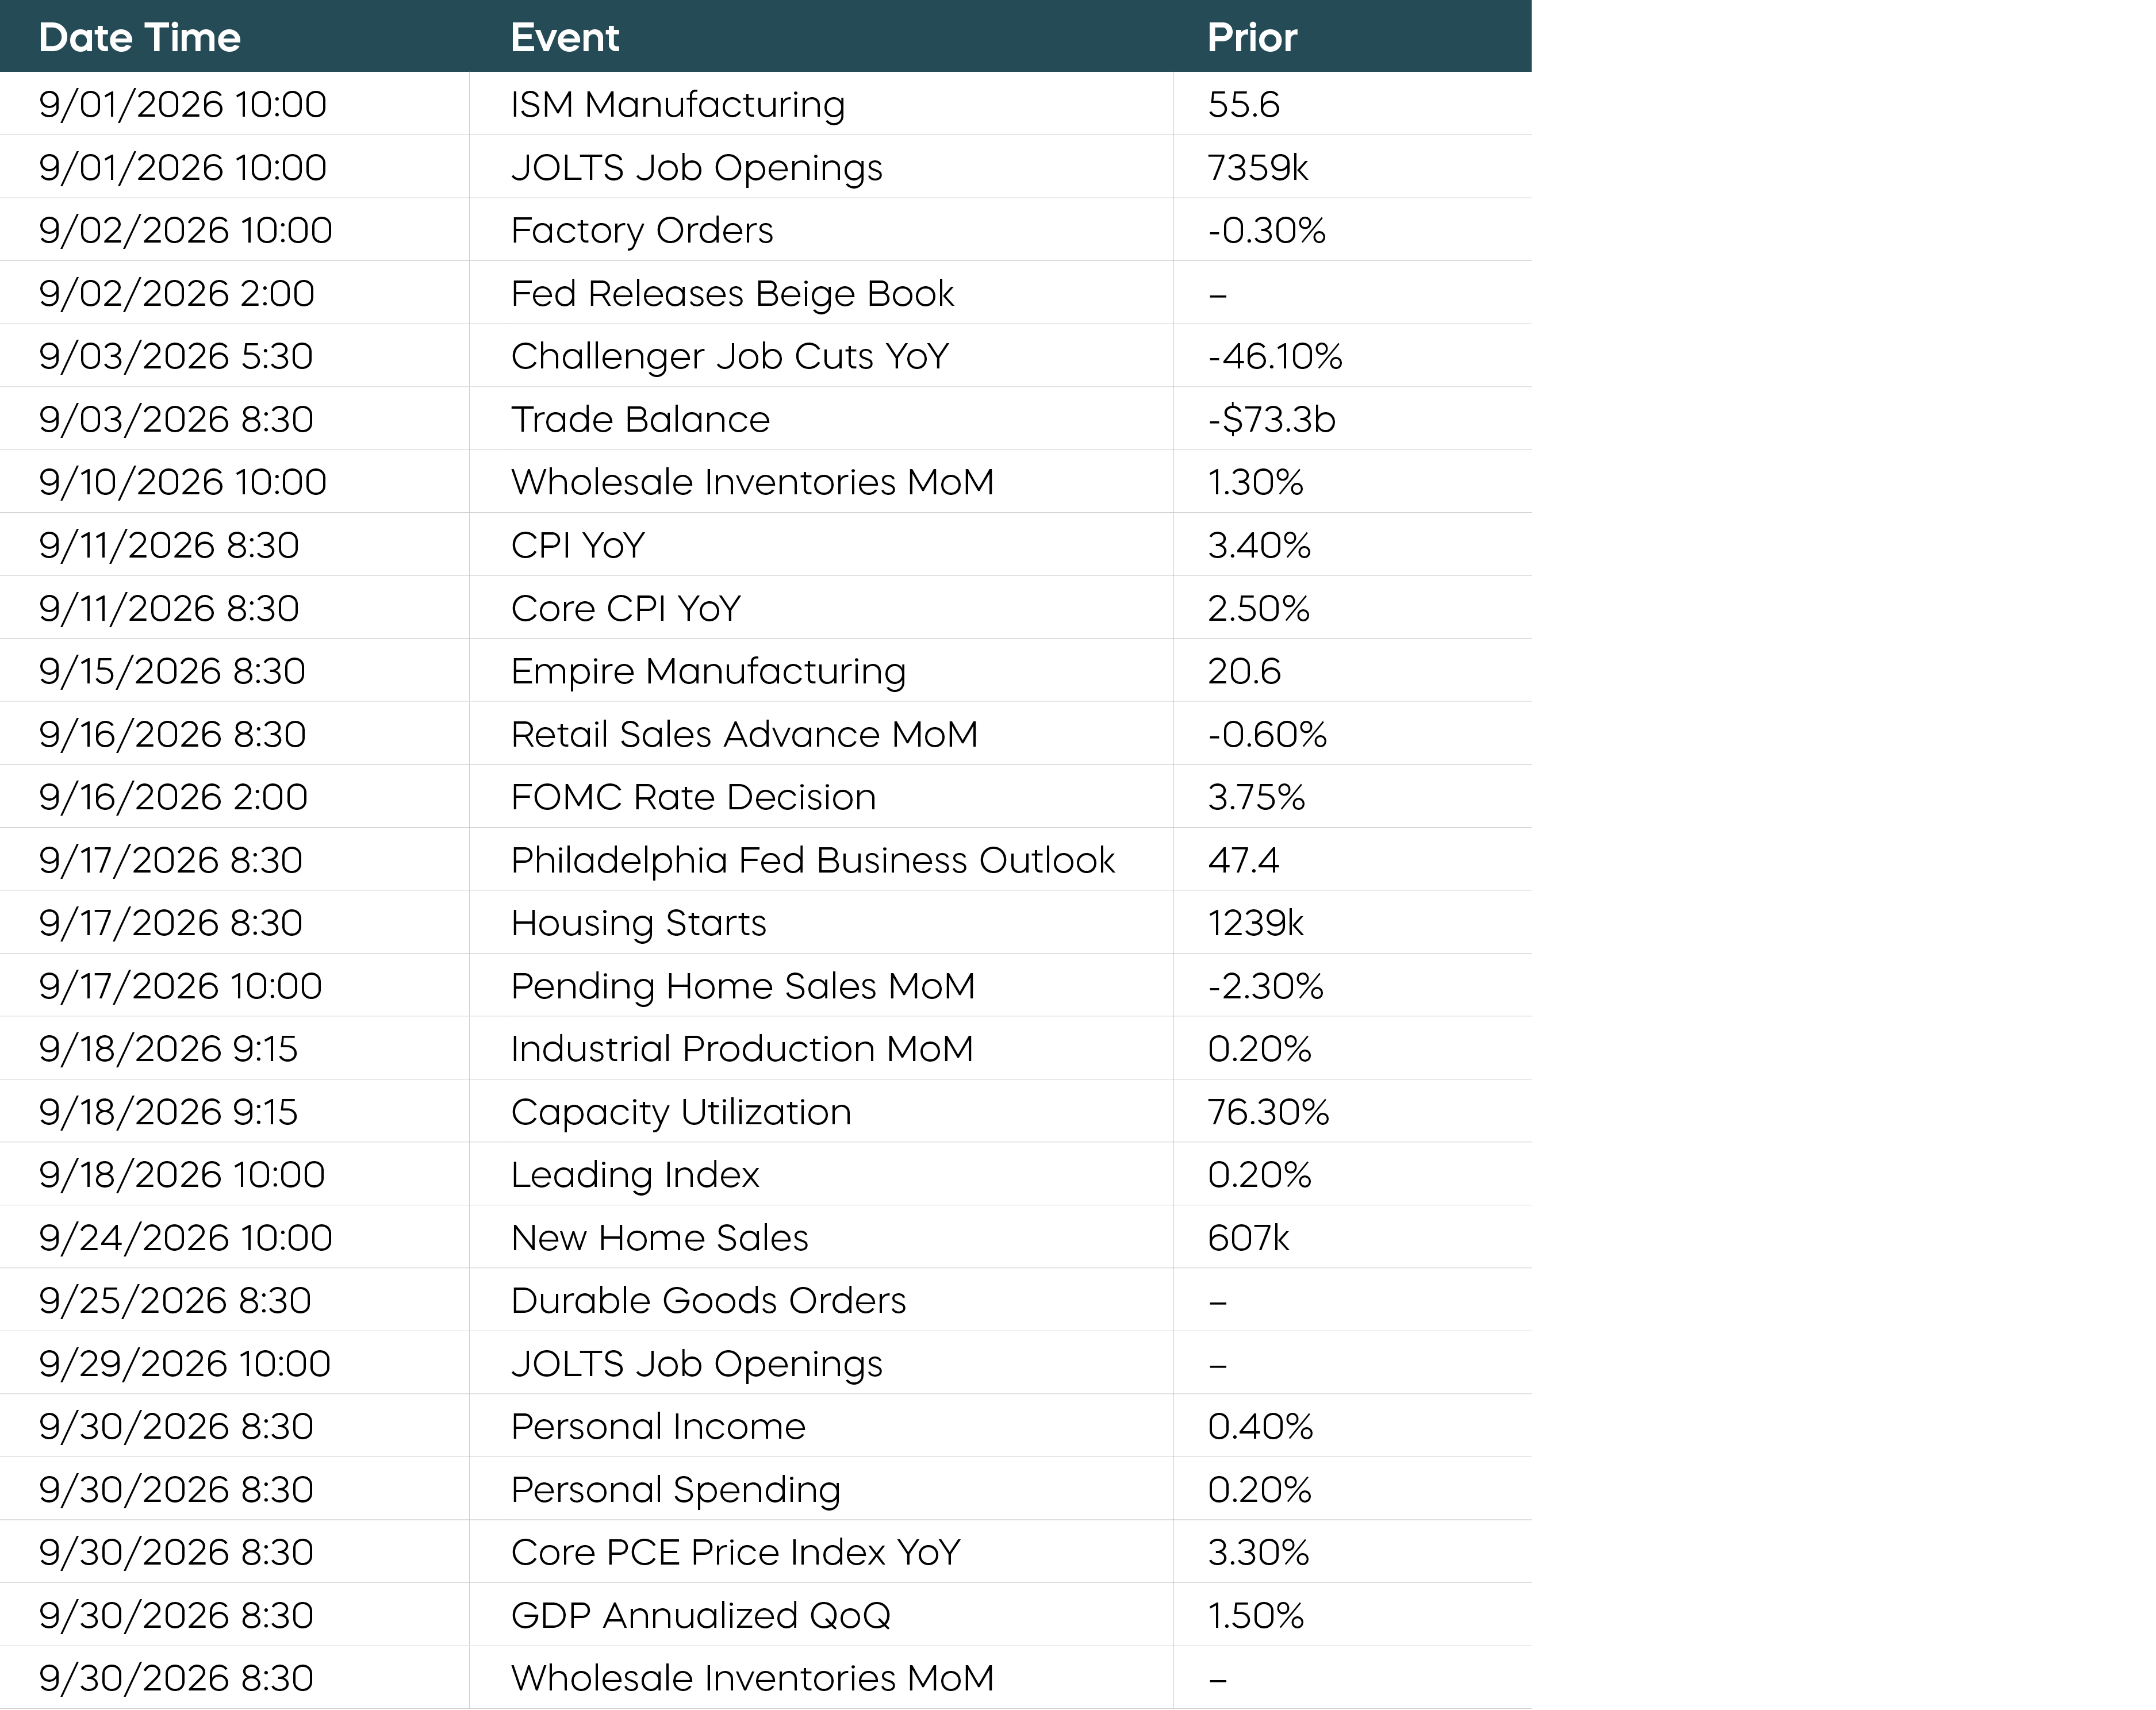
Following is a list of key and upcoming economic releases, which may serve as a guide to potential market indicators.
Equity Perspectives

Will higher treasury yields hamper equities?
Despite pressure pushing long-term Treasury yields to multi-year highs, the S&P 500 was up 2.7% in August and delivered multiple all-time highs, according to Standard & Poor’s. Equity markets have demonstrated a remarkable level of resilience and have thus far side-stepped every macro challenge in 2026. The latest bogey: rising interest rates.
Rising long-term interest rates are often viewed as a headwind for equities. The conventional argument is straightforward: higher Treasury yields can raise financing costs and increase the discount rate, thus lowering the value of future corporate earnings and cash flows.
While this logic is valid, it overlooks an important point. The pace and volatility of changes in interest rates matter greatly. Thus far in 2026, the volatility of interest rate movements has been relatively well contained, considering the magnitude of the rise in 10-year yields.
The MOVE Index, which tracks the volatility in Treasuries, is not currently signaling a high level of stress. While it spiked in late March as anxiety over a new Fed Chair’s expected rate path began to build, the MOVE index ended August at a relatively subdued level and only marginally above where it started at the beginning of the year.
As we’ve noted, the move in Treasury rates has been a function of rising real rates, not rising inflation expectations. Real rates may have risen for a variety of reasons, including an unwinding of QE and growing concerns over the fiscal deficit.
But after what has been a period of sustained economic resilience, perhaps one of the best explanations for the increase in real rates is that the market is reevaluating its estimate of the neutral real rate upward and the economy appears capable of sustaining that higher rate level without triggering a recession.
The bottom line? Combine ongoing expectations for strength in earnings growth with a resilient economy, and the outlook suggests that equity markets may be able to withstand these higher rates, as long as bond volatility remains relatively contained.
How can investors find high yield without the duration risk of bonds?
With continued pressure on bond rates, many investors are looking for income sources less correlated with interest rate risk. As a result, equity markets are an increasingly popular source of income.
One such approach is a traditional covered call strategy, which targets higher levels of income by selling monthly expiring options. These strategies have become widely available in ETF wrappers, but investors need to choose wisely. Traditional monthly covered call strategies have sacrificed a significant amount of the market’s total return over time in exchange for their income.
Covered call strategies powered by daily options have improved this tradeoff. Since its inception in 2023, the S&P 500 Daily Covered Call Index has returned 71.9% compared to 50.8% for the CBOE S&P 500 BuyWrite Index—a proxy for traditional monthly covered call strategies.[2]
Autocallable strategies offer another equity related high-income strategy with significant potential. In simple terms, autocallables are structured investments that pay coupons periodically, and they return an investor’s principal at maturity if the underlying equity-linked index has not fallen below a certain barrier level at the time of maturity.
Traditionally, investing in autocallables involves a complicated process of managing individual structured notes. The challenges of juggling a portfolio of individual notes include managing reinvestment risk if the notes are called early, opaque pricing, and a lack of liquidity on the secondary market.
There are, however, autocallable ETF strategies that may offer a simpler solution (based on indexes like the S&P 500 Futures 35% Volatility Compass Autocall Index, for example). Index-based ETF strategies typically offer a laddered structure designed to track a portfolio of multiple autocallable notes. A laddered strategy may provide a more reliable return profile and income stream, while also potentially helping to address concentration and timing risks compared to single notes.
Autocallable ETFs are typically designed to target high income and offer potentially tax-efficient distributions. And compared to typical fixed income investments like corporate bonds, autocallable ETFs have generated double-digit distribution rates.
Autocallable ETFs May Offer Higher Distribution Rates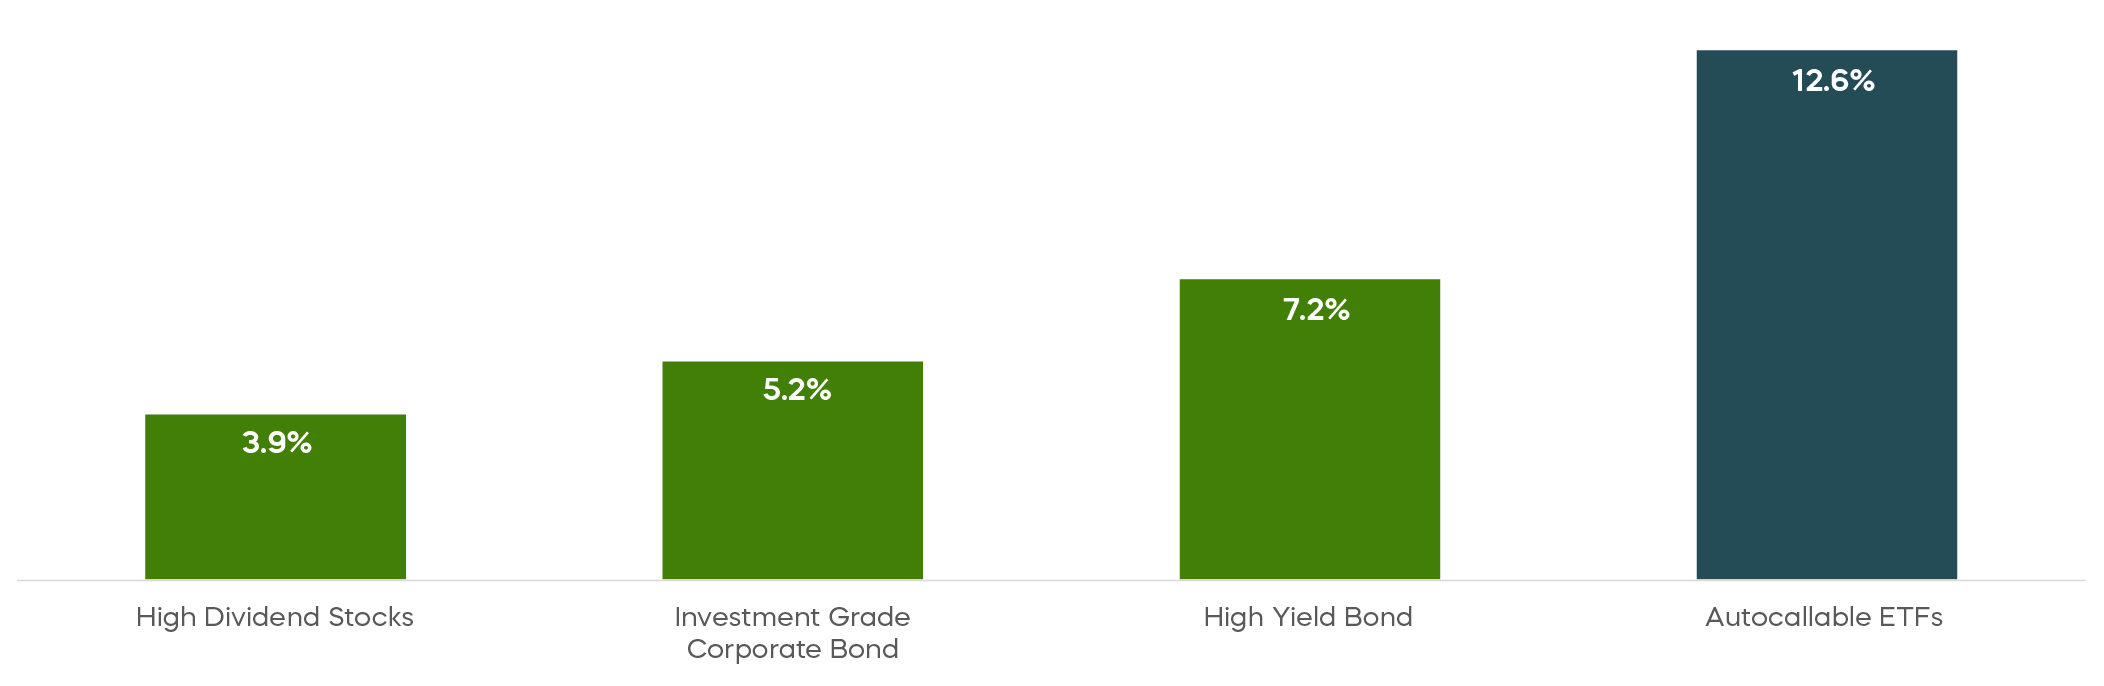
Fixed Income Perspectives
Why are credit spreads near all-time lows?
Credit spreads are tight and issuance is at record levels. A key driver of issuance has been, of course, financing for AI infrastructure. While high issuance often widens credit spreads as supply challenges demand, it hasn’t been doing so recently.
Investment Grade Bond Issuance Has Risen Substantially
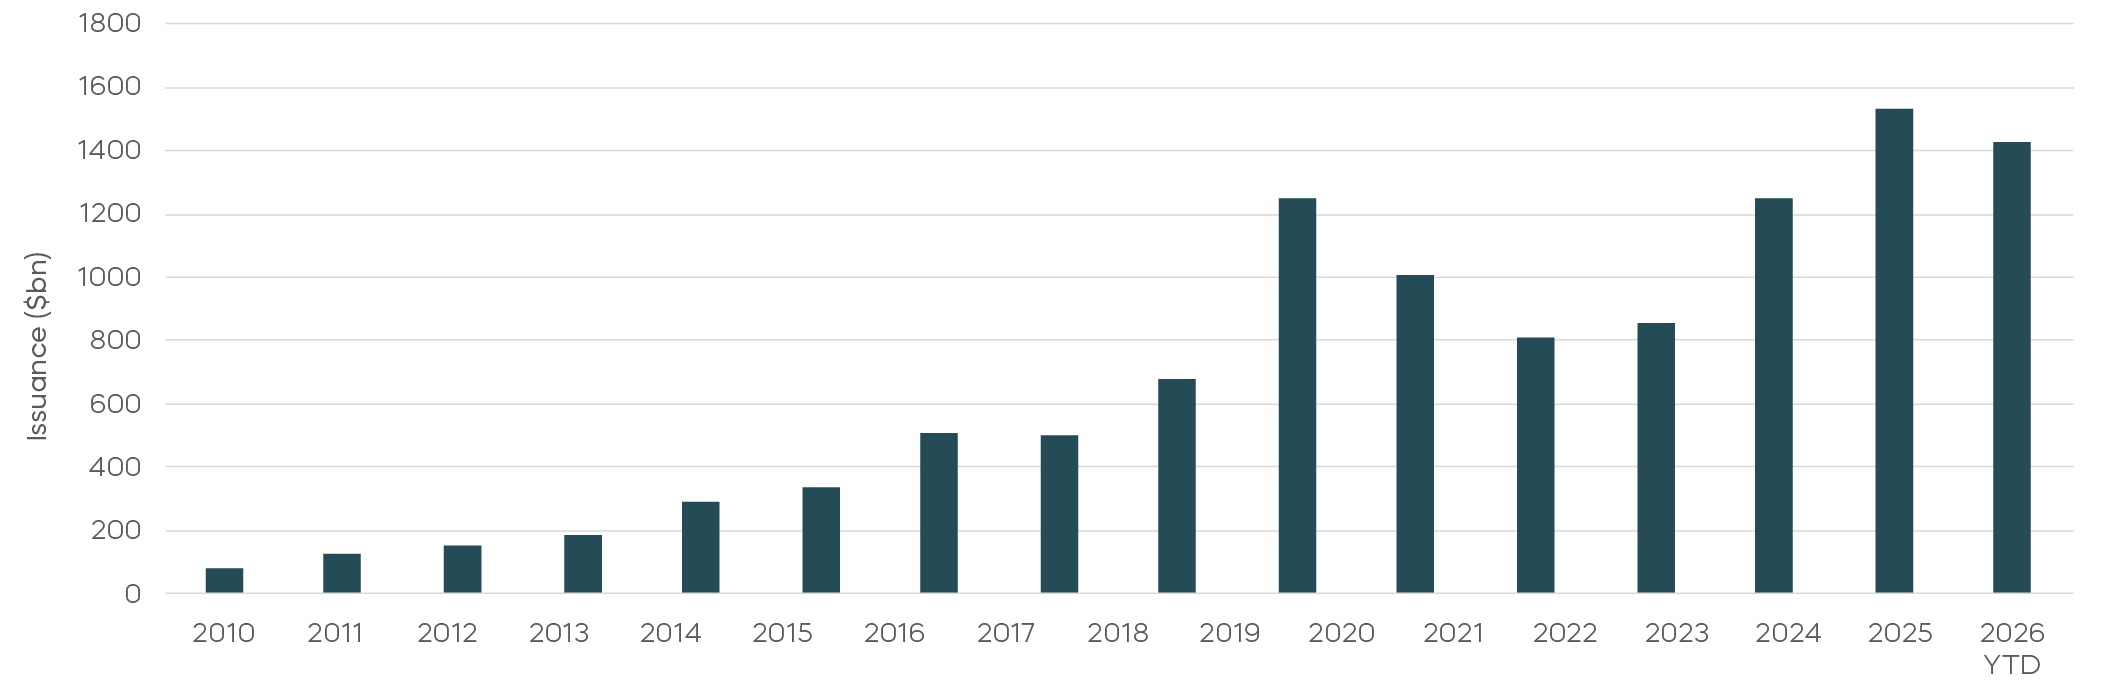
Credit spreads are in the vicinity of all-time lows. That has caught the attention of investors, concerned that tight spreads may be on the cusp of widening in the face of an excess supply of credit. That could put corporate bond prices at risk.
However, there may be an important offset to these tight spreads. Corporate balance sheets have been very strong recently, carrying less leverage than in the past.
Spreads Have Tightened but Corporate Leverage Has Declined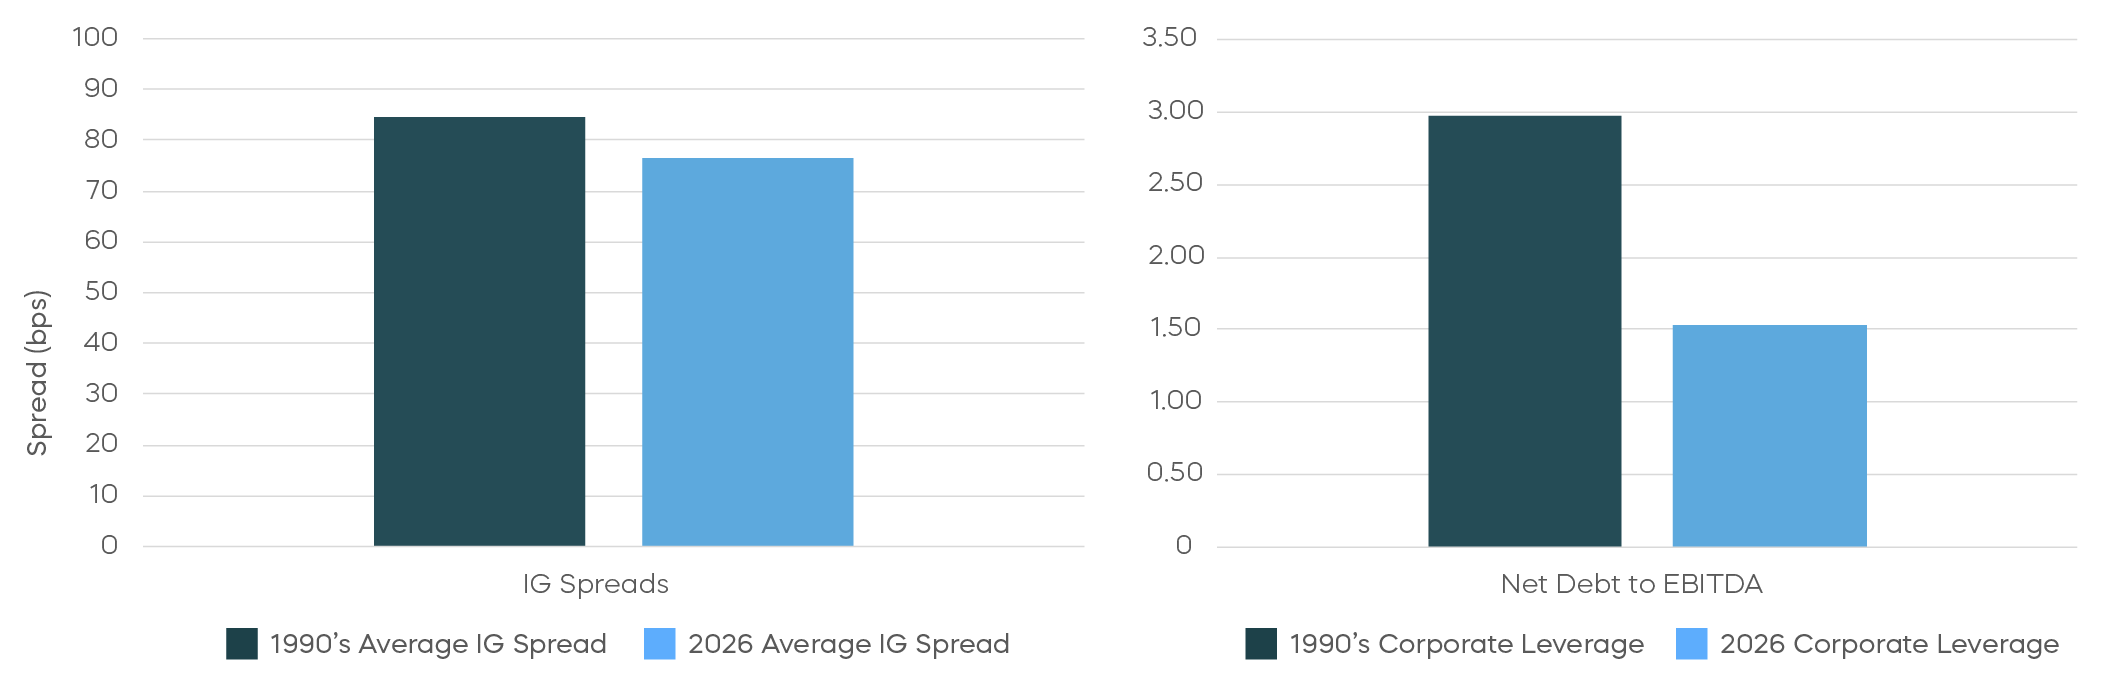
Investment grade bond spreads are only a smidge tighter than they were in the 1990s, but Net Debt to EBITDA, a key leverage measure, stands at only half of its 1990s average. And the stunning earnings growth we’ve been seeing this year is beginning to make its way to bottom lines, which has begun to drive driving leverage down even further. Bloomberg consensus forecasts have Net Debt to EBITDA down to 1.1 by the end of 2026. Investment grade bonds may not be cheap today, but with leverage at these levels, they may be fairly priced.
Credit spreads, however, have not been consistent across the yield curve.
U.S. Treasury and Investment Grade Yield Curves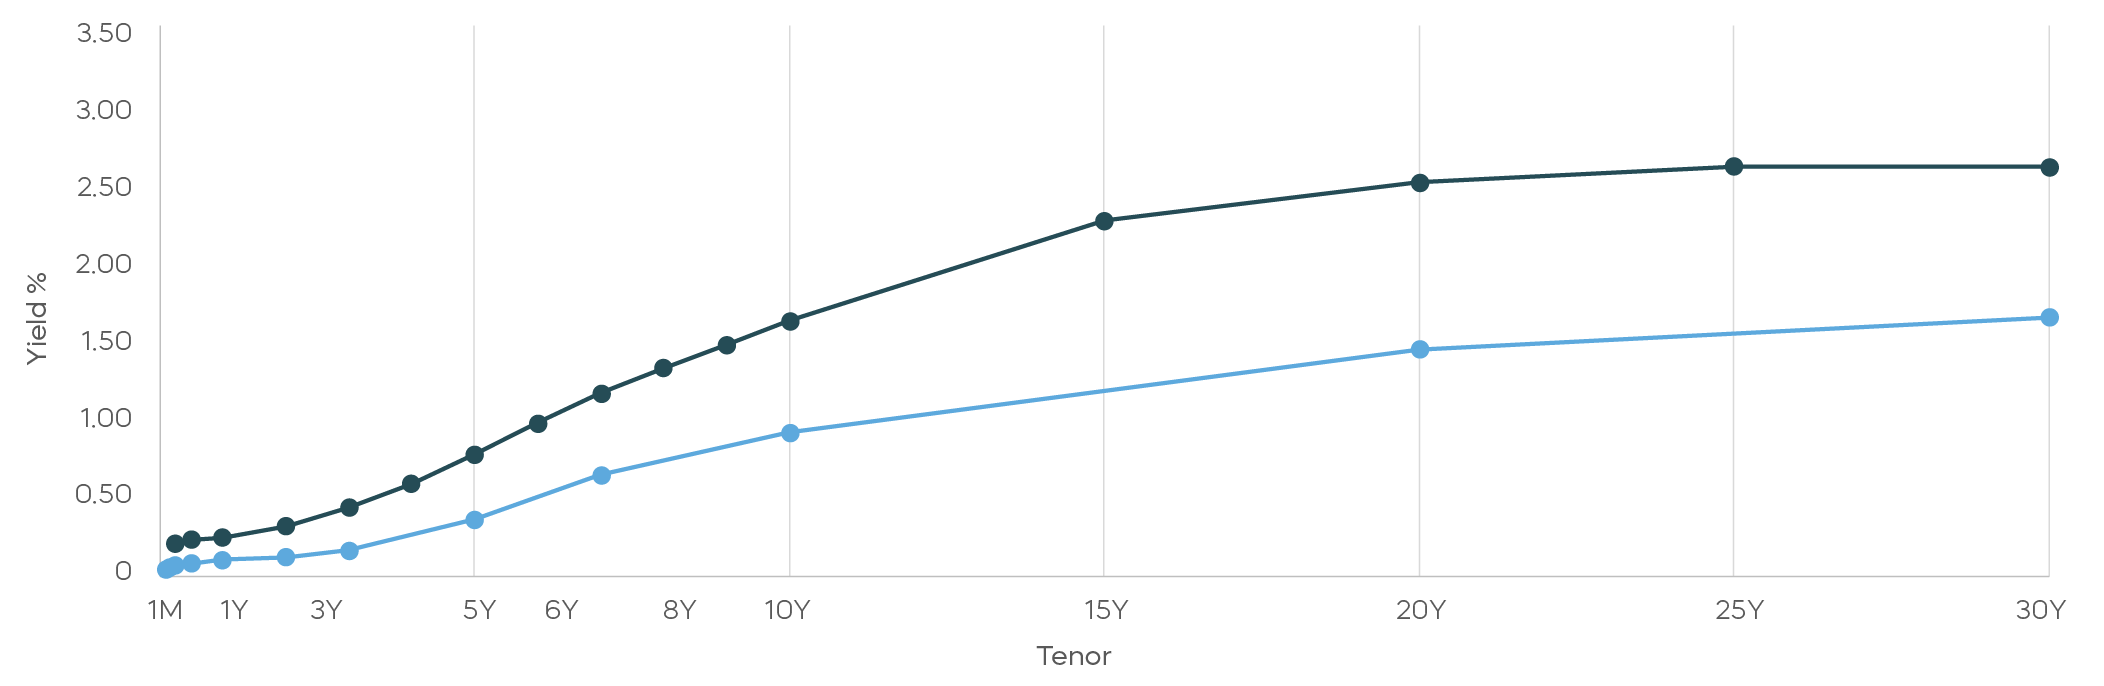
Investment Grade Corporate Spread to Treasuries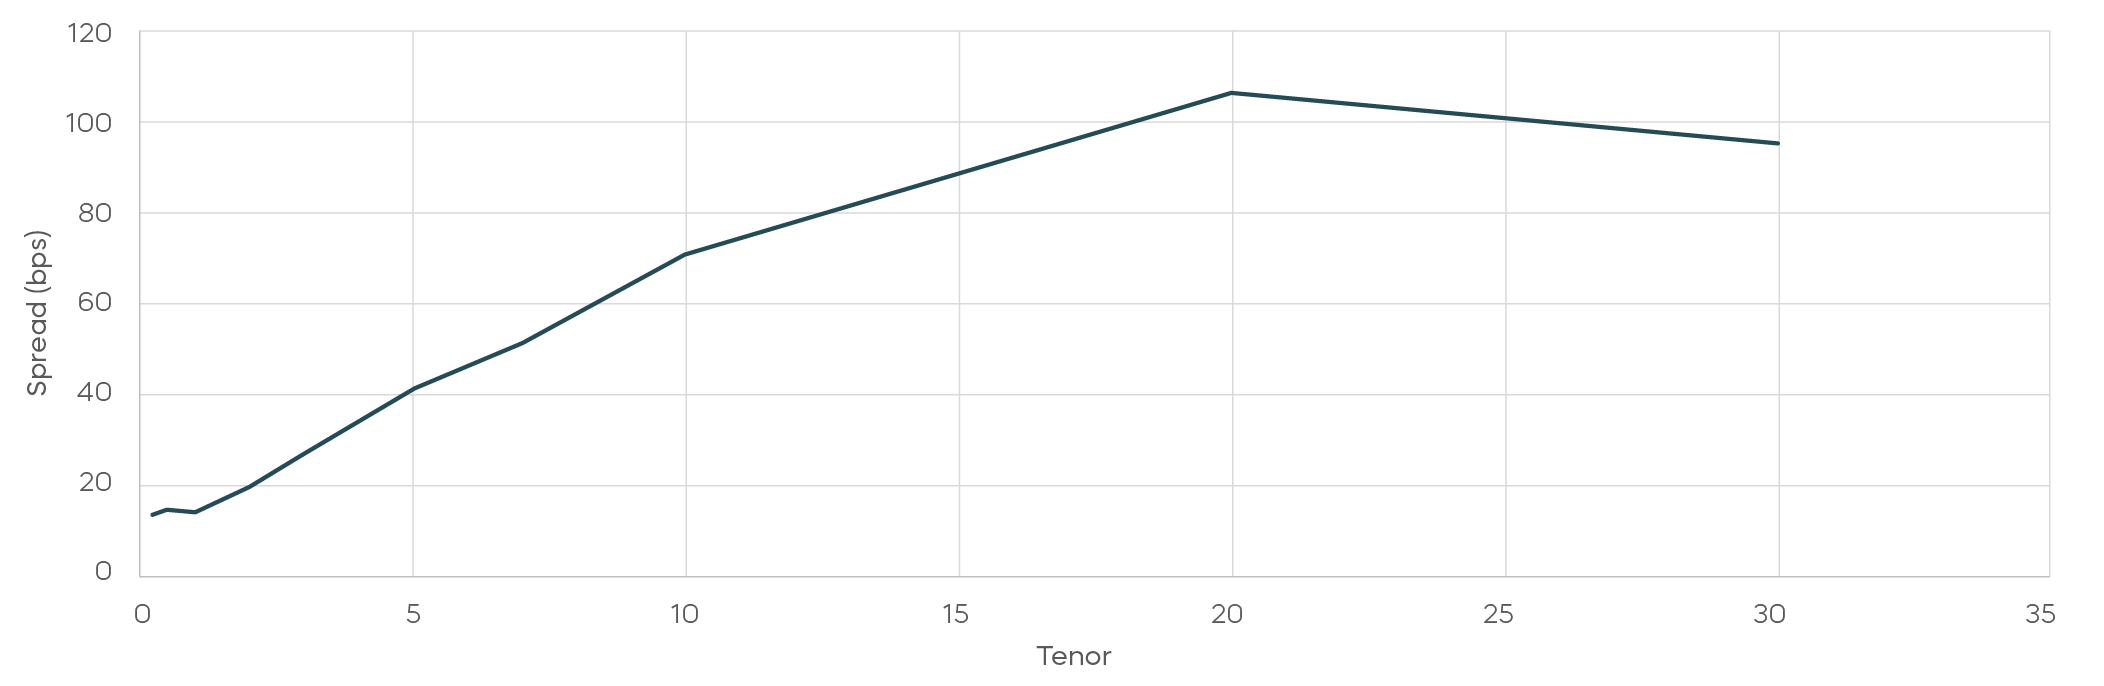
For single-A credits, for example, credit spreads have not been too far from zero for bonds with very short tenors. Spreads that are more in the range of the index-level spreads noted in the chart above aren’t being seen until 10-year terms and beyond. And these longer-dated bonds come with a risk of loss driven by higher Treasury yields—a material risk these days.
It may be timely to consider hedging the Treasury-rate risk of longer-dated corporate bonds. That approach may enable investors to harvest those wider credit spreads, while also offering some protection against potentially rising Treasury yields.
[1] Source Bloomberg, data as of 9/1/26.
[2] Bloomberg, data from 10/5/23 to 8/31/26.