


Key Observations

Markets enter the second half of 2026 facing a familiar wall of worry—geopolitical conflict, oil prices, inflation, Federal Reserve policy, and questions around the durability of an AI-led equity rally. Yet the economic backdrop still looks resilient: growth remains solid, inflation has moderated, unemployment is reasonable, and market leadership appears to be broadening. In short, the soft landing still looks intact, though the opportunity set may be shifting. A few points supporting this view:
- U.S. GDP grew at 2.7% in the first quarter, indicating healthy and potentially sustainable growth.[1]
- Core CPI came in at 2.9% for the month of May, still above the Federal Reserve’s 2% target rate, but significantly down from its peak—all without a recession.[2]
- Unemployment sits at a reasonable 4.2%.[3]
- ISM Manufacturing PMI and Services PMI, over 53% and 54% respectively, have been in expansion territory for more than 20 months in a row.[4]
- And lastly, capacity utilization has remained near 76% for quite some time, a level that suggests strength without overheating.[5]
But not every data point is robust. The June Conference Board Consumer Expectations reading came in at 74.4, a level worth watching for further weakness, but an improvement from the month prior, driven by peace prospects and falling gas prices.
In response, Federal Reserve policymakers have moved to a slight tightening bias.
Have rate markets reversed policy direction at the Fed?
Rate expectations have shifted materially, but expectations for inflation seem contained. The two-year Treasury yield began the year below the Fed Funds rate, implying expectations for Fed cuts. Now, at mid-year, the front end of the yield curve has steepened pointing more toward the potential for Fed rate hikes.
U.S. Treasury curve 12/31/25 vs. 6/30/26
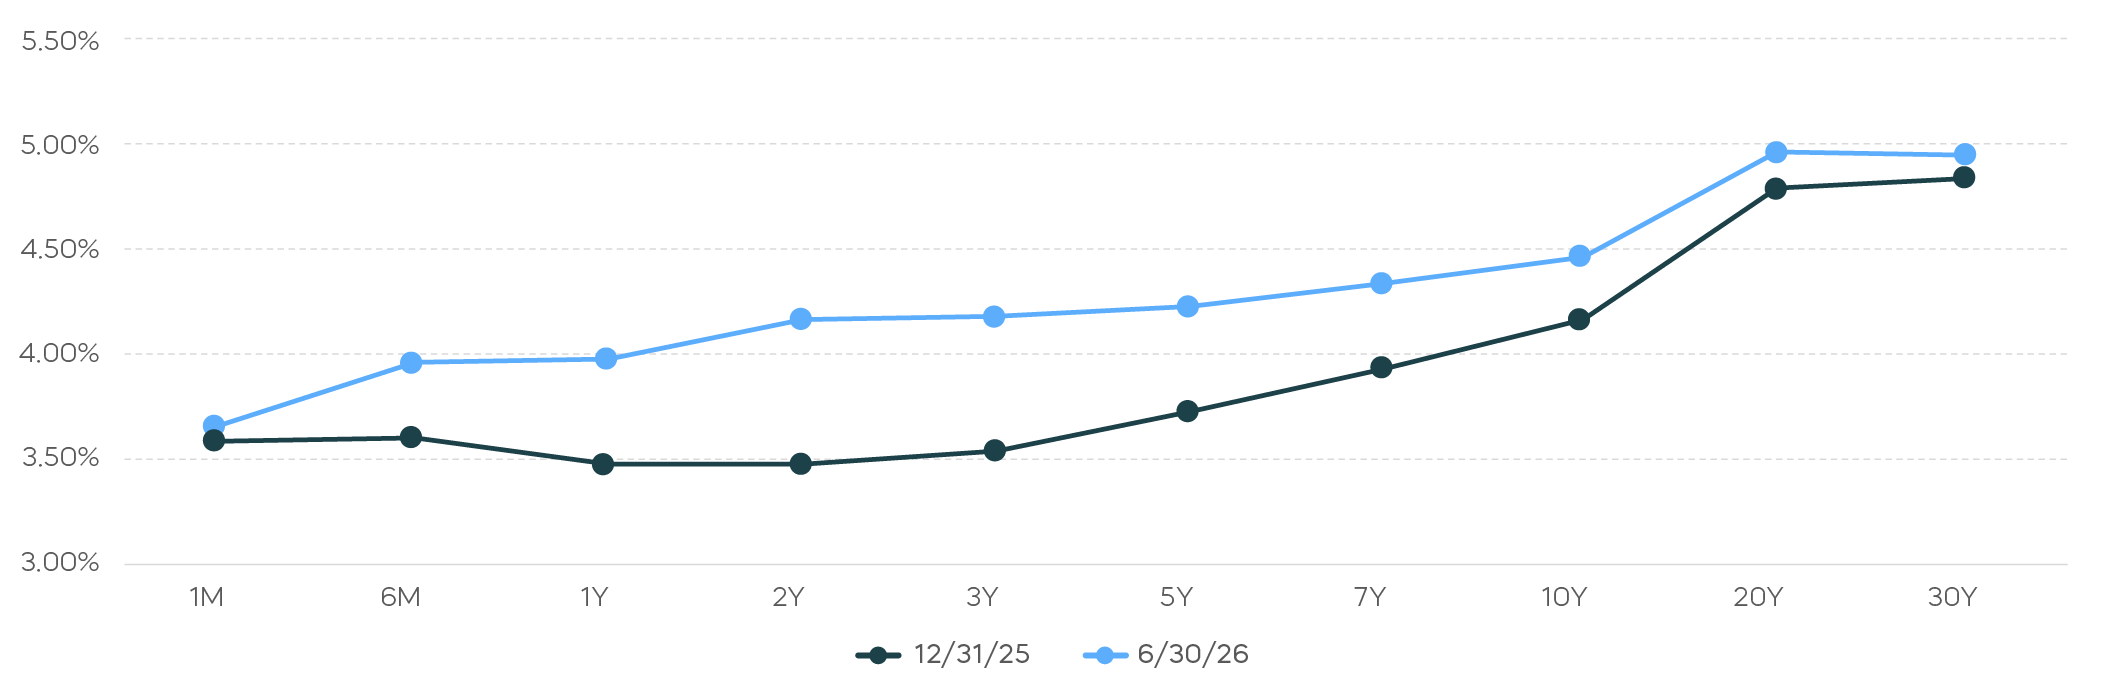
Even so, the move has not been uniform across the curve. As the chart above shows, while the 2-year Treasury yield has risen roughly 70 bps since the beginning of the year, the 10-year Treasury yield has risen only 25 bps, suggesting that long-term inflation expectations may remain in check even if Fed policy expectations have reset higher.
Is the equity market rally really that narrow?
For some time, it’s been widely accepted that a narrow group of companies has been driving stocks. But the ranks of leadership may have expanded in 2026.
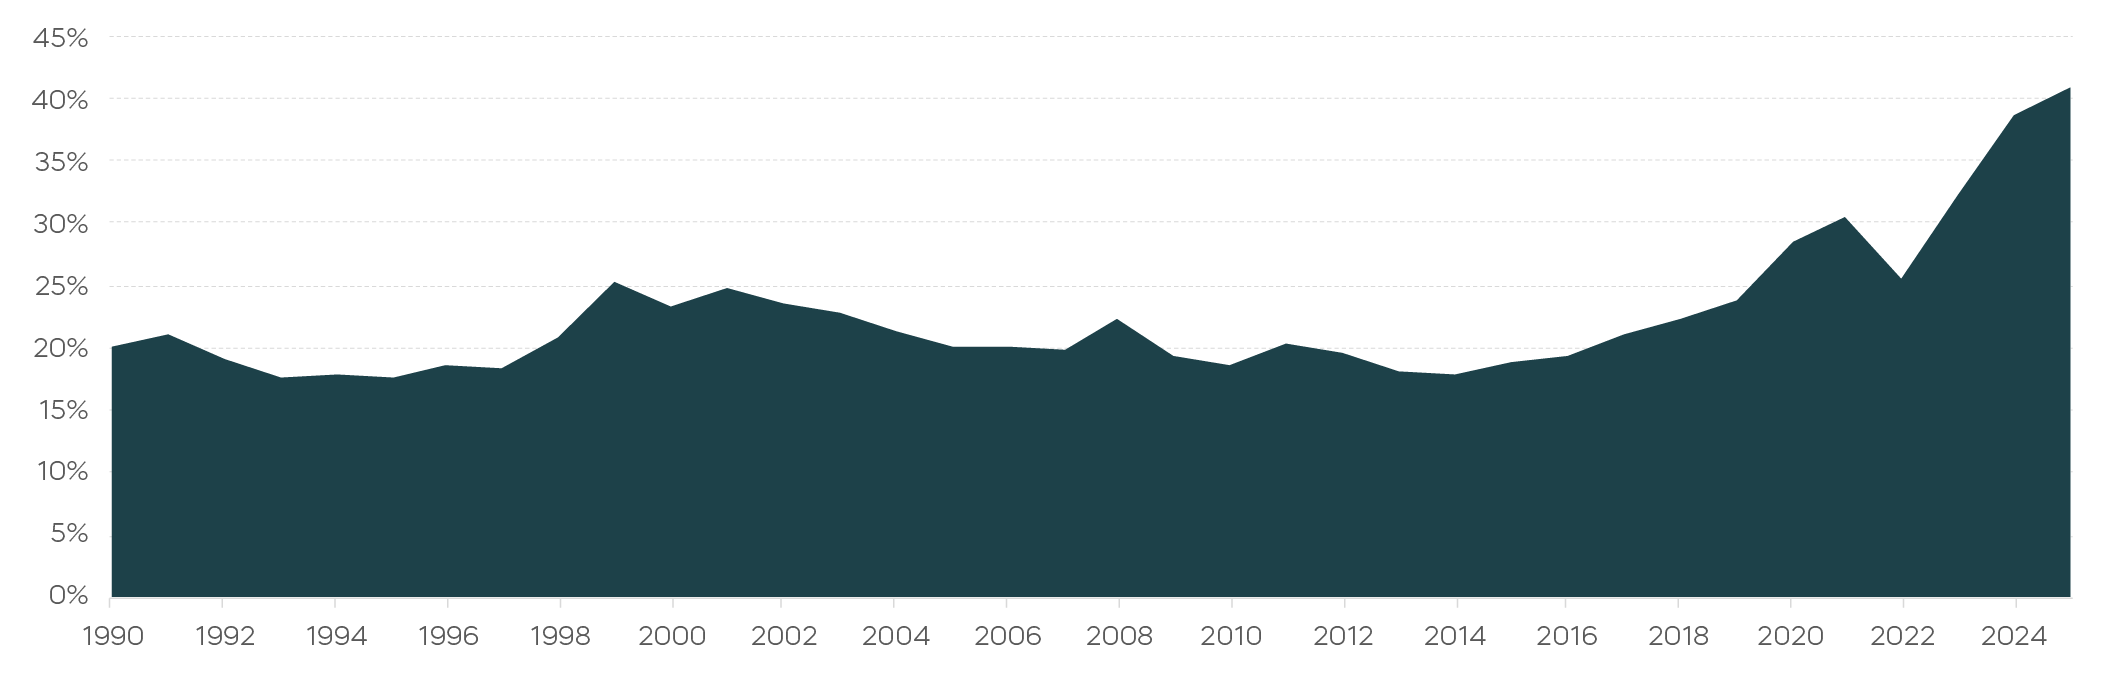
It’s true the S&P 500 is more top-heavy than it has been in decades. As the chart below shows, the top ten stocks in the S&P 500 currently account for more than 40% of its market capitalization. That’s more than double the level in 1990, and substantially greater than during the dot-com era.
Weight of top ten S&P 500 stocks 1990–2025
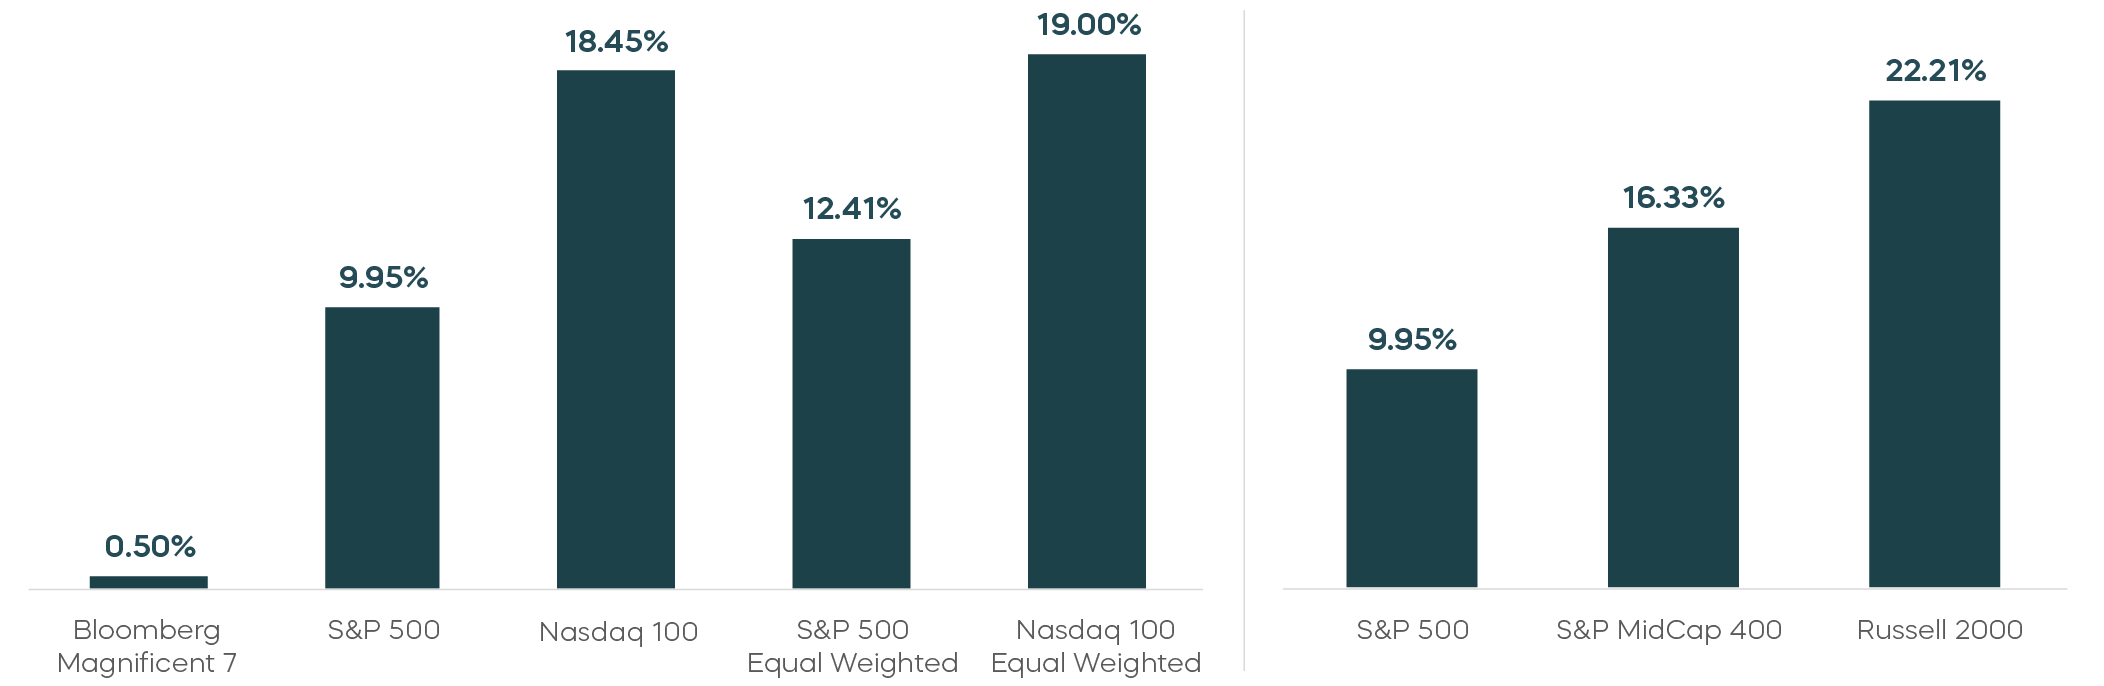
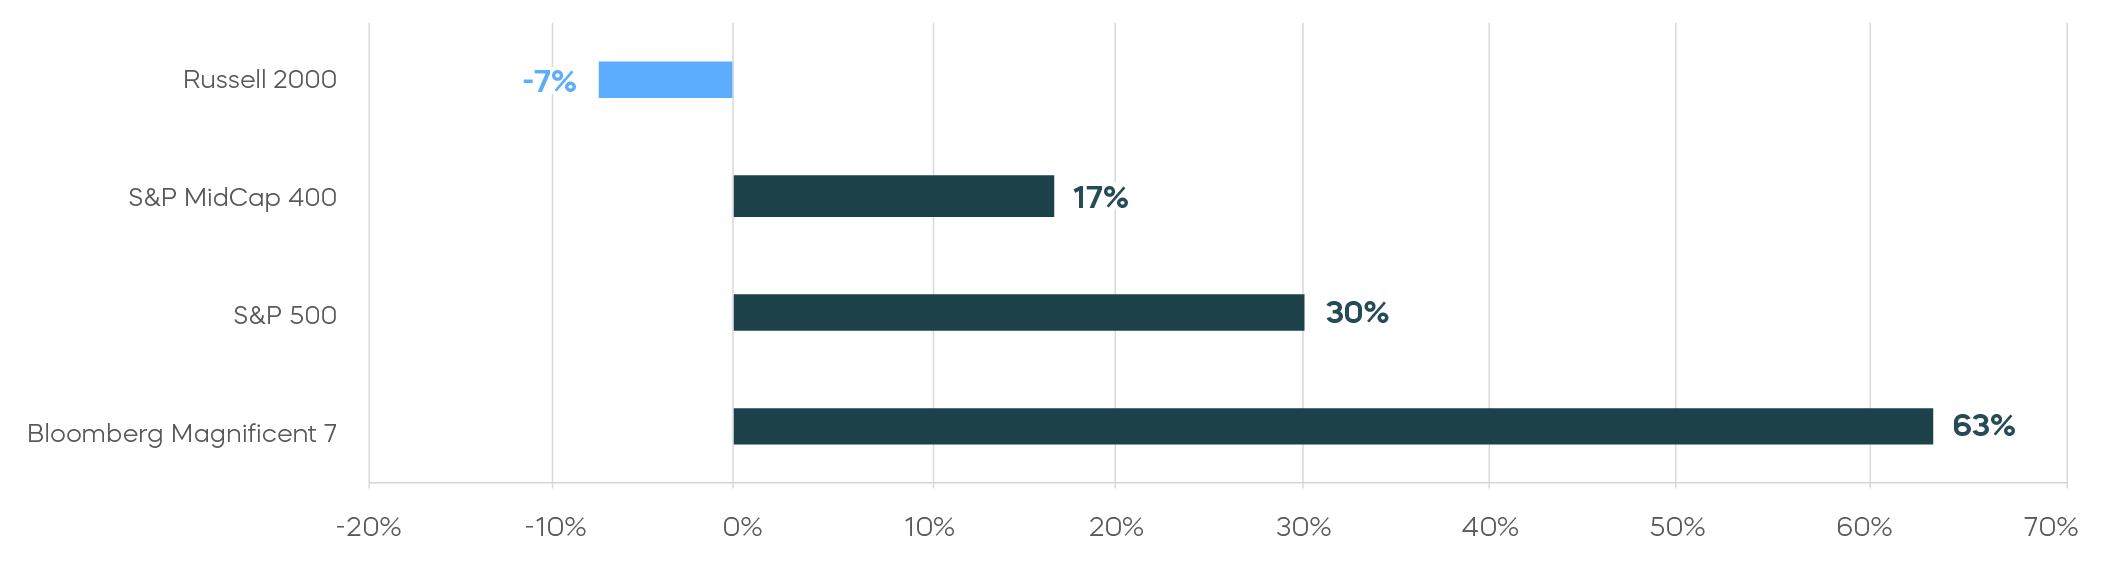
But concentration is not the same as narrowly driven, and an expanded view of year-to-date returns tells a story of relatively broad performance. The Bloomberg Magnificent 7 Index was barely in the green year-to-date. Meanwhile, both the broader Nasdaq-100 and S&P 500 performed well. Moreover, the equal-weighted versions of both indexes outperformed their market-cap-weighted counterparts. Mid- and small-cap stocks also significantly outperformed large caps. That pattern seems to indicate a much broader rally leading into the second half of 2026.
Year-to-date total returns seem to indicate a broadly driven rally
Valuation and fundamentals still matter
Earnings growth has followed a more familiar pattern than returns, led by the Magnificent 7 and weaker for small caps, as shown below. The takeaway is not that fundamentals no longer matter. It is that valuation matters too. In a twist on the recently passed Alan Greenspan’s famous phrase, today’s market may be showing signs of “rational exuberance”—optimism supported not only by AI enthusiasm, but also by broader participation and improving fundamentals.
First quarter earnings growth followed a familiar pattern
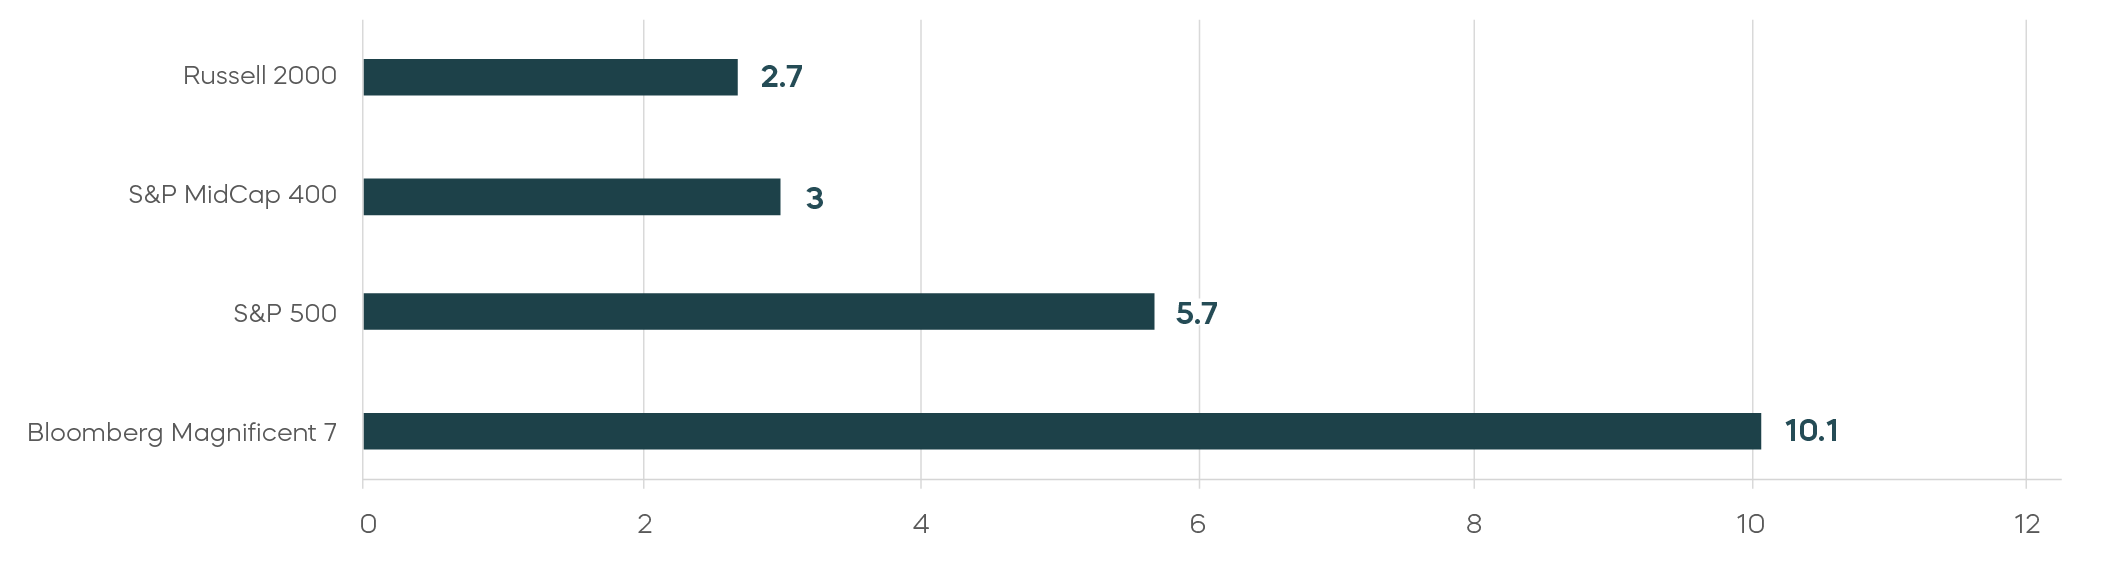
Price-to-book ratios indicate that valuation also matters
Source: Bloomberg, earnings and price-to-book data as of 7/2/26. Index returns are for illustrative purposes only and do not reflect any management fees, transaction costs or expenses. Indexes are unmanaged, and one cannot invest directly in an index. Past performance does not guarantee future results.
Asset Class Perspectives
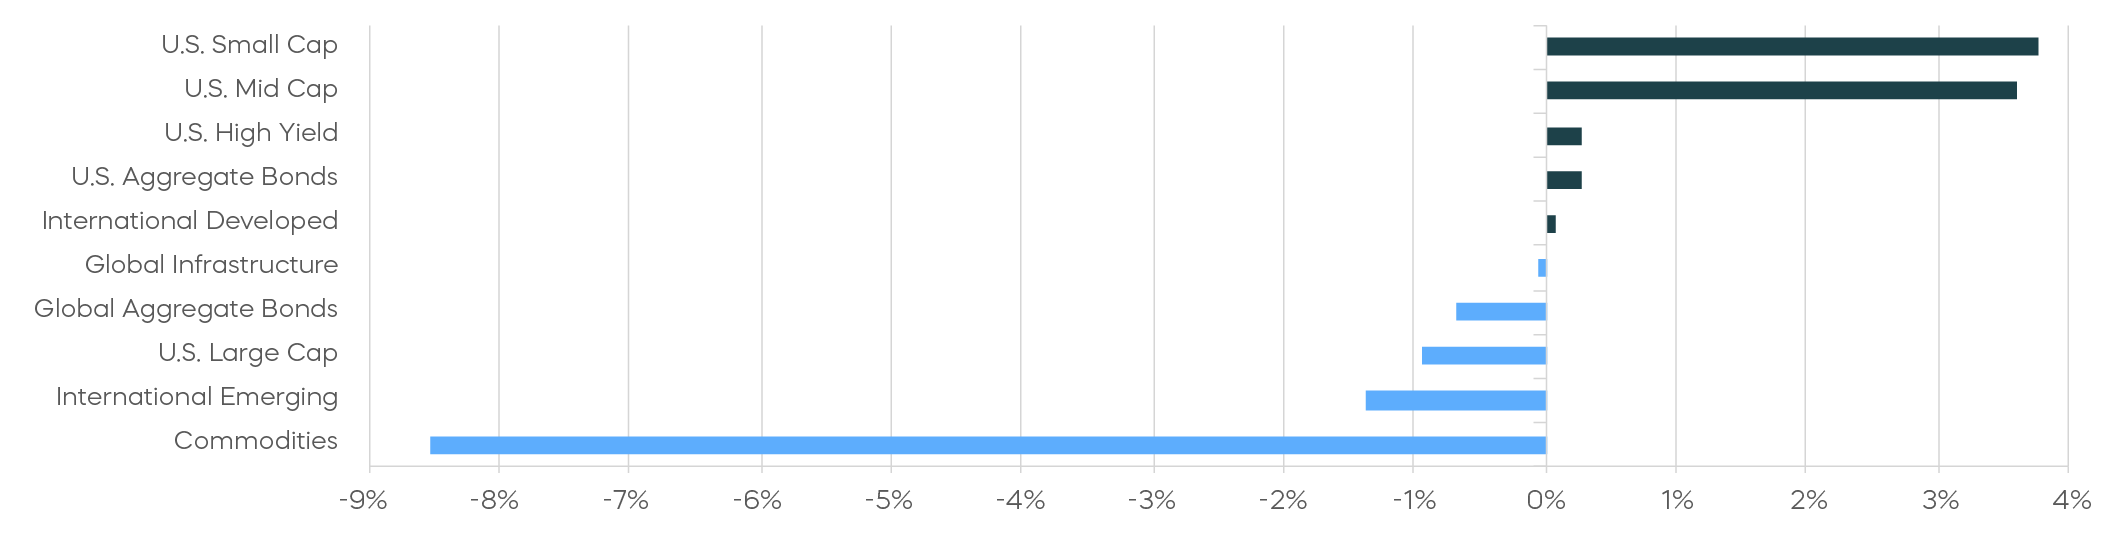
Asset class returns—June 2026
Asset class returns—Year-to-date 2026
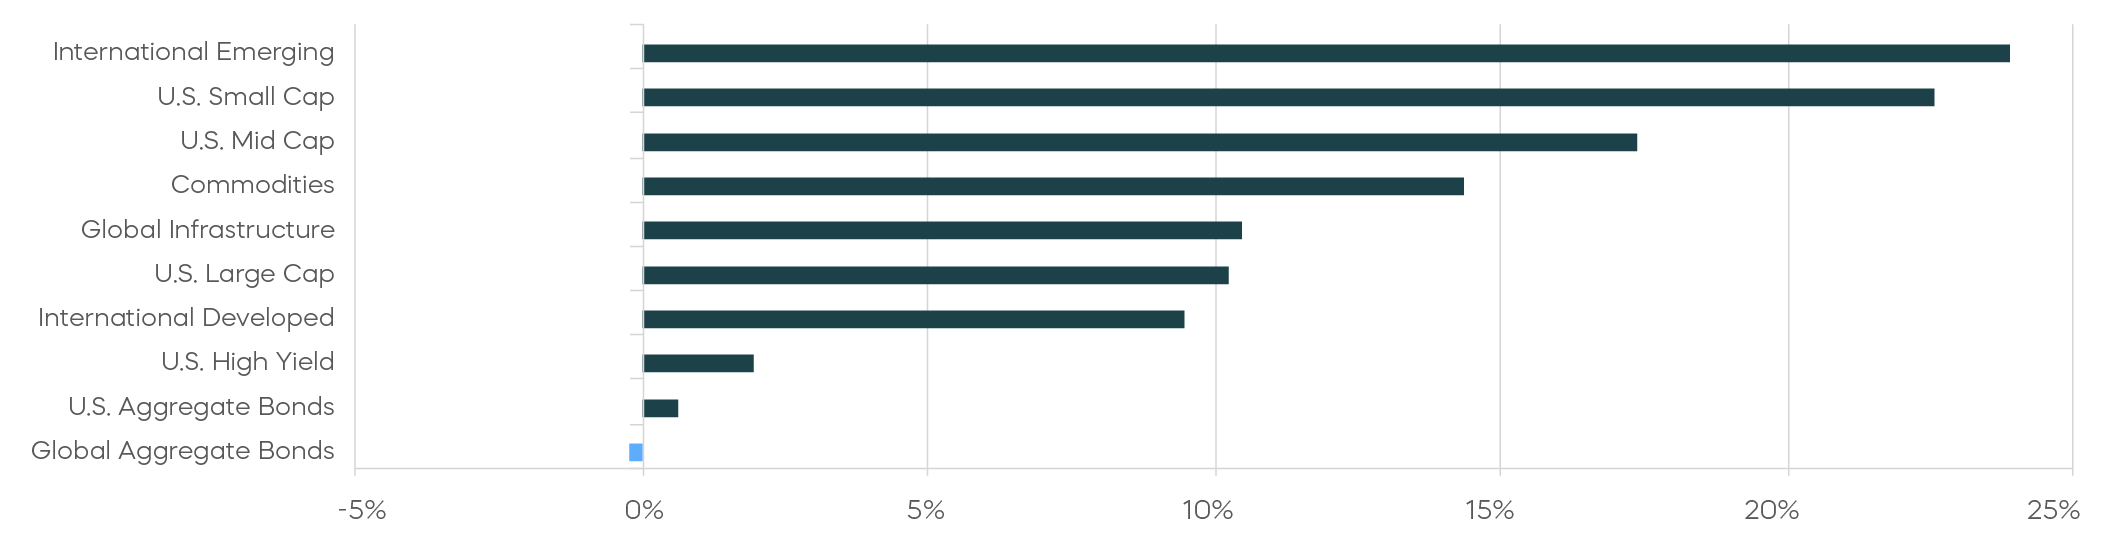
Source: Bloomberg. June returns 6/1/26–6/30/26; year-to-date returns 1/1/26‒6/30/26. Index returns are for illustrative purposes only and do not reflect any management fees, transaction costs or expenses. Indexes are unmanaged, and one cannot invest directly in an index. Past performance does not guarantee future results.
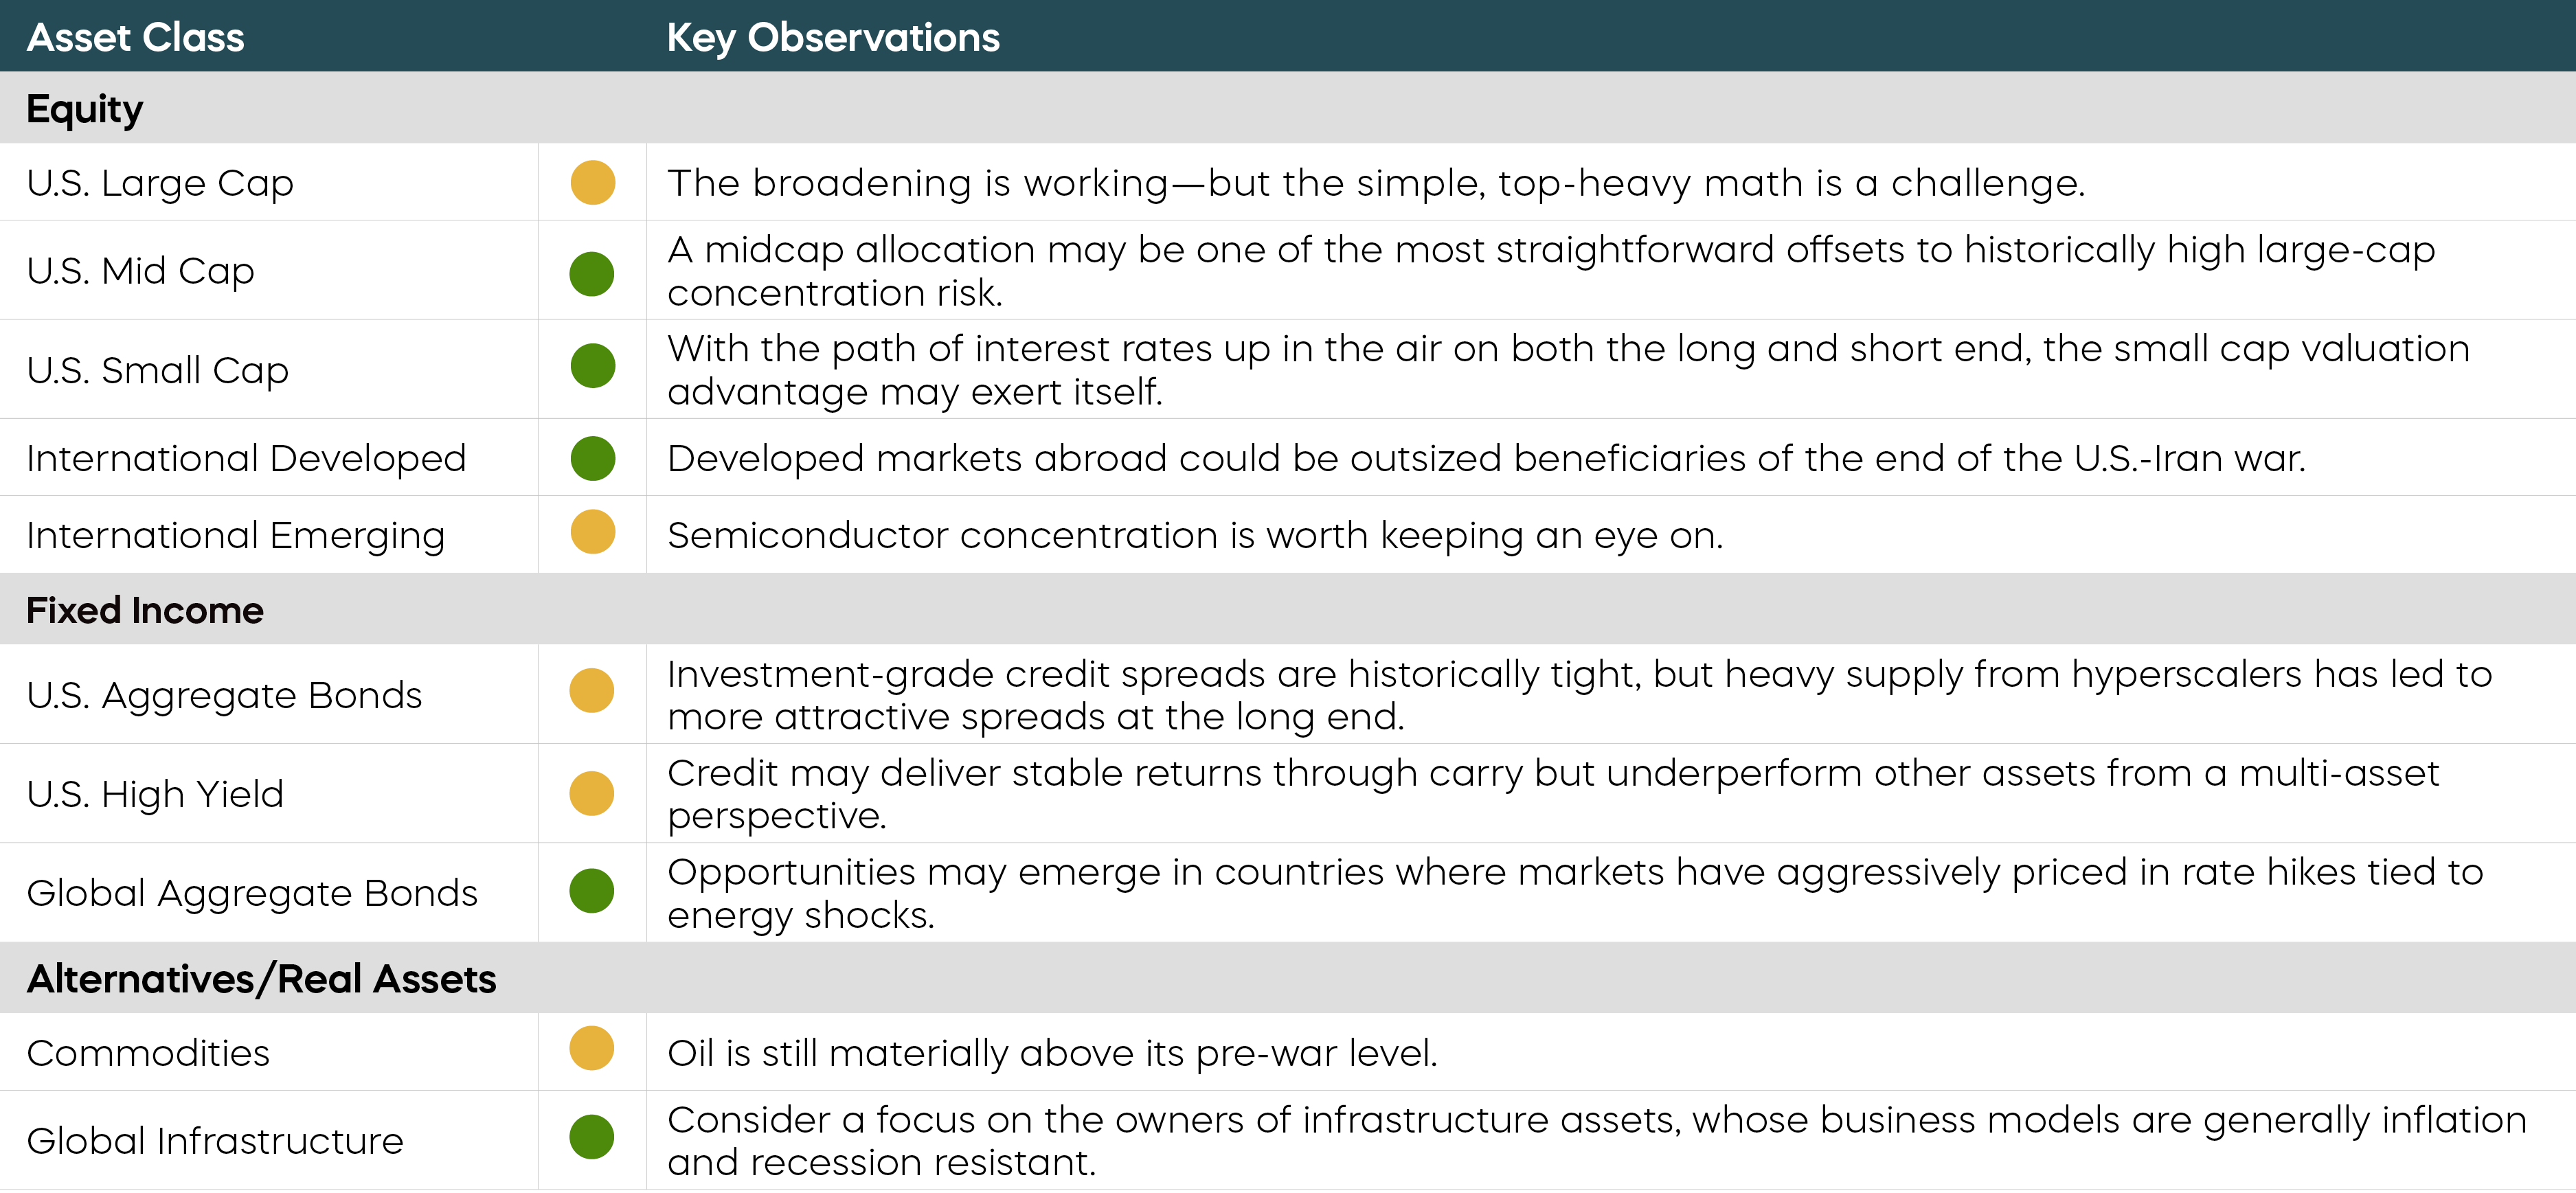
The following observations summarize our view on a range of asset classes. For each, green indicates a constructive backdrop, yellow indicates a neutral environment, and red indicates a challenging backdrop.
Equity Perspectives

How are broadening leadership and higher dispersion creating opportunities in the second half of 2026?
Media coverage of equity markets in 2026 has largely centered around two questions:
- Can the AI-fueled growth stock rally continue?
- Can the markets continue to shrug off macro-level uncertainties?
So far, expanding equity leadership has enabled us to answer “yes” to both questions, but increasing dispersion between winning and losing stocks could influence the second half of the year.
How will cap-ex propel equities?
The first half of 2026 produced solid returns for headline equity indexes but there is more to the story beyond blockbuster IPOs and concerns of a bubble. Surging hyperscaler capital expenditures have propelled the AI narrative so far, and may continue to do so. But improving market participation and elevated levels of stock dispersion could also shape the direction of markets for the remainder of the year by creating opportunities to improve portfolio diversification beyond the AI-rally drivers.
Hyperscaler capital expenditures have risen significantly
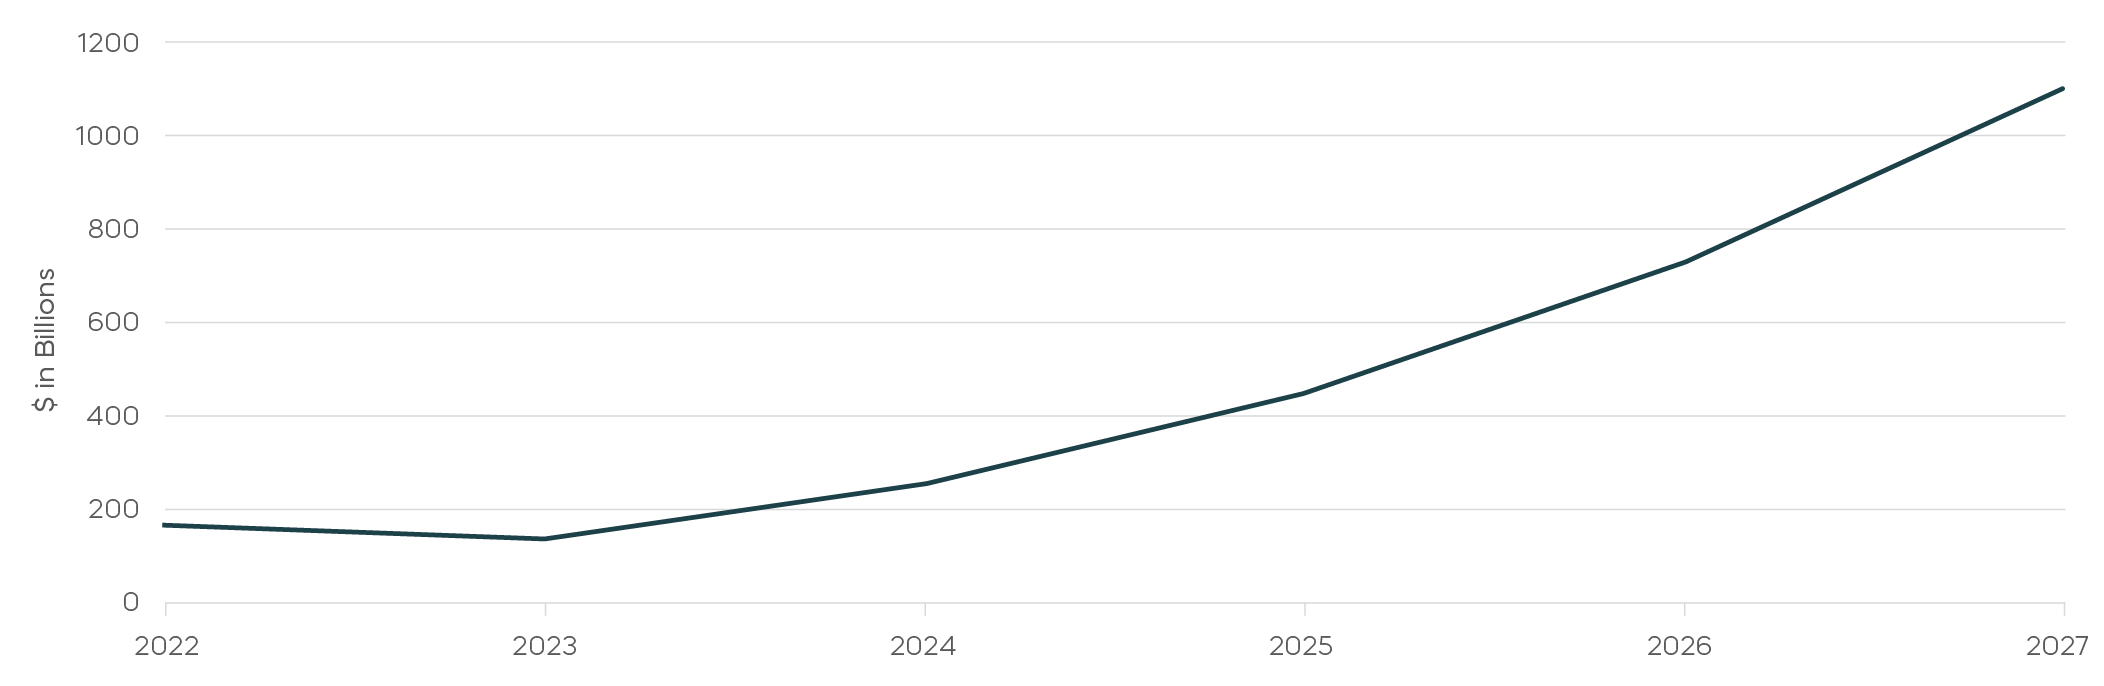
Source: Aggregated capex for Amazon, Microsoft, Alphabet, Meta and Oracle from company filings compiled by Epoch AI and Visual Capitalist. Combined spending rose roughly $162 billion in 2022 to $448 billion in 2025. 2026 estimate: Moody’s and other analysts expect hyperscaler capex to approach $700–$725 billion as AI infrastructure deployment accelerated. 2027 estimate: Goldman Sachs’ base case is roughly $1.1 trillion of hyperscaler AI capex by 2027, with a bullish scenario as high as $1.4 trillion.
Does broadening market leadership signal a healthier bull market?
A defining characteristic of equity markets during the first half of 2026 has been expanding participation, which is generally characteristic of sustainable performance. S&P 500 concentration remains elevated, but this year’s index returns haven’t been driven solely by the Magnificent 7. Of the ten leading contributors to the S&P 500’s returns for the first half, only three were Mag 7 names.
Other segments are beginning to assume leadership. Semiconductor strength shows how AI beneficiaries are changing, but market gains haven’t been limited to just chips and memory. Mid- and small-cap stocks, for example, have outperformed the S&P 500 not only year to date, but since the post Liberation Day rally that began in April of 2025.
Small-caps and mid-caps have outperformed since April 2025
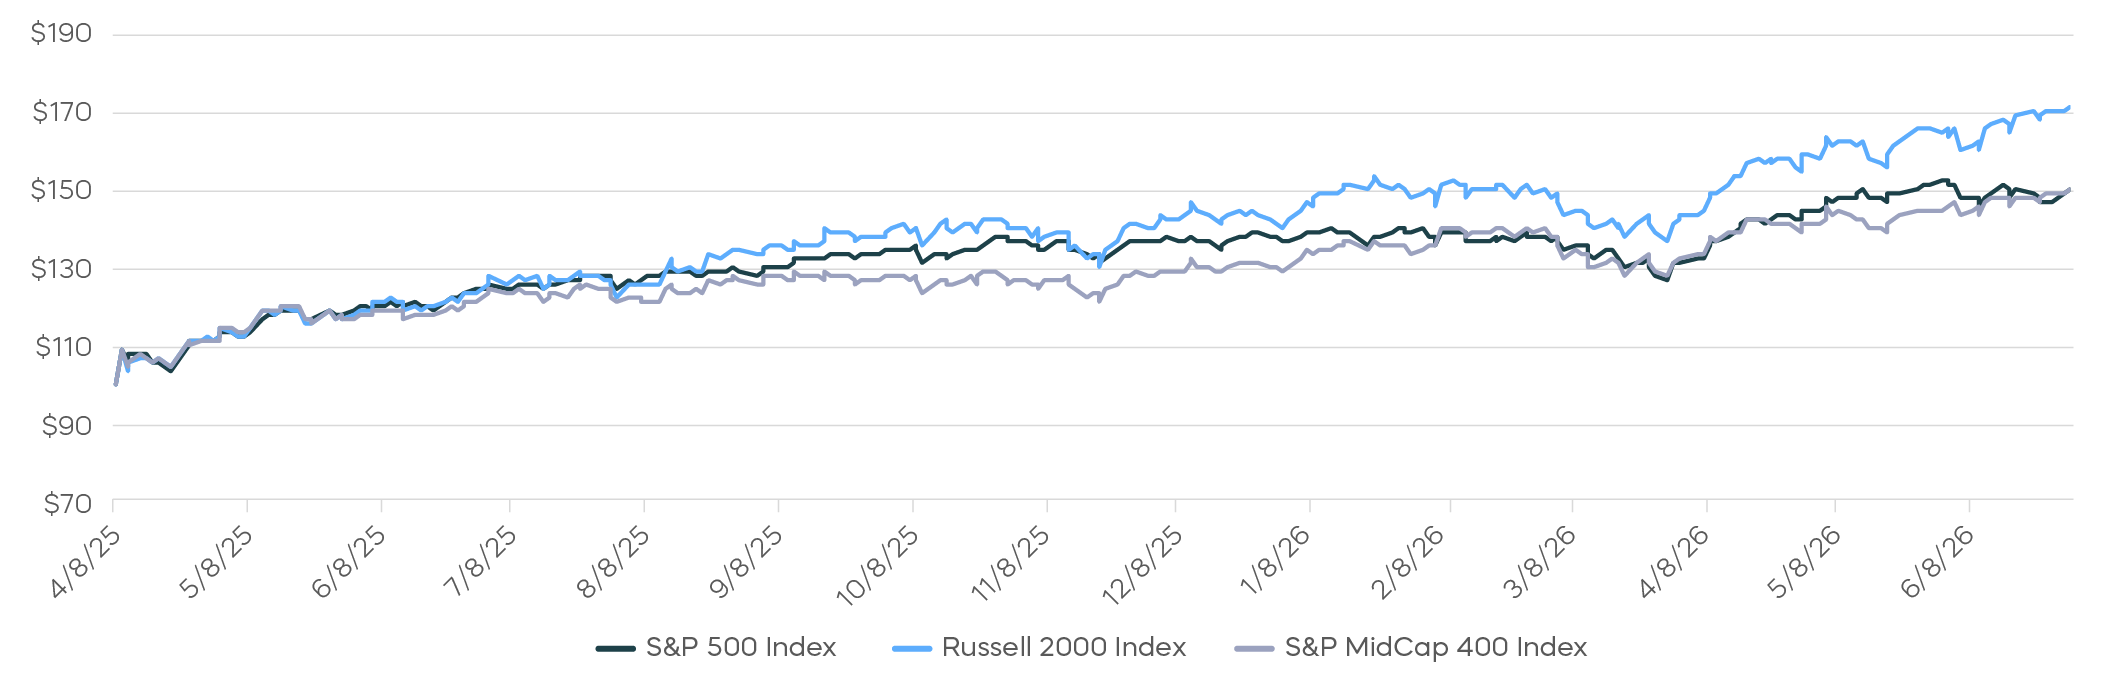
Source: Bloomberg. Data from April 8, 2025 to 6/30/26. Index returns are for illustrative purposes only and do not reflect any management fees, transaction costs or expenses. Indexes are unmanaged, and one cannot invest directly in an index. Past performance does not guarantee future results.
Fundamentals offer a good explanation for the broadening performance. While blowout first quarter earnings were led predominantly by Nasdaq-100 stocks, consensus estimates for the remainder of calendar year 2026 suggest low- to mid-teens growth for names outside of the Mag 7 and for smaller stocks. This is notable because there was little earnings growth for the S&P 493 (the S&P 500 minus the Mag 7) in 2025, and small caps have been in an earnings recession dating back to 2024.[6]
We’ve seen a broadening earnings picture in 2026
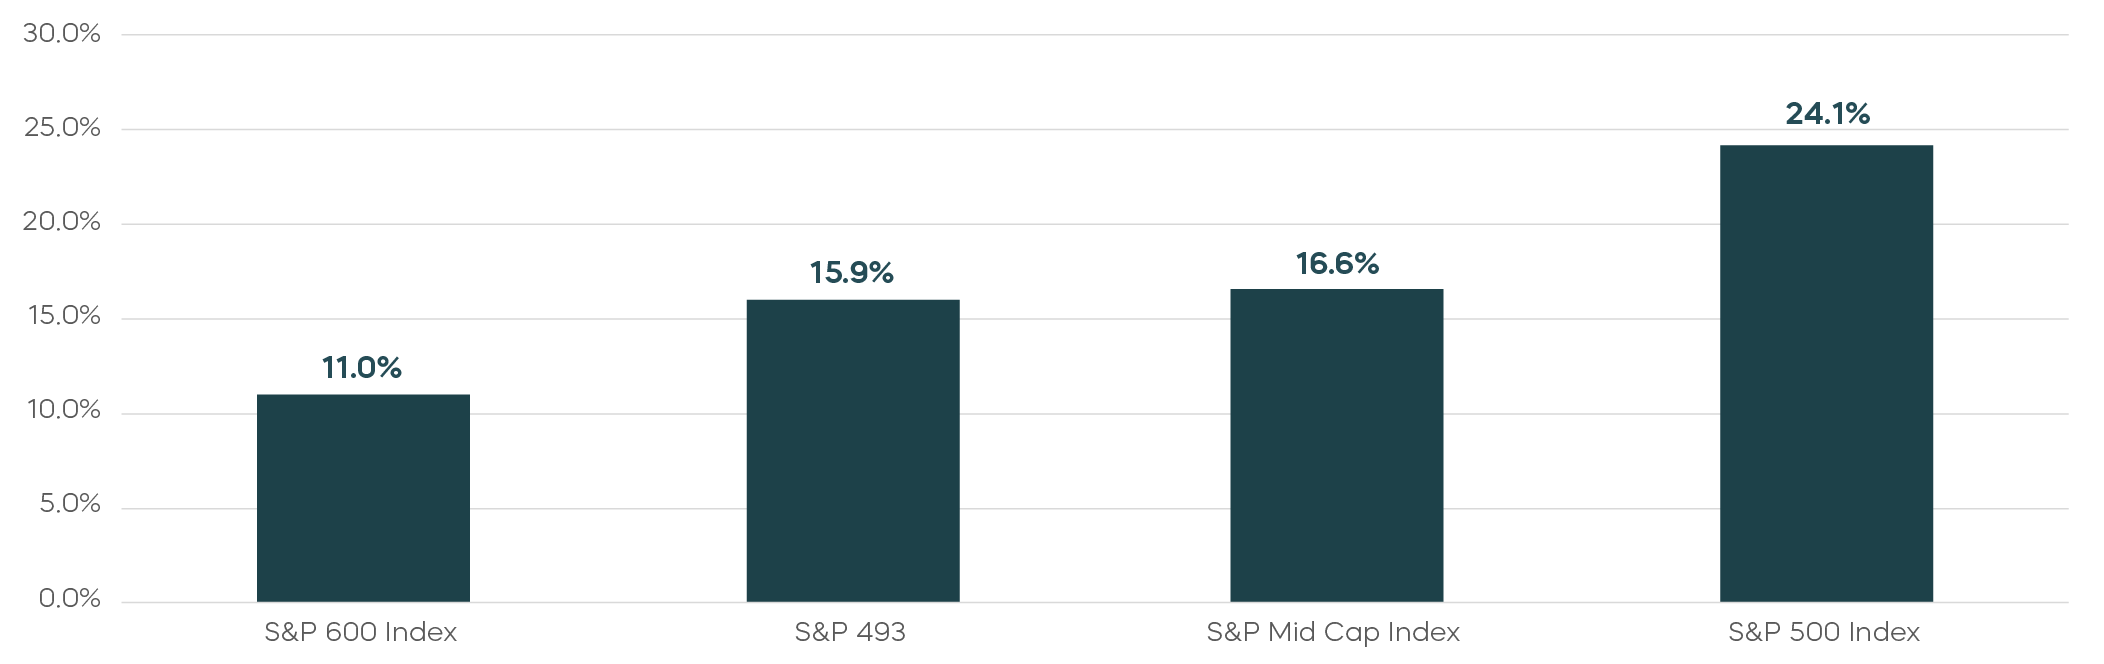
Source: FactSet. Data as of 7/2/2026. Index returns are for illustrative purposes only and do not reflect any management fees, transaction costs or expenses. Indexes are unmanaged, and one cannot invest directly in an index. Past performance does not guarantee future results.
This type of broadening has historically been consistent with sustainable bull markets. Rather than relying on continued multiple expansion among a narrow group of companies, broader participation typically reflects improving profitability across a larger share of the economy.
Is elevated stock dispersion also creating opportunities in 2026?
We have highlighted in previous commentaries that stock dispersion levels, the gap between the best and worst performing stocks, have been high. High-dispersion environments tend to coincide with lower average stock correlations and may provide an increased opportunity for focused stock selection and factor-driven strategies to outperform broader benchmarks.
There is a historically high gap between factor leaders and laggards
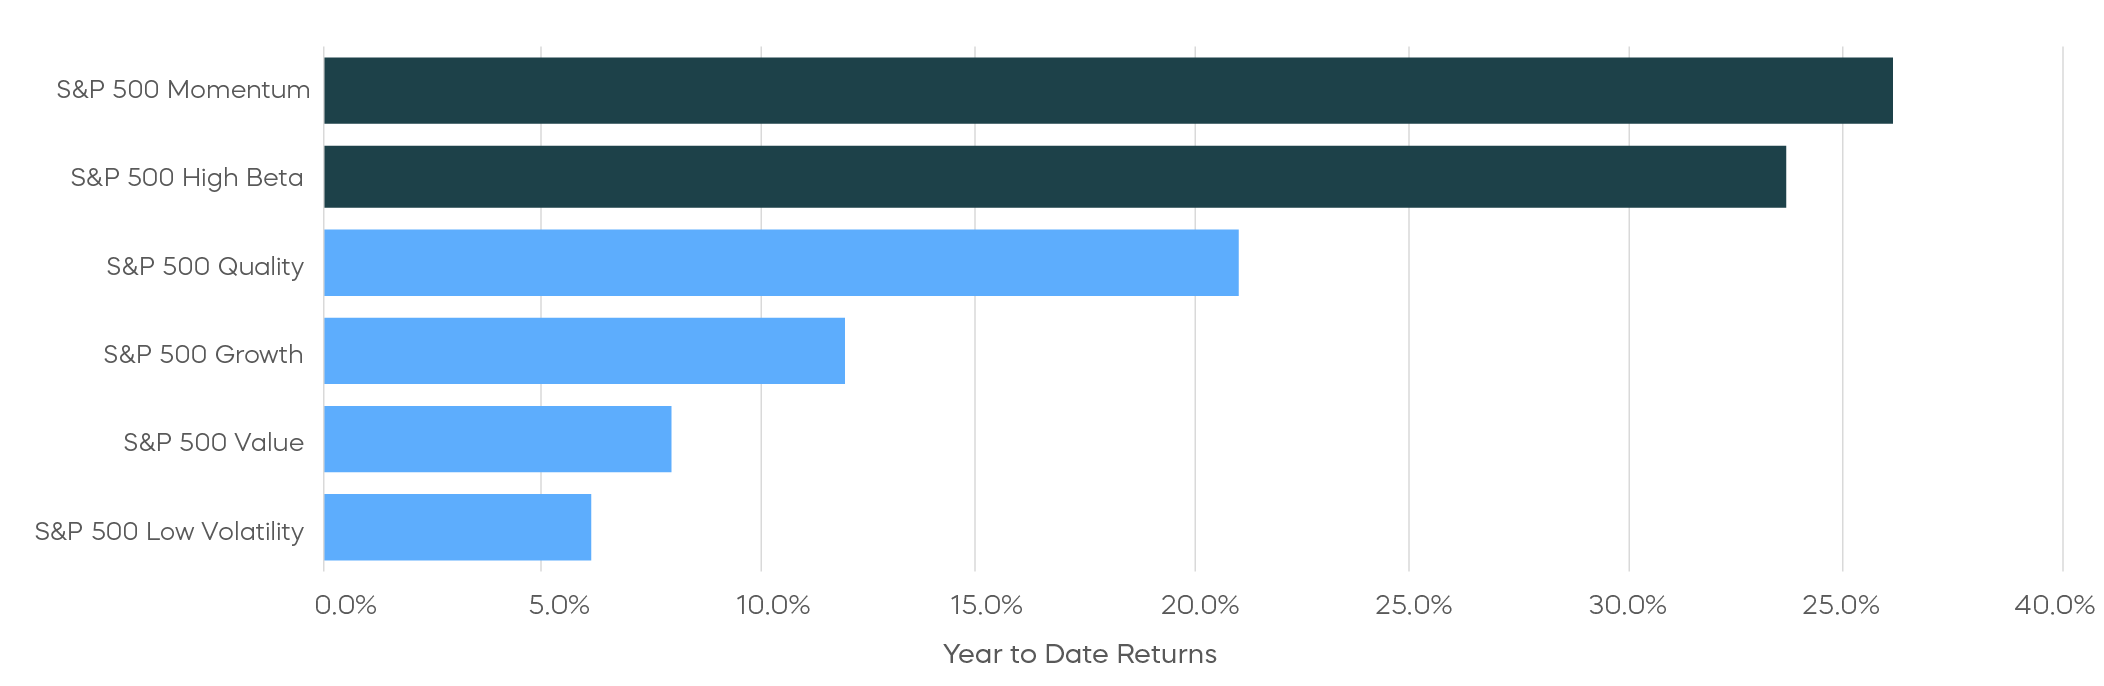
Source: Morningstar. Data from 1/1/26 to 6/30/26 Index returns are for illustrative purposes only and do not reflect any management fees, transaction costs or expenses. Indexes are unmanaged, and one cannot invest directly in an index. Past performance does not guarantee future results.
As the chart shows, the momentum factor has been a clear leader so far in 2026, while more defensive or lower volatility strategies have lagged. The implication for the second half seems clear: if high dispersion levels continue, broad market exposure alone may not fully capture the opportunities available. Companies demonstrating accelerating earnings growth, expanding margins, pricing power, and free cash flow generation might be best positioned to outperform companies with deteriorating fundamentals.
Where are the potential opportunities in the second half of 2026?
- Consider equity income.
- With fixed income headwinds, covered call strategies that use daily options, like the S&P 500 Daily Covered Call Index and the Cboe Russell 2000 Daily Covered Call Index, may be relevant for investors seeking income and equity market participation.
- Look for disciplined capital management. As investors question the scale of AI capex, companies that consistently return capital to shareholders through dividends and buybacks may stand out.
- The S&P 500 Dividend Aristocrats Index equally weights stocks with a history of at least 25 consecutive years of dividend growth.
- The S&P 500 Buyback Aristocrats Index equally weights stocks that have bought back their shares for at least 10 consecutive years.
- Consider factor-specific strategies with the potential to outperform broad benchmarks.
- The Nasdaq-100® Dorsey Wright Momentum Index offers an equally weighted approach to the momentum opportunity and may reduce concentration risk.
Fixed Income Perspectives

How can a multi-asset view on credit benefit investors today?
Amid geopolitical conflict and the software sell-off in the first half of the year, credit remained surprisingly resilient. Spreads widened briefly near the end of the first quarter but quickly returned to historically tight levels. While tight spreads may limit the opportunity for further price gains, many bond investors have focused on all-in yield, taking comfort that even if spreads don’t tighten further, they are earning a relatively attractive coupon. But investors may also need to consider a potentially late cycle environment.
In such an environment, it may be beneficial to view credit through a multi-asset lens. And research shows that macro regimes can influence how asset classes and risk premiums perform. One such research framework classifies stages of the business cycle by the level and change of economic growth (de Longis and Ellis, 2023). Duration tends to outperform during economic contractions, while credit outperforms the most in the initial recovery from a downturn, when spreads retighten after having widened sharply in recession. The prolonged expansion that follows, by contrast, typically delivers little further spread tightening.
A simple yet effective way to gauge current macro conditions is to measure GDP and unemployment against their potential, using estimates published by the Congressional Budget Office. The output gap has been positive for the past couple of years, indicating an economy running above trend. The labor market, however, has gradually lost some of its post-pandemic tightness, with unemployment drifting up toward its estimated natural rate. Growth that has run above trend for some time but is slowing from those levels typically corresponds to a late-cycle environment.
A potentially late-cycle macro condition may be emerging
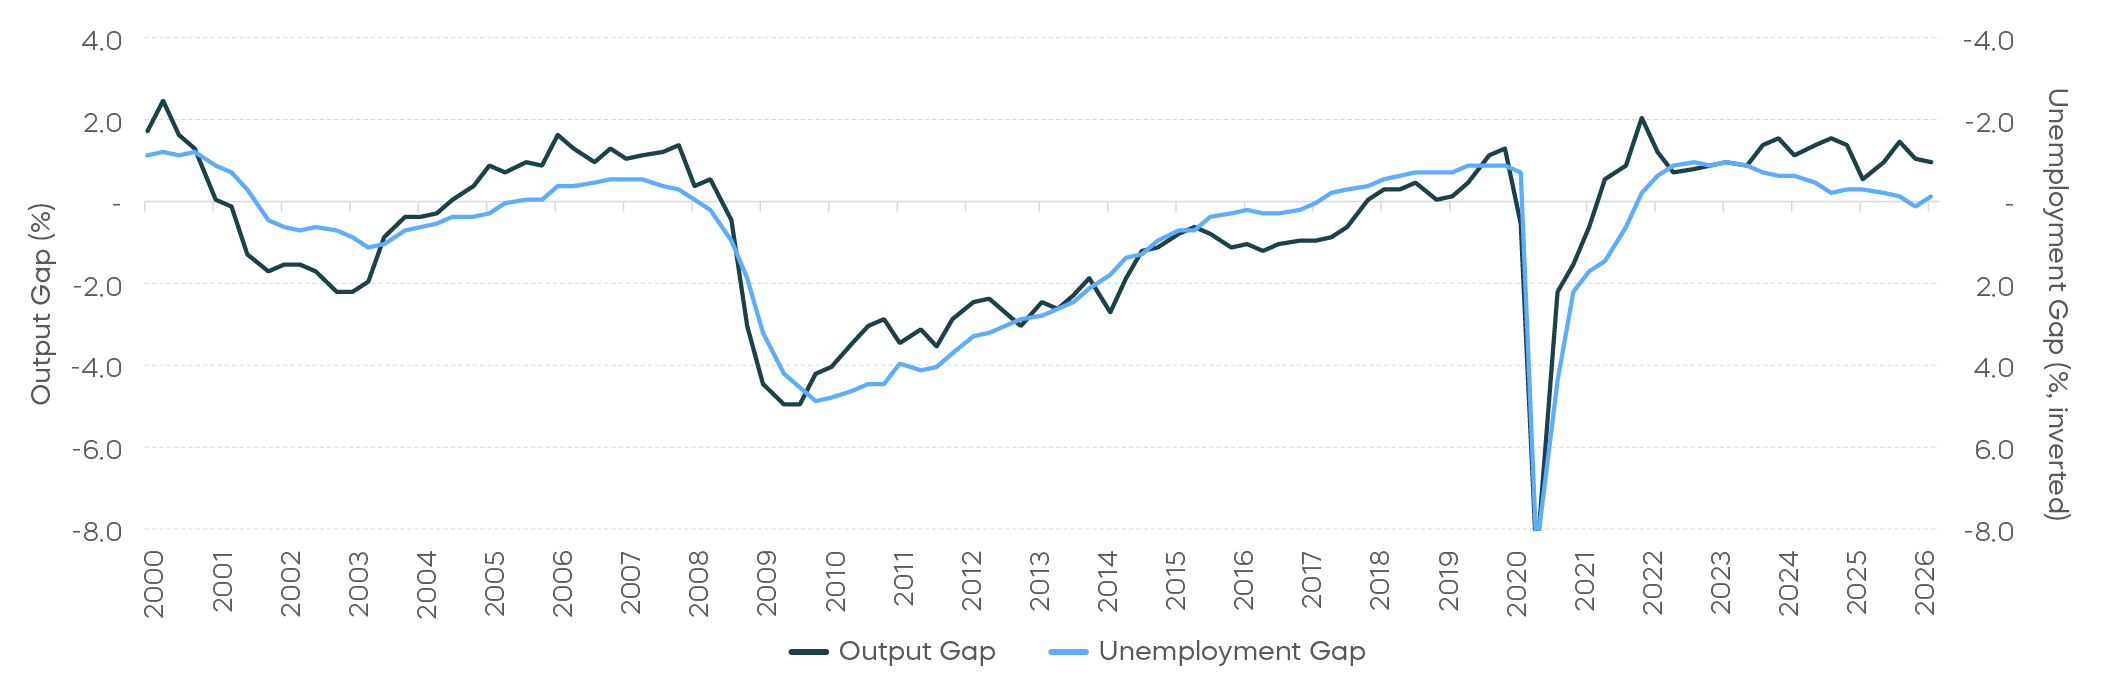
Source: Congressional Budget Office, BLS, BEA; GDP data through Q1 2026, unemployment through Q2 2026.
The current regime has two implications:
- First, fixed income may be driven more by carry than by further spread tightening. And although duration has historically performed well as the cycle decelerates, a sharp contraction looks unlikely to us in the near term, while the AI-driven rise in the neutral rate can work against long-term rates.
- Second, while credit tends to generate stable returns in this environment, it may underperform other assets. Equities, for example, have historically delivered returns above their long-run average deep into an expansion and even into the early stages of a slowdown.
For multi-asset investors, that relative-return pattern argues for treating credit as an underweight at this stage of the cycle. Of course, given the strong AI capital expenditure boom, further growth and spread tightening remain possible. But the aggregate may be masking underlying weakness in the rest of the economy, which still accounts for the bulk of the borrowing in the credit market.
In aggregate, U.S.-domiciled nonfinancial investment-grade issuers have been growing profits above trend, largely thanks to outsized earnings growth among a small number of semiconductor companies. In addition, AI beneficiaries extend well beyond semiconductors, and the hyperscalers alone account for nearly half of the profit growth in the ex-semiconductor cohort. The median investment grade issuer, a better reflection of companies that are not part of the AI rise, is growing EBITDA below its historical averages. In other words, much of the economy may be already past peak profit growth, and that can be the kind of environment in which credit tends to lag other asset classes.
The median investment grade issuer may be past peak profit growth

Source: Bloomberg, ProShares calculations. Based on Bloomberg U.S. Corporate Index universe, 570 nonfinancial U.S. investment grade issuers as of 2Q26, 428 with reported EBITDA history.
Is AI-related debt creating investment opportunities?
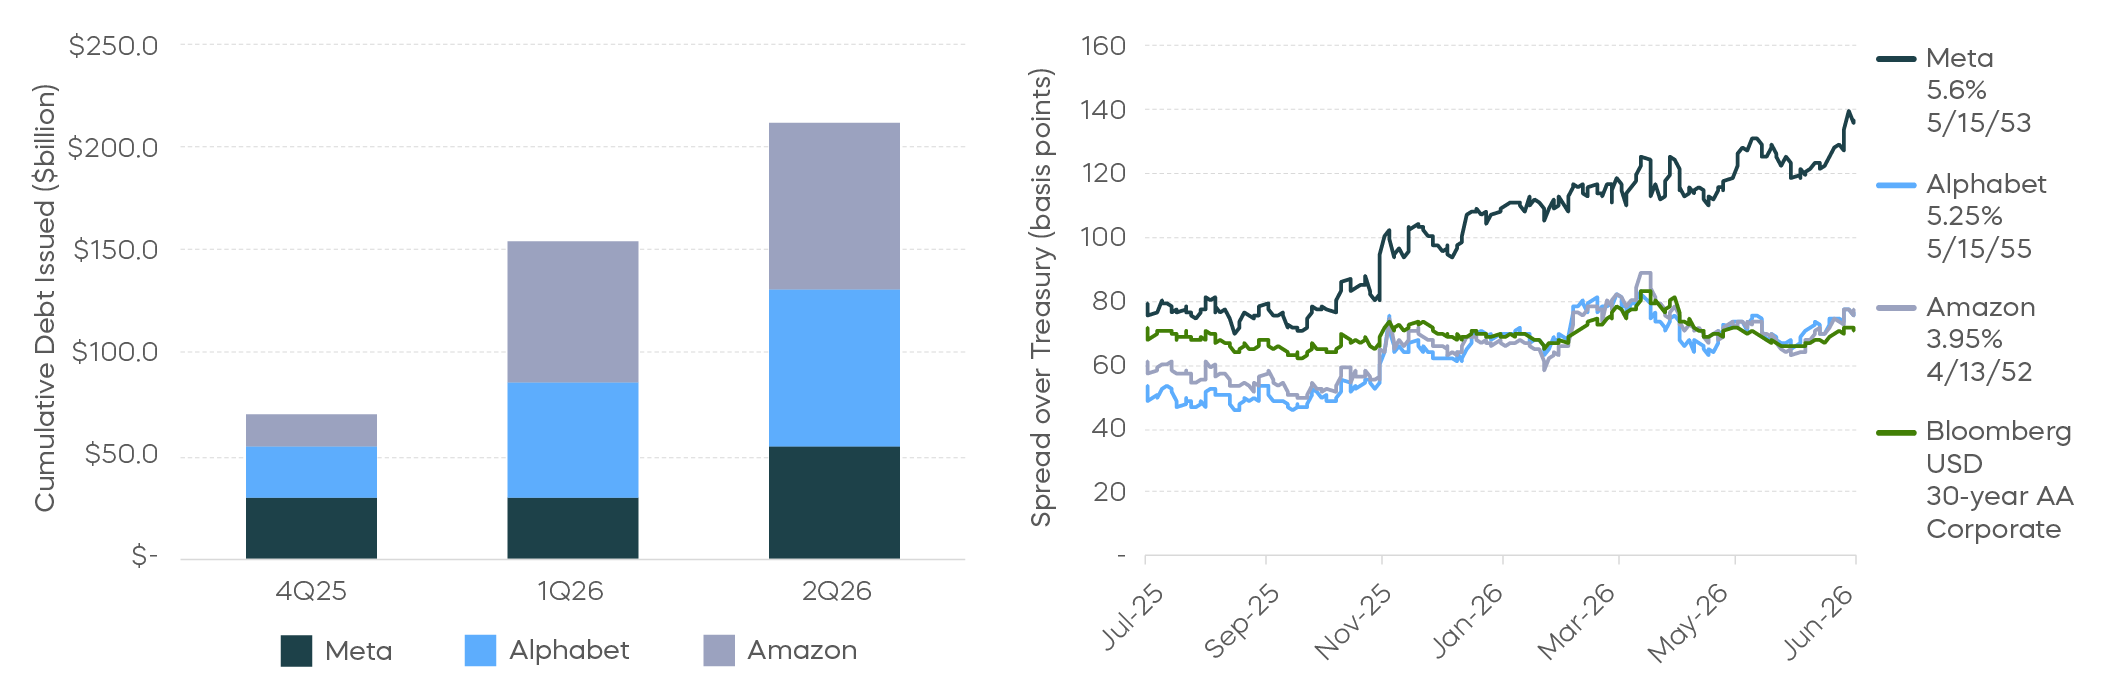
Although most of today’s credit market remains tied to the broad economy, AI is creating some unique opportunities. In a capex boom, profits accrue immediately to the suppliers of the buildout, while the cost to those financing it is spread over years of depreciation, a timing mismatch that can itself help sustain the boom. The One Big Beautiful Bill (OBBB) added a tax incentive in the form of bonus depreciation, front-loading the tax shield and improving near-term cash flow for firms investing in AI. Against this backdrop, several U.S. hyperscalers that have historically generated strong free cash flow have now turned to the debt market at scale, some for the first time ever. Since the fourth quarter of last year, Meta, Alphabet, and Amazon have collectively issued more than $200 billion of investment-grade debt in the public market (Bloomberg, as of 6/30/26), and more may be on the way.
The magnitude and the pace of such financing may be difficult for the market to digest quickly. Investors have demanded more compensation from these borrowers who, until recently, carried barely any leverage. Long-dated hyperscaler bond spreads have widened over the past year, even as spreads on comparable long-dated, high-quality corporate bonds were little changed. Part of that demanded compensation is structural: bondholders may not participate much in the upside of the AI buildout, but are exposed to the added leverage if the investment disappoints.
We think this view misses a key distinction. Through a cash flow lens, AI spending looks aggressive. But AI capex is not merely growth spending; it is also a strategic hedge against technological displacement. For bondholders, that could reduce the risk that today’s business models become obsolete, while the existing businesses continue to generate massive cash flow. As a result, investors could effectively collect wider spreads than comparably rated bonds by lending to some of the most profitable companies today.
Hyperscaler spreads are under pressure
Has AI replaced geopolitics as the long-term driver of rates?
Rates rose earlier this year as inflation expectations increased in response to conflict in the Middle East. Since then, inflation expectations have eased, yet nominal yields have stayed high and rangebound as real yields have risen. The reopening of the Strait of Hormuz has played a role, but the move higher in real rates may suggest that the true driver of rates has shifted from geopolitics to AI adoption and its implications.
Historically, energy has been a poor predictor of future inflation. Oil prices mechanically feed into headline CPI in the near term, but the relationship weakens over longer horizons. And since persistent inflation is what matters most to markets and policymakers, oil’s near-term impact on inflation is statistically significant but economically much less meaningful. The weak long-term relationship can be seen both through correlation and in terms of explanatory power. Adding oil to a baseline autoregressive inflation model contributes almost no incremental R-squared beyond the six-month horizon. Interestingly, the pass-through from oil to core inflation is more persistent, but small in magnitude, so only a genuine oil shock is likely to change the inflation outlook durably. With oil prices declining toward pre-conflict levels, oil-driven inflation concerns should ease as well. Yet the market has been simultaneously marking down its inflation expectations and marking up its policy rate expectations. The rates market could be responding to something else: this year’s acceleration in AI adoption.
Oil tells you little about the type of inflation that matters
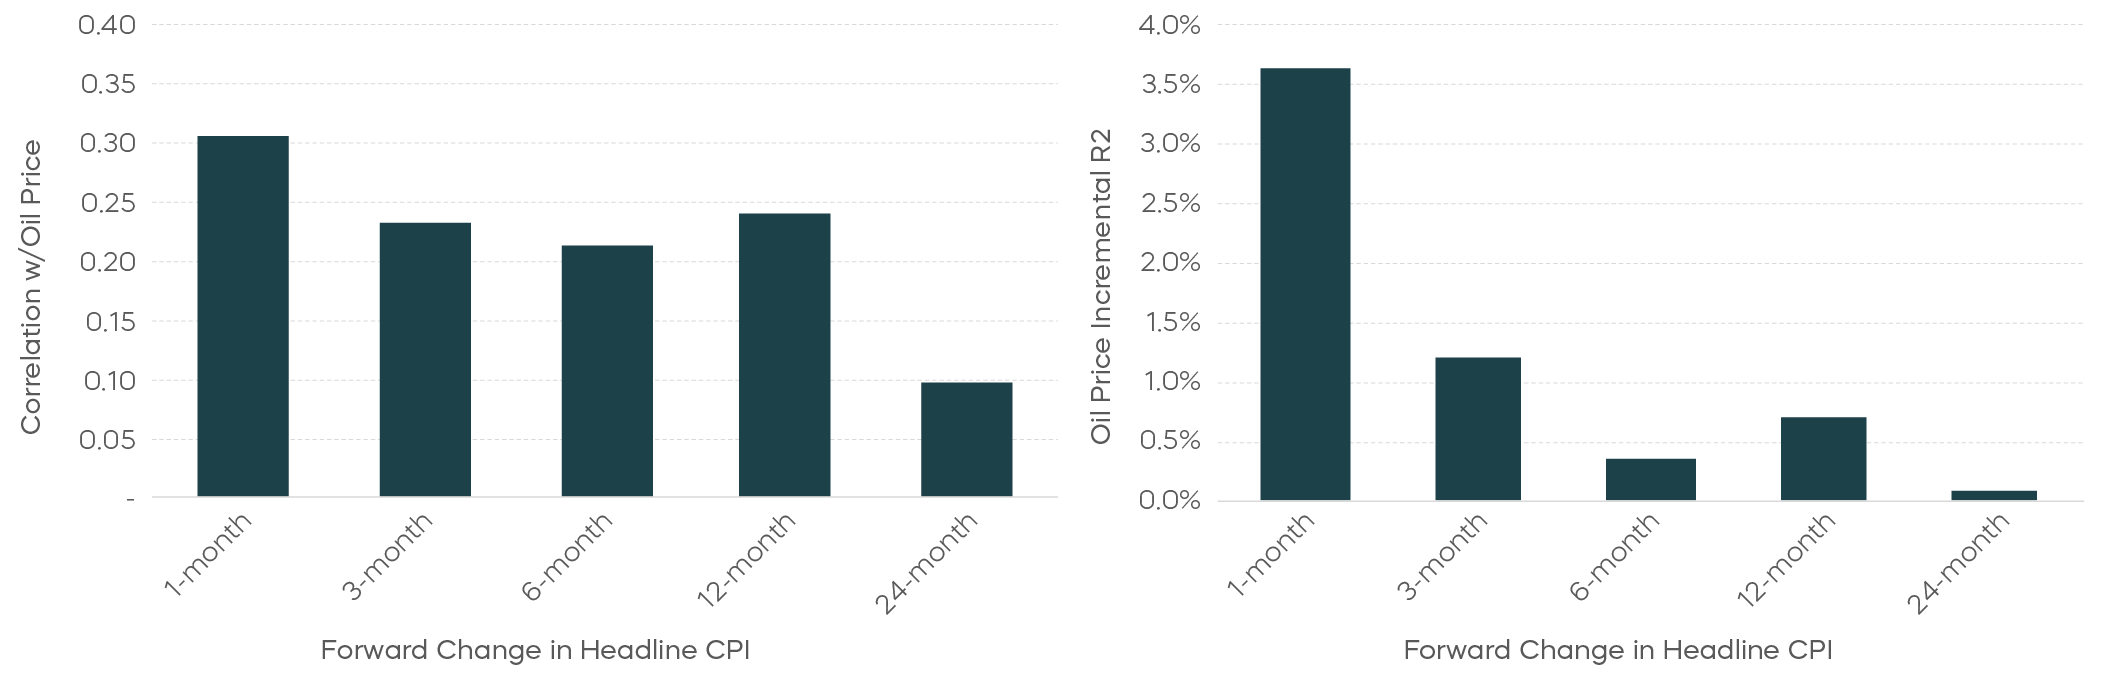
Source: Bloomberg, ProShares calculations. January 1989 through May 2026.
How are the drivers of the AI buildout influencing rates?
AI adoption has entered a new phase this year, driven by improvements in agentic coding systems. Anthropic reported that its run-rate revenue crossed $47 billion by the end of May, far exceeding prior expectations. Leading AI labs have long envisioned a self-reinforcing loop in which AI accelerates AI research itself. Whether that plays out remains to be seen, but a breakout capability that translated into rapid revenue growth has only strengthened the conviction of those behind the massive AI investments.
A capex boom of this scale typically raises the cost of capital and lifts interest rates, and the sequencing matters. In the initial buildout phase, demand shock could dominate: massive capex and anticipatory spending reduce savings while raising investment demand, lifting equilibrium rates and the real neutral rate (R*). That could help explain the significant rise in front-end real yields despite easing oil prices and fading inflation expectations.
Over time, however, AI could deliver a meaningful positive supply shock. If AI realizes its promised productivity gains and becomes a sustained source of disinflation, it could lift the real neutral rate without raising long-term yields, as the inflation risk premium compresses. The yield curve would likely flatten over the long run, much as it remained flat in the second half of the 1990s when personal computers ushered in a period of persistent productivity gains. The speed at which coding capabilities have taken off suggests AI may deliver productivity gains at larger scale, and faster than most anticipate. But disruption could arrive quickly, too. Productivity gains are unlikely to flow evenly through labor, and large-scale displacement would instead weaken aggregate consumption and raise precautionary savings. Nor is the path of AI development a straight line. Demand-driven inflation and supply constraints, such as the memory chip shortage, already risk impeding progress. With the AI cycle now in the driver’s seat for rates, the range of outcomes is unusually wide.
Regardless of the path, this year’s acceleration in AI development and adoption has, in our view, shifted the rates regime from cuts toward hikes. The Fed, wary of misjudging the productivity gains, has so far opted for careful study via task forces rather than raising rates in response to a potentially higher R*. Ultimately, AI may be a disinflationary force, with both adoption and disruption likely to unfold faster than many investors expect.
1. Source: Bureau of Economic Analysis, 1Q26.
2. Source: Bureau of Labor Statistics, May 2026.
3. Source: Bureau of Labor Statistics, June 2026.
4. Source: Institute of Supply Management, June 2026 ISM Manufacturing PMI Report and June 2026 ISM Services PMI Report.
5. Source: Board of Governors of the Federal Reserve System, May 2026.
6. Source: FactSet, data as of 7/2/26.