Key Observations

At their most recent meeting, the Federal Reserve and Chair Powell told us that the risks of weakening labor and higher inflation had declined. It painted a nice picture of a soft landing, but wasn’t a recipe for immediate rate cuts.
That might not satisfy Fed Chair nominee Kevin Warsh. Warsh is a former inflation hawk who appears to see room for rate cuts, but also wants to shrink the Fed’s balance sheet. That could be a recipe for a steeper yield curve. Rate cuts typically stimulate the economy, but a smaller balance sheet can allow longer-term rates to rise, particularly if that stimulation raises inflation expectations.
Some steepening has already happened. The Fed has been cutting rates and shrinking the balance sheet for some time. The 2-year Treasury yield was roughly 70 basis points lower at the end of 2024, while the 10-year was only 25 bps lower, and the 20-year was virtually unchanged. That amounts to a 2-10 spread that was roughly 50 bps steeper to end 2025—a good steepening. The 10-year yield stayed moored to a long-term inflation expectation of around 2%, which led to its relative stability. A 10-year Treasury yield of around 4% nicely reflects 2% inflation plus a 2% real yield. It also suggests that the current size of the Fed’s balance sheet seems rightsized to be neutral regarding its impact on longer-term rates. The market appears to be doing its job.
The nomination of the well-qualified and experienced Warsh has, for the most part, been well received by markets. But investors should still keep a sharp eye out for the risk of steepening driven by rising longer-term rates. While lower yields could continue on the short end of the spectrum, an increase on the long end could result in a modest sell-off of longer-term bonds. With that potential in place, it could be wise for investors to seek at least some sources of income less impacted by interest rate risk.
How does this impact the stock market? Yields and the economy appear to be in a good place. But if path for longer-term yields continues to be flat to slightly higher, valuations and fundamentals take on heightened importance. That has been one of the drivers of broadening equity market performance so far this year. S&P 500 returns are up over 1% for the month of January, but many slices of the equity market that are less reliant on mega-cap technology stocks have substantially outperformed.
Chart of the Month
Mega-Cap, Tech-Light Market Indexes Have Outperformed in January
Source: Bloomberg. Data as of 1/30/26. Index returns are for illustrative purposes only and do not reflect any management fees, transaction costs or expenses. Indexes are unmanaged, and one cannot invest directly in an index. Past performance does not guarantee future results.
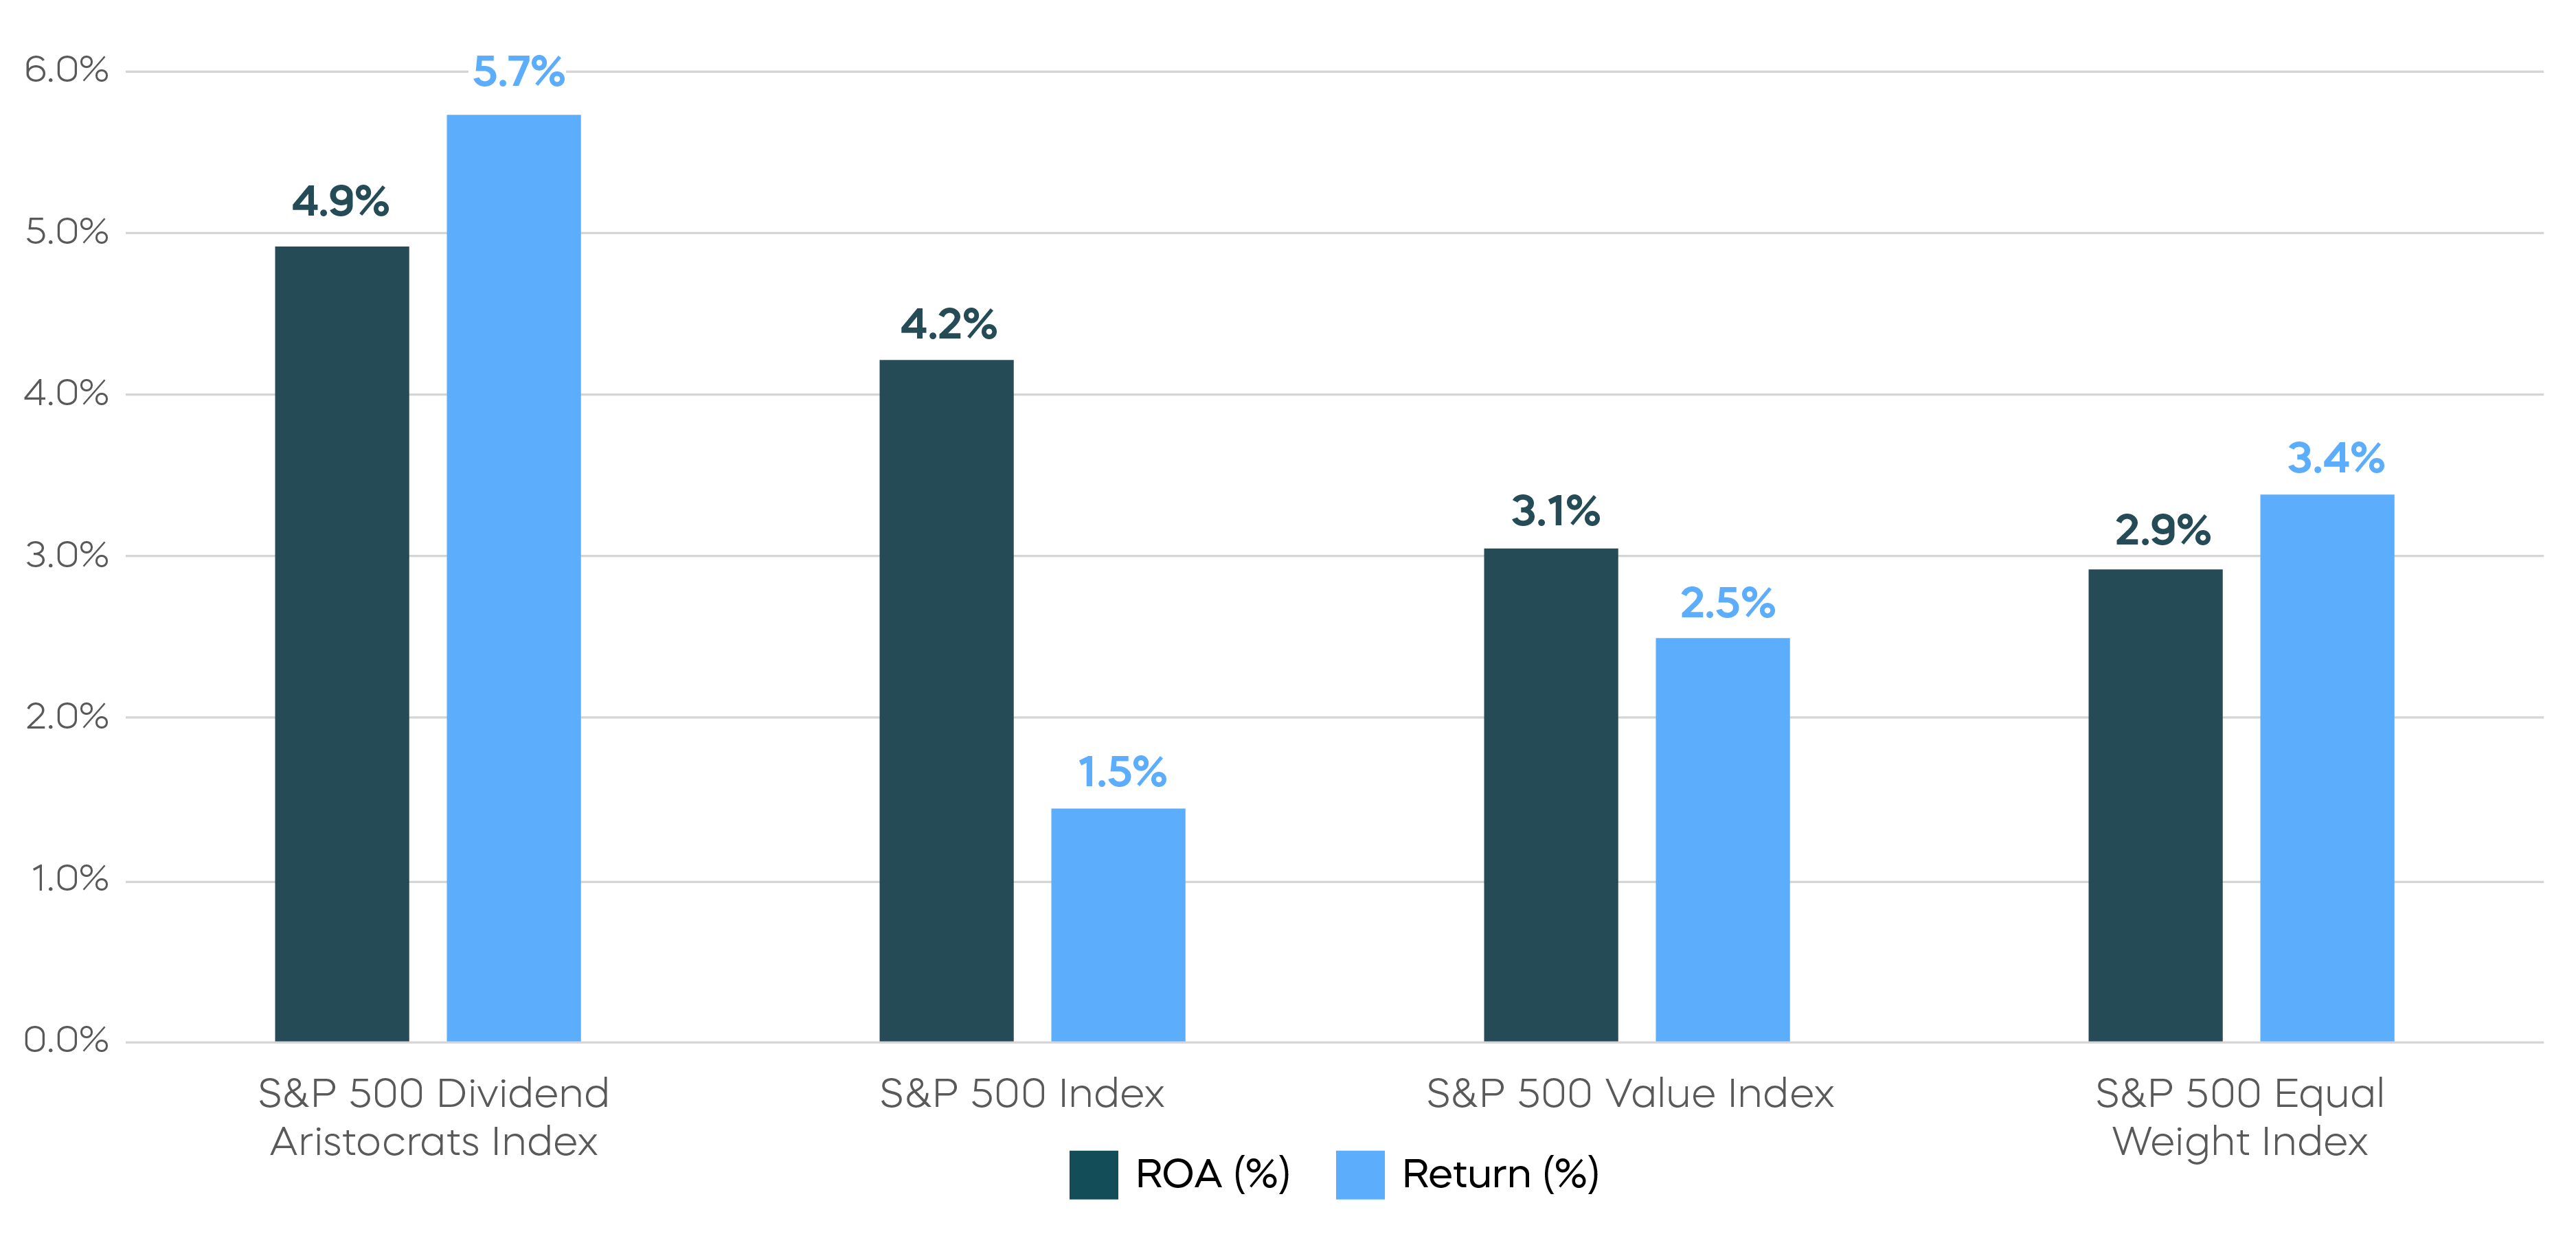
Some approaches may be more durable than others. While equal weighting and value outperformed in January, the outperformance of the S&P 500 Dividend Aristocrats was especially notable. Equal weighting and value can solve for valuation, but they do so somewhat indiscriminately; common indexes for these strategies often exhibit lower quality than the S&P 500. By contrast, the S&P 500 Dividend Aristocrats—without the benefit of Magnificent 7 (and adjacents) cash generation power—managed to generate even higher quality. If valuations are favoring investors at the moment, why wouldn’t you focus on quality at a reasonable price?
Asset Class Perspectives
Asset Class Returns—January/Year-to-Date 2026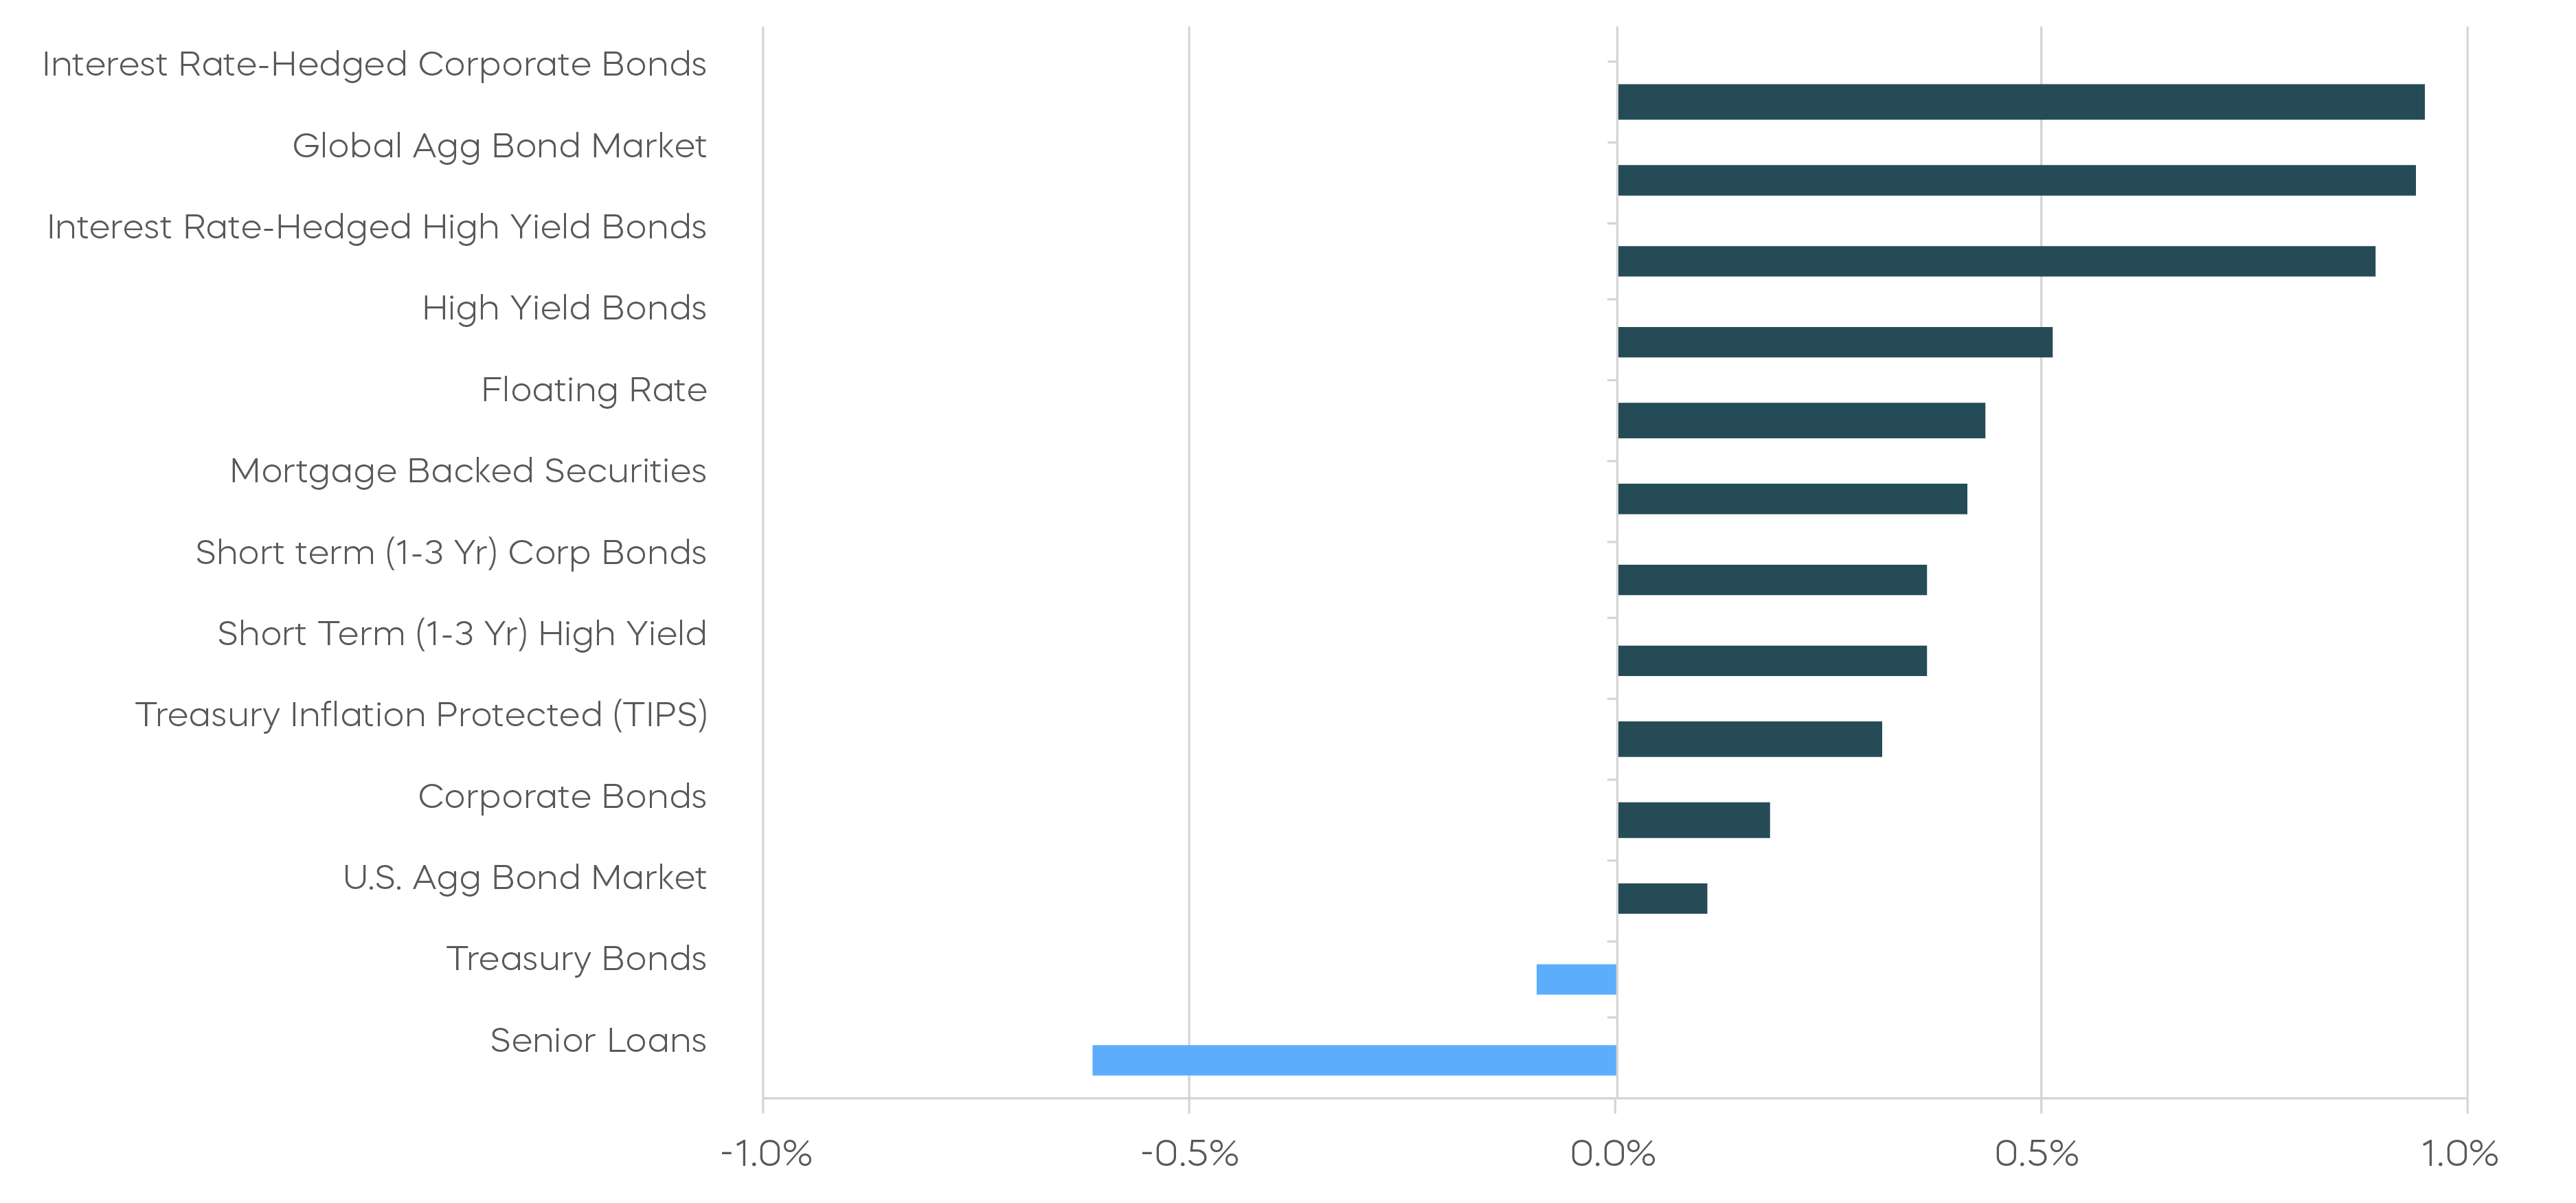
Source: Bloomberg. January/year-to-date returns 1/1/26–12/31/26. Index returns are for illustrative purposes only and do not reflect any management fees, transaction costs or expenses. Indexes are unmanaged, and one cannot invest directly in an index. Past performance does not guarantee future results.
The following are observations on a range of asset classes. For each, green indicates a constructive backdrop, yellow indicates a neutral environment, and red would indicate a challenging backdrop.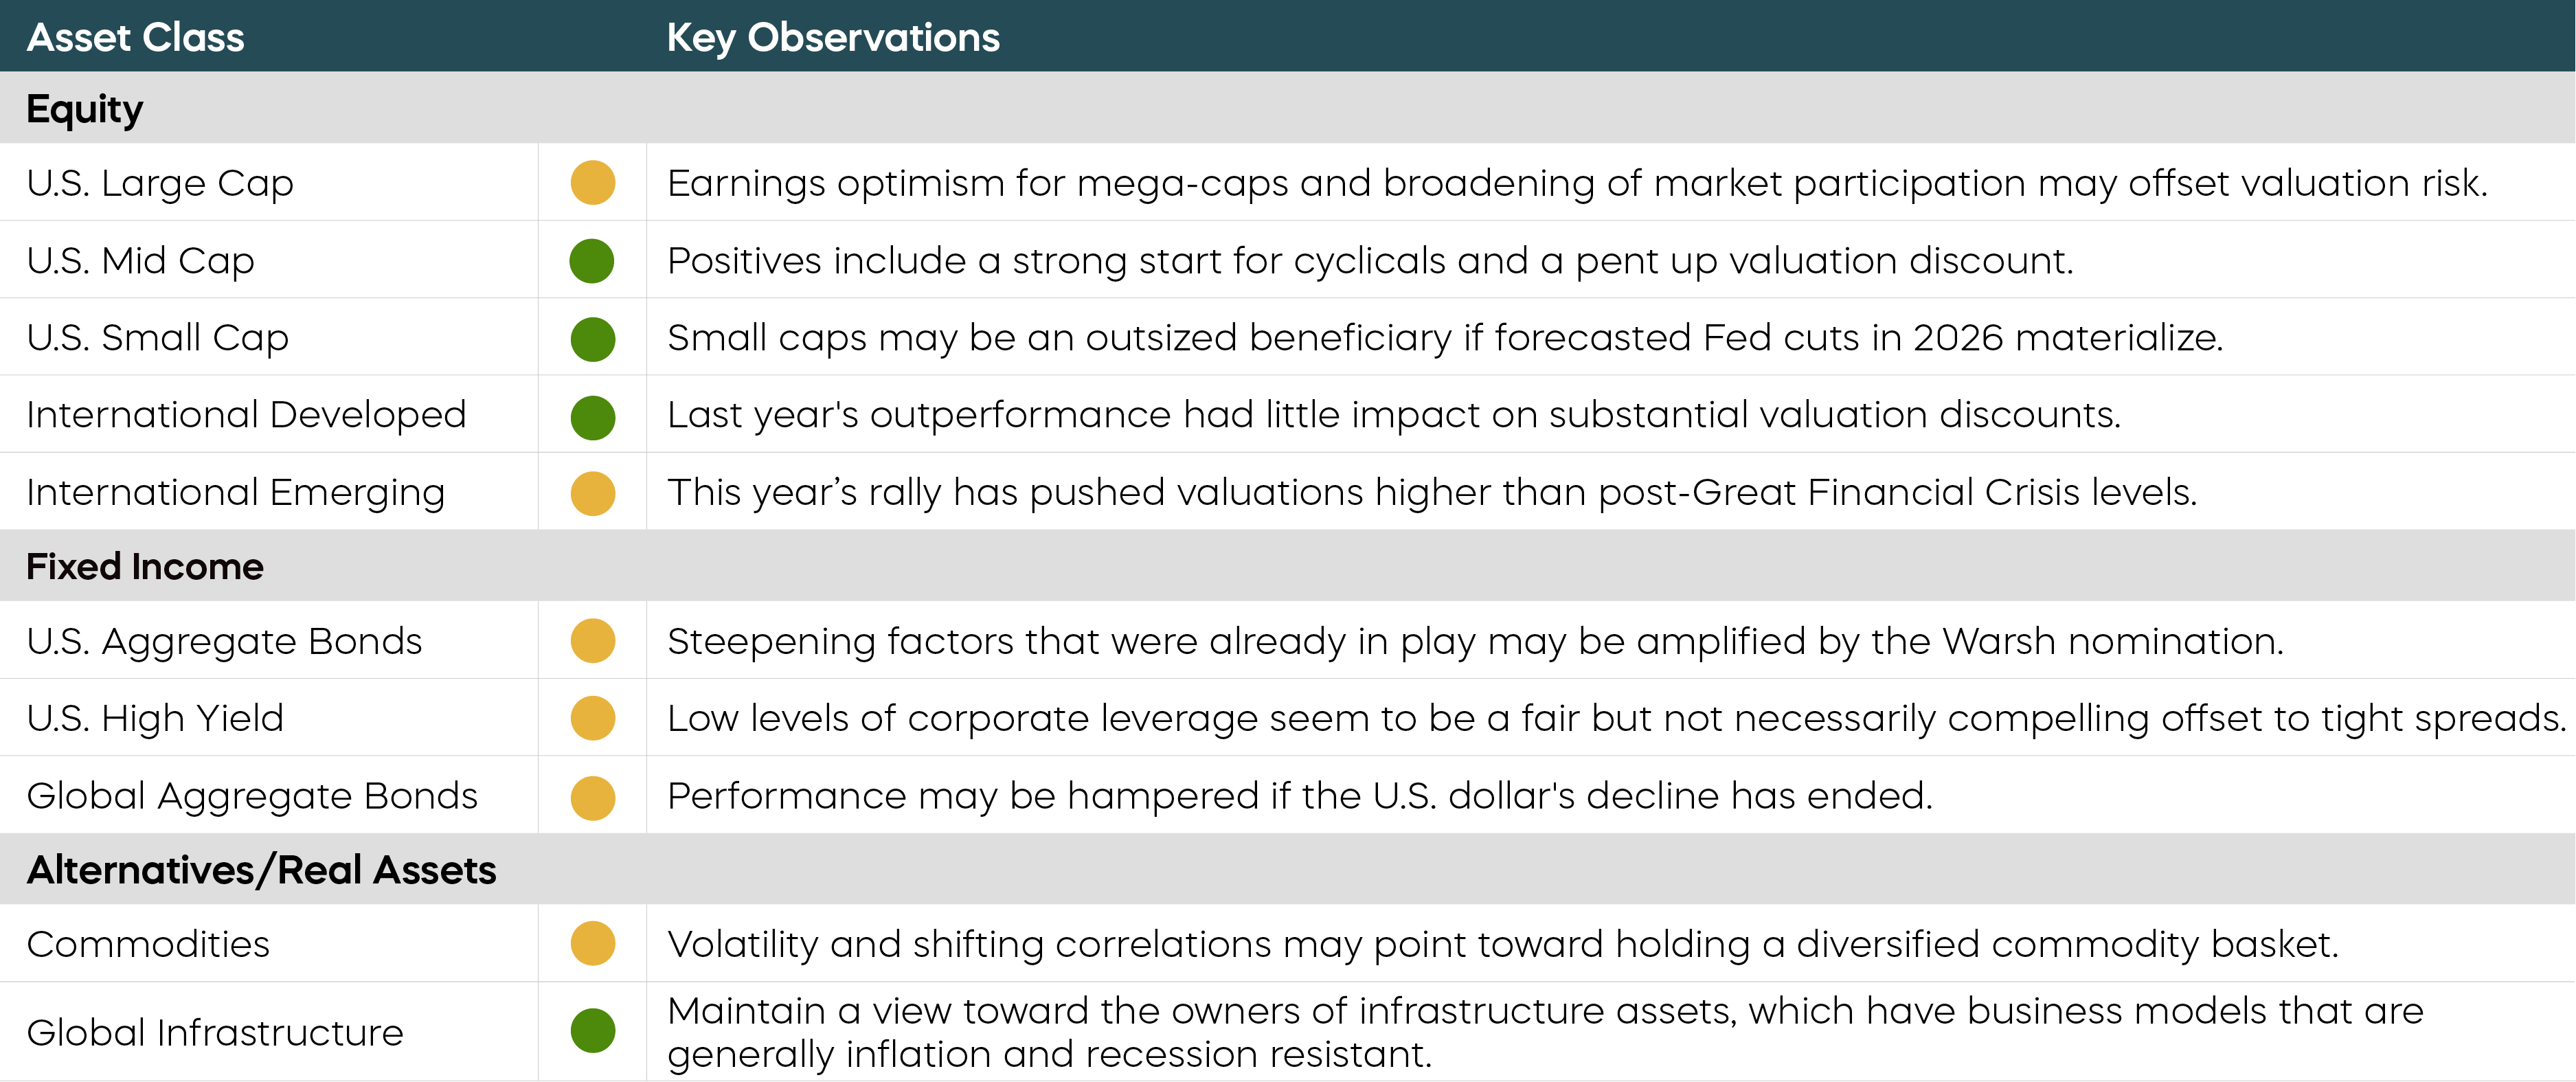
Economic Calendar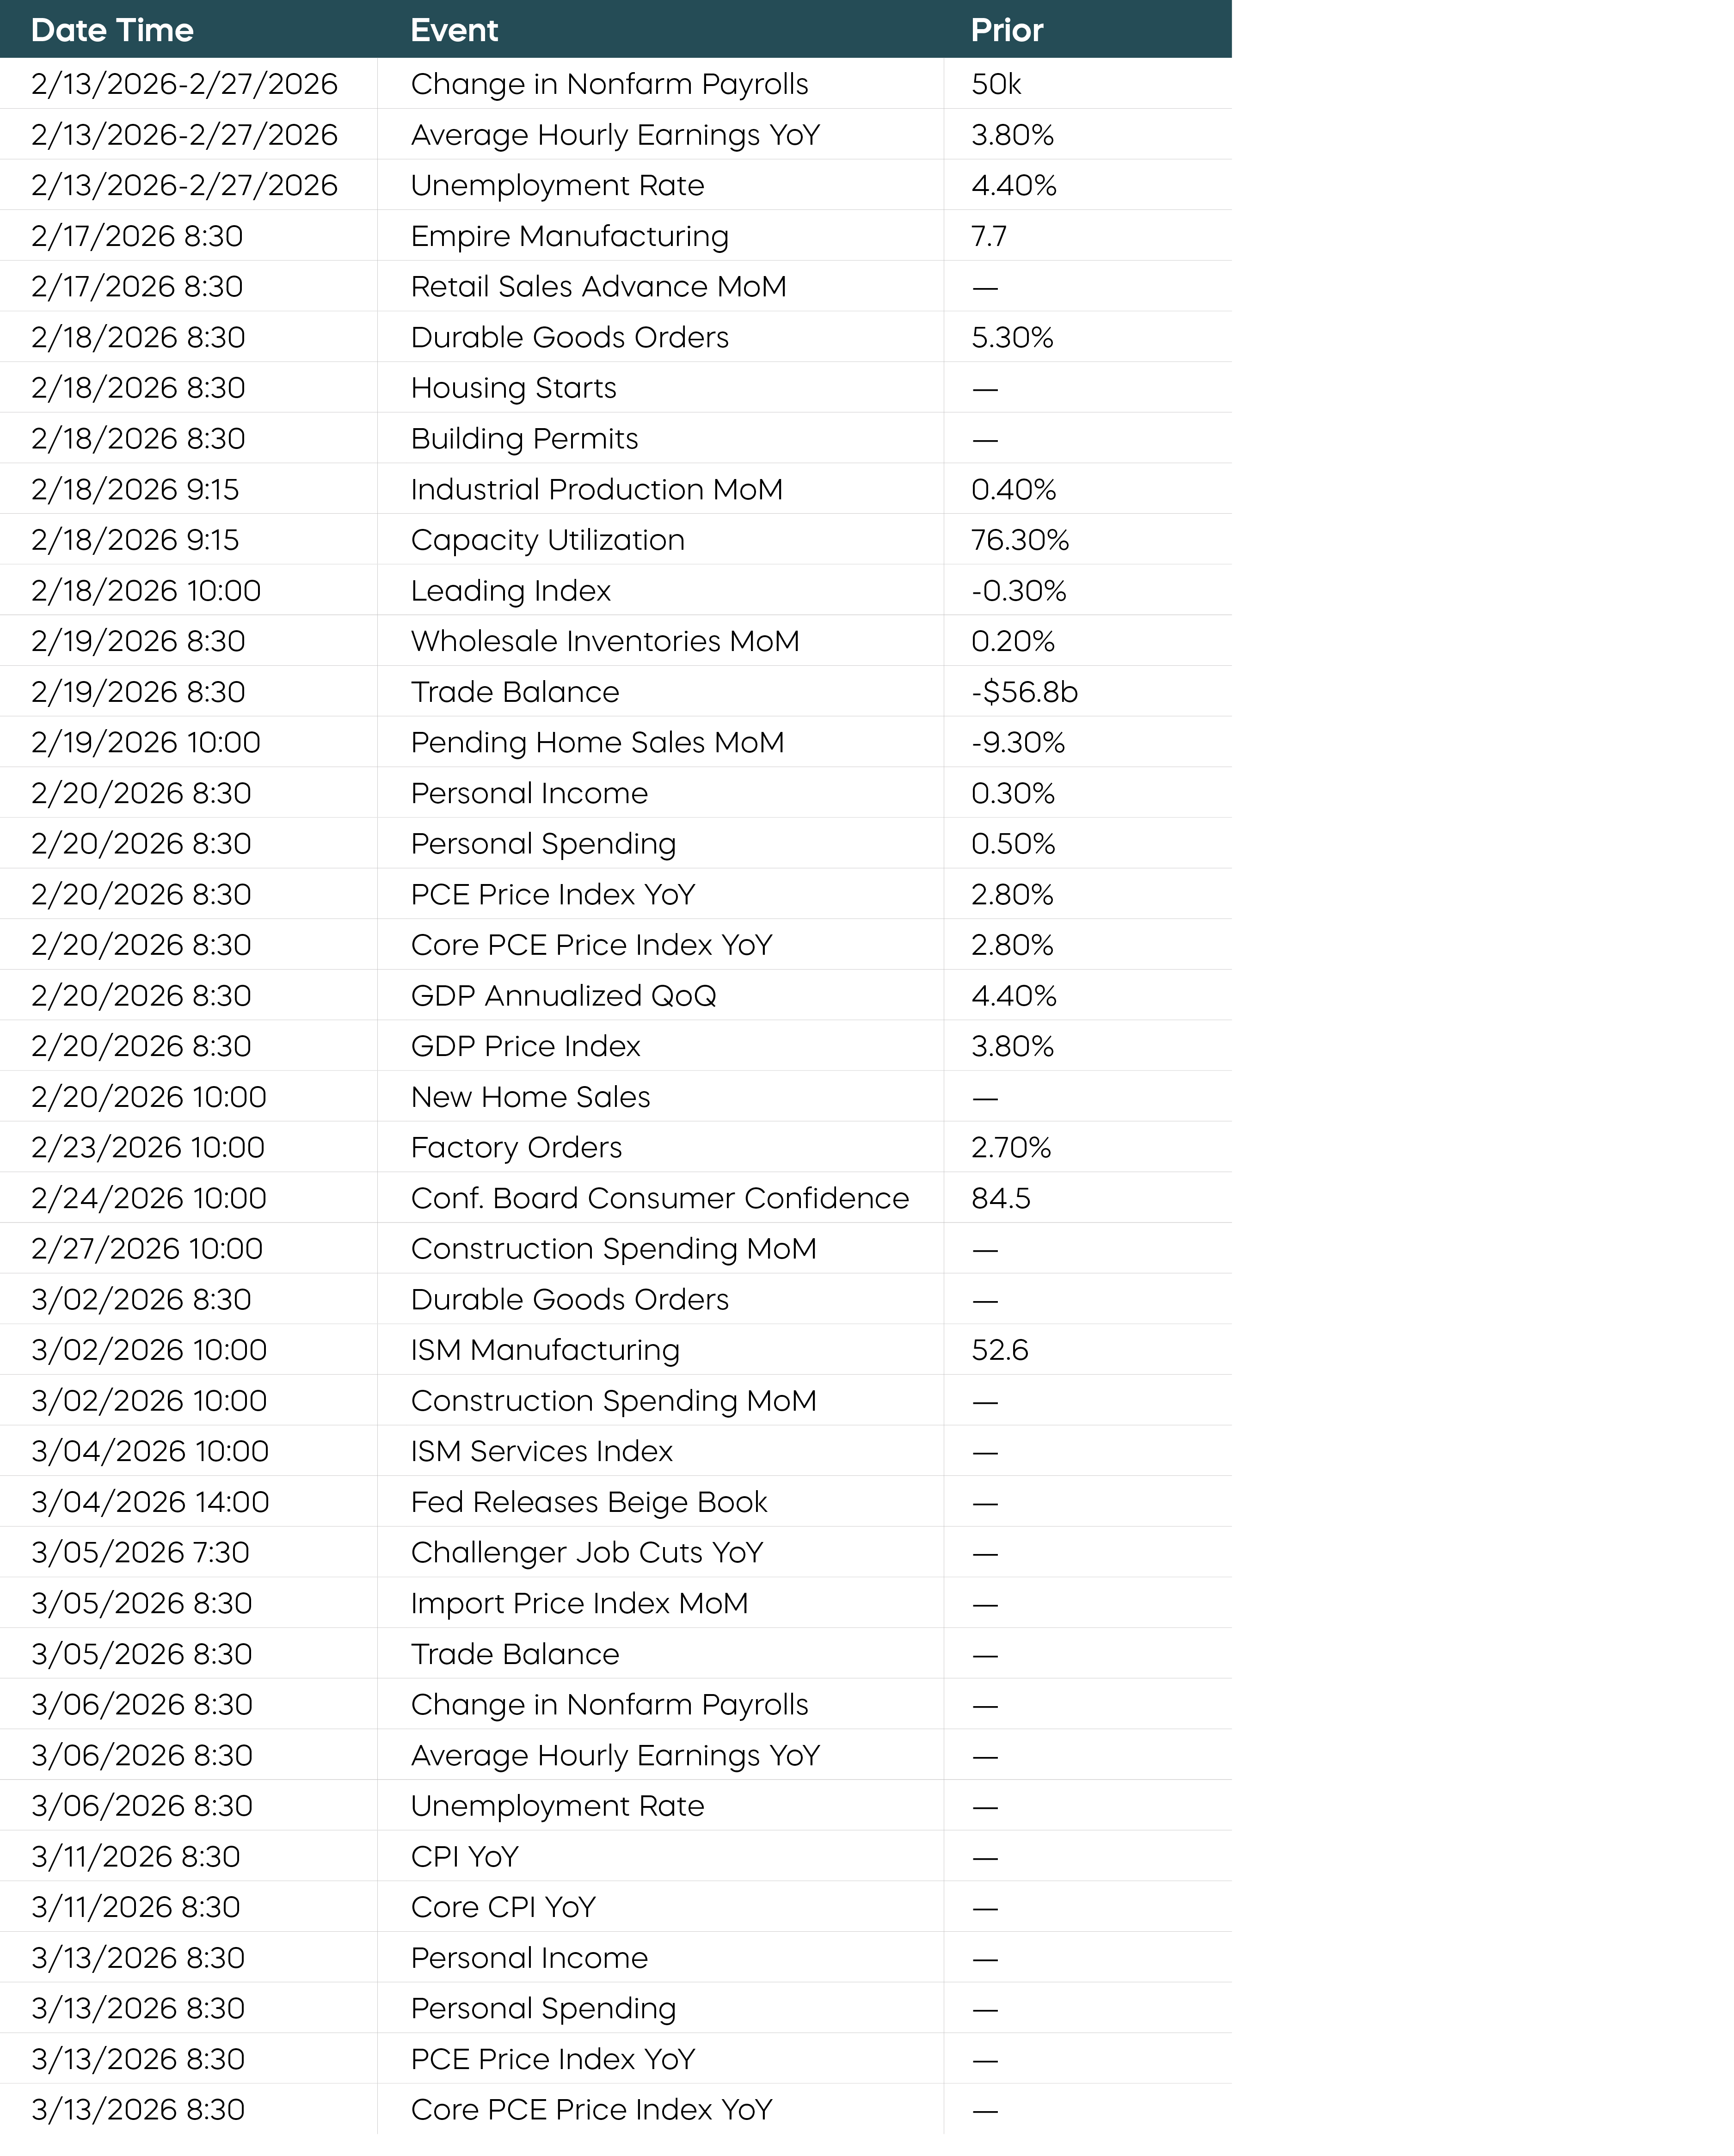
Source: Bloomberg, data as of 2/2/26.
Equity Perspectives

In a Divergent Market, Dividends Dominate
Consistent with the January effect of better-than-average returns, the S&P 500 delivered returns of 1.5%, according to Bloomberg. Despite such a favorable start to the year, there are divergent patterns developing that investors should watch.
Digging deeper into January’s performance data from both Bloomberg and FactSet, we see that small-cap stocks included in the Russell 2000 Index have continued their recent outperformance over large caps, with returns of 5.4% through the end of January. At the sector level, energy stocks produced returns of 14%, while financials stocks declined 2.4%. Technology stocks, long the workhorse of the market, were essentially flat. But even within the tech sector, performance was divergent. Software stocks (measured by the Software & Services sub-sector) continued to struggle in January and are down approximately 16% since June, and Microsoft declined approximately 10% on January 28th despite beating earnings expectations. In contrast, semi-conductor stocks (Semi-conductor sub-sector) continued to move higher.[1]
Meanwhile, dividend strategies like the S&P 500 Dividend Aristocrats were among the strongest performers in January, returning 5.7% according to Bloomberg. This continues a recent run of outperformance from these high-quality dividend growth stocks that began in November 2025. Since that time, both large- and mid-cap Dividend Aristocrat strategies have significantly outperformed growth and momentum factors. In a concentrated market with several divergent patterns, the equally weighted large- and mid-cap Dividend Aristocrats can provide investors with a time-tested strategy.
The Dividend Aristocrats Have Outperformed Since November
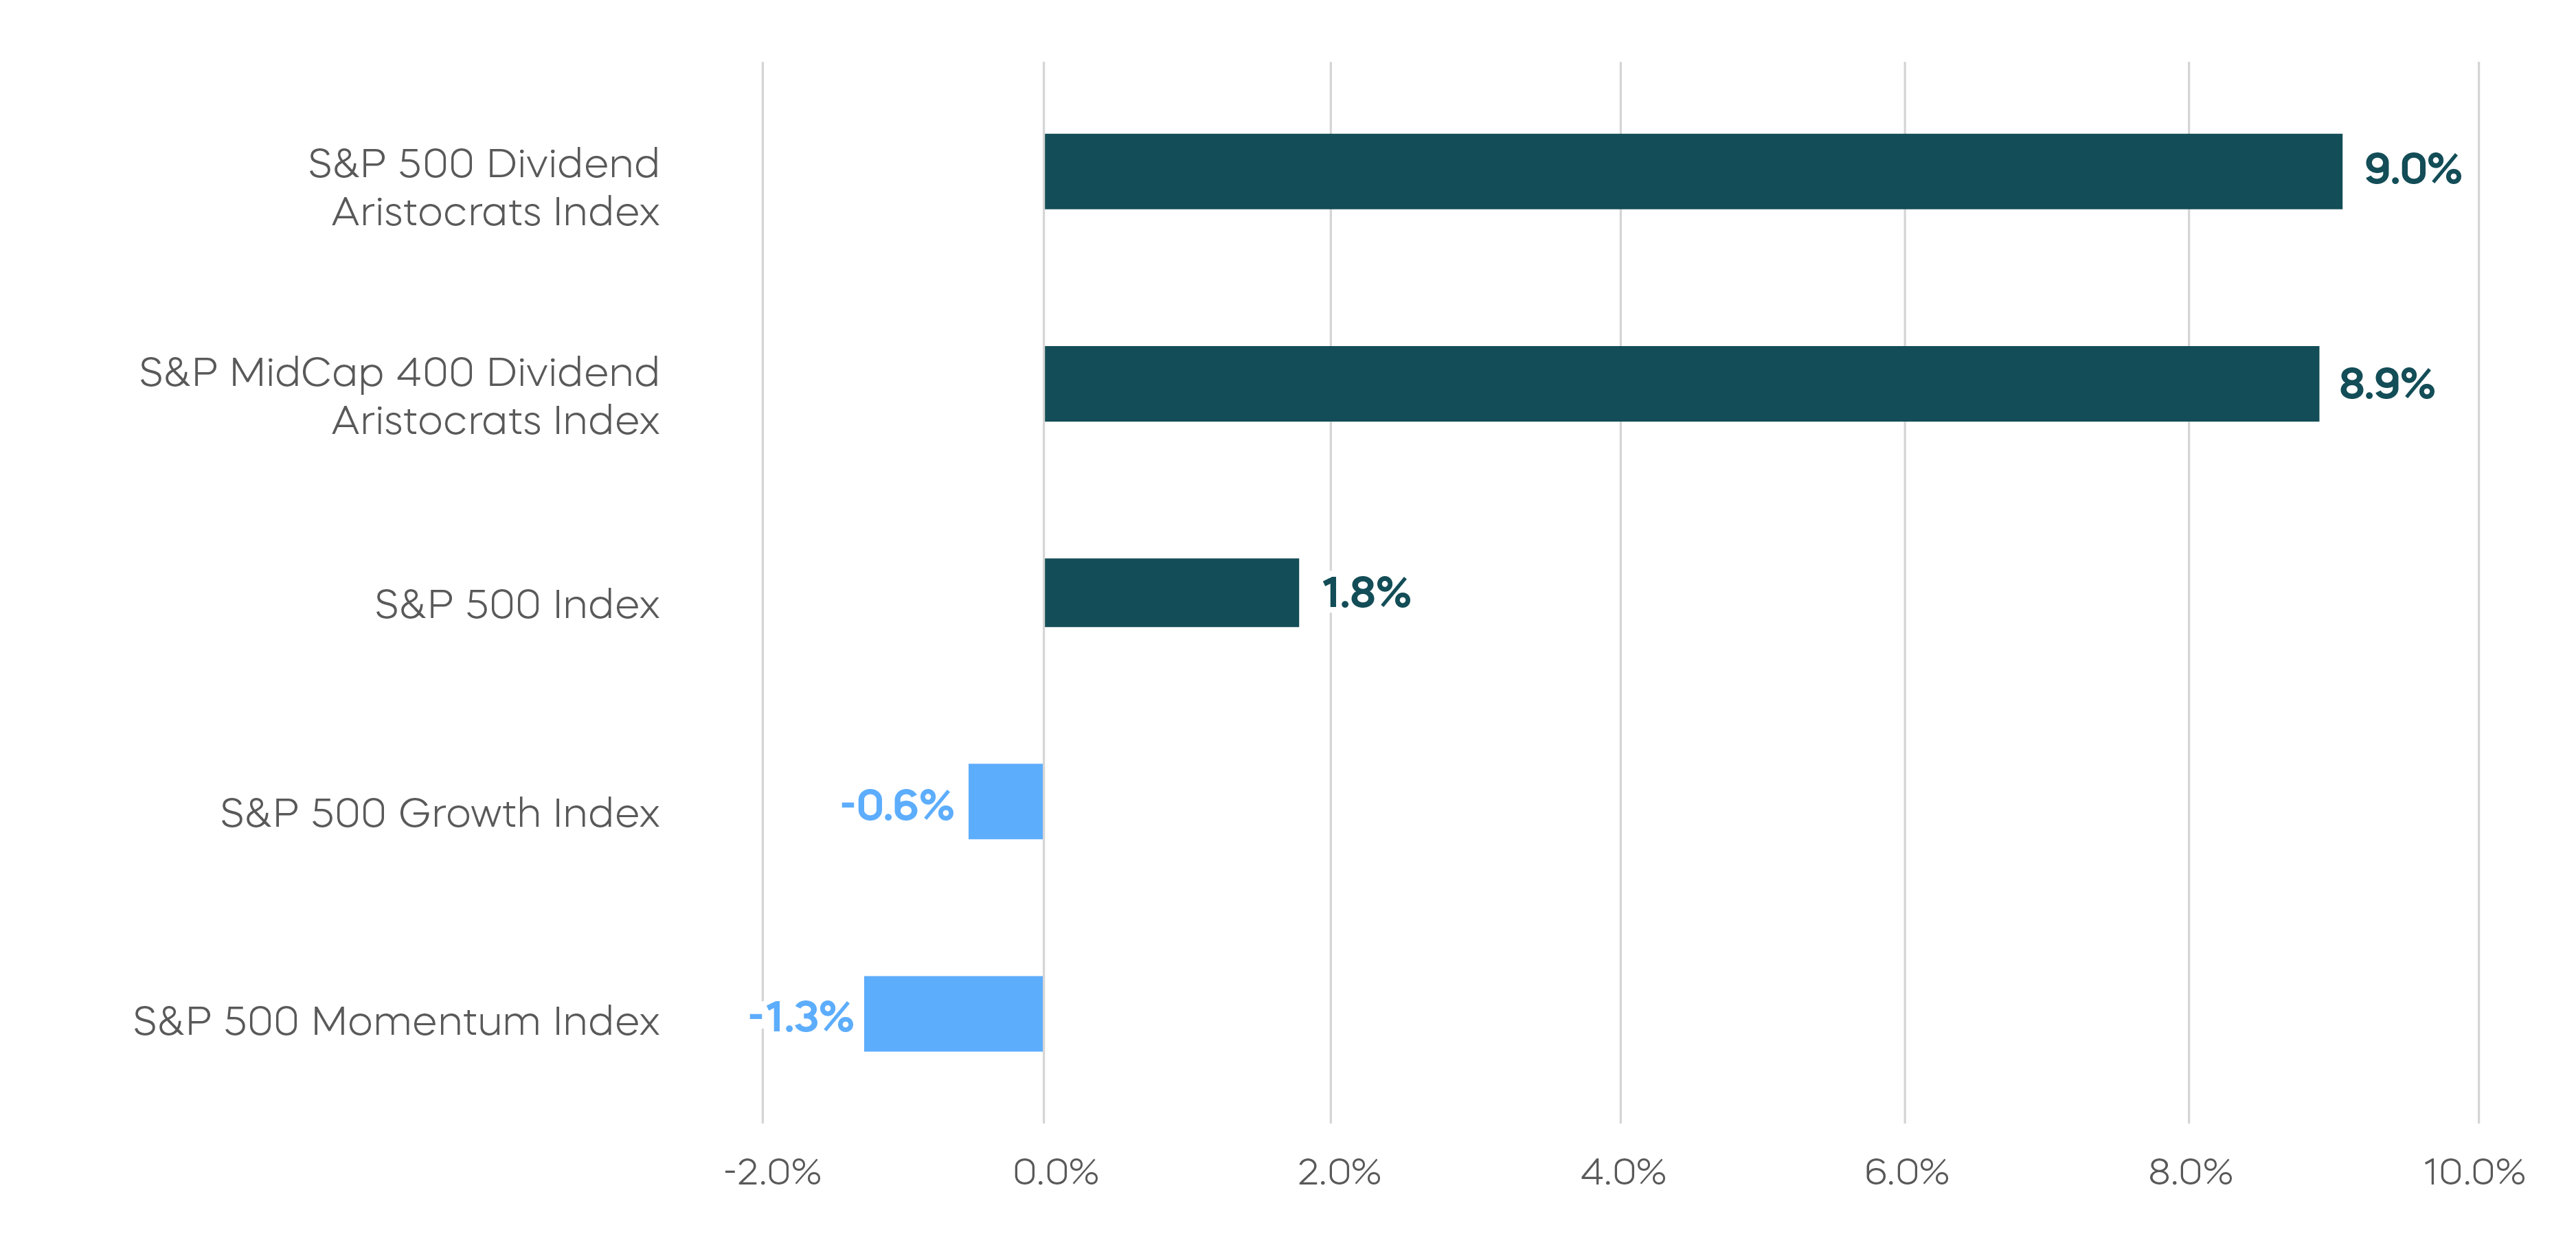
Source: Morningstar, data from 11/1/25-1/31/26. Index returns are for illustrative purposes only and do not reflect any management fees, transaction costs or expenses. Indexes are unmanaged, and one cannot invest directly in an index. Past performance does not guarantee future results.
Where to Find High Income from Small Caps
With small-cap stocks having continued to perform well, it’s helpful to consider their role in a well-constructed portfolio. Historically, small caps were the domain of investors seeking outperformance who could tolerate a higher volatility profile. That’s beginning to change. Thanks to innovative covered call strategies, small caps can potentially be used to deliver both high levels of income and attractive returns. Rather than fearing small-cap volatility, investors may be able to harvest frequently higher levels of implied small-cap volatility to generate income and total return.
But there is a catch. Traditional covered call strategies that use monthly expiring options often sacrifice significant total return in exchange for high levels of income. For small caps, that trade-off can be particularly costly.
A recent innovation—daily call options—makes it possible to offer a solution designed to help investors seek high levels of income while also potentially capturing the long-term returns that monthly small-cap strategies can miss. The Russell 2000 Daily Covered Call Index employs a strategy that sells out of the money call options on a daily basis. Since its inception in September 2024, the index has captured significantly more of the upside compared to the traditional CBOE Russell 2000 BuyWrite Index approach.
Small-Cap Covered Call Strategy Powered by Daily Options Have Outperformed
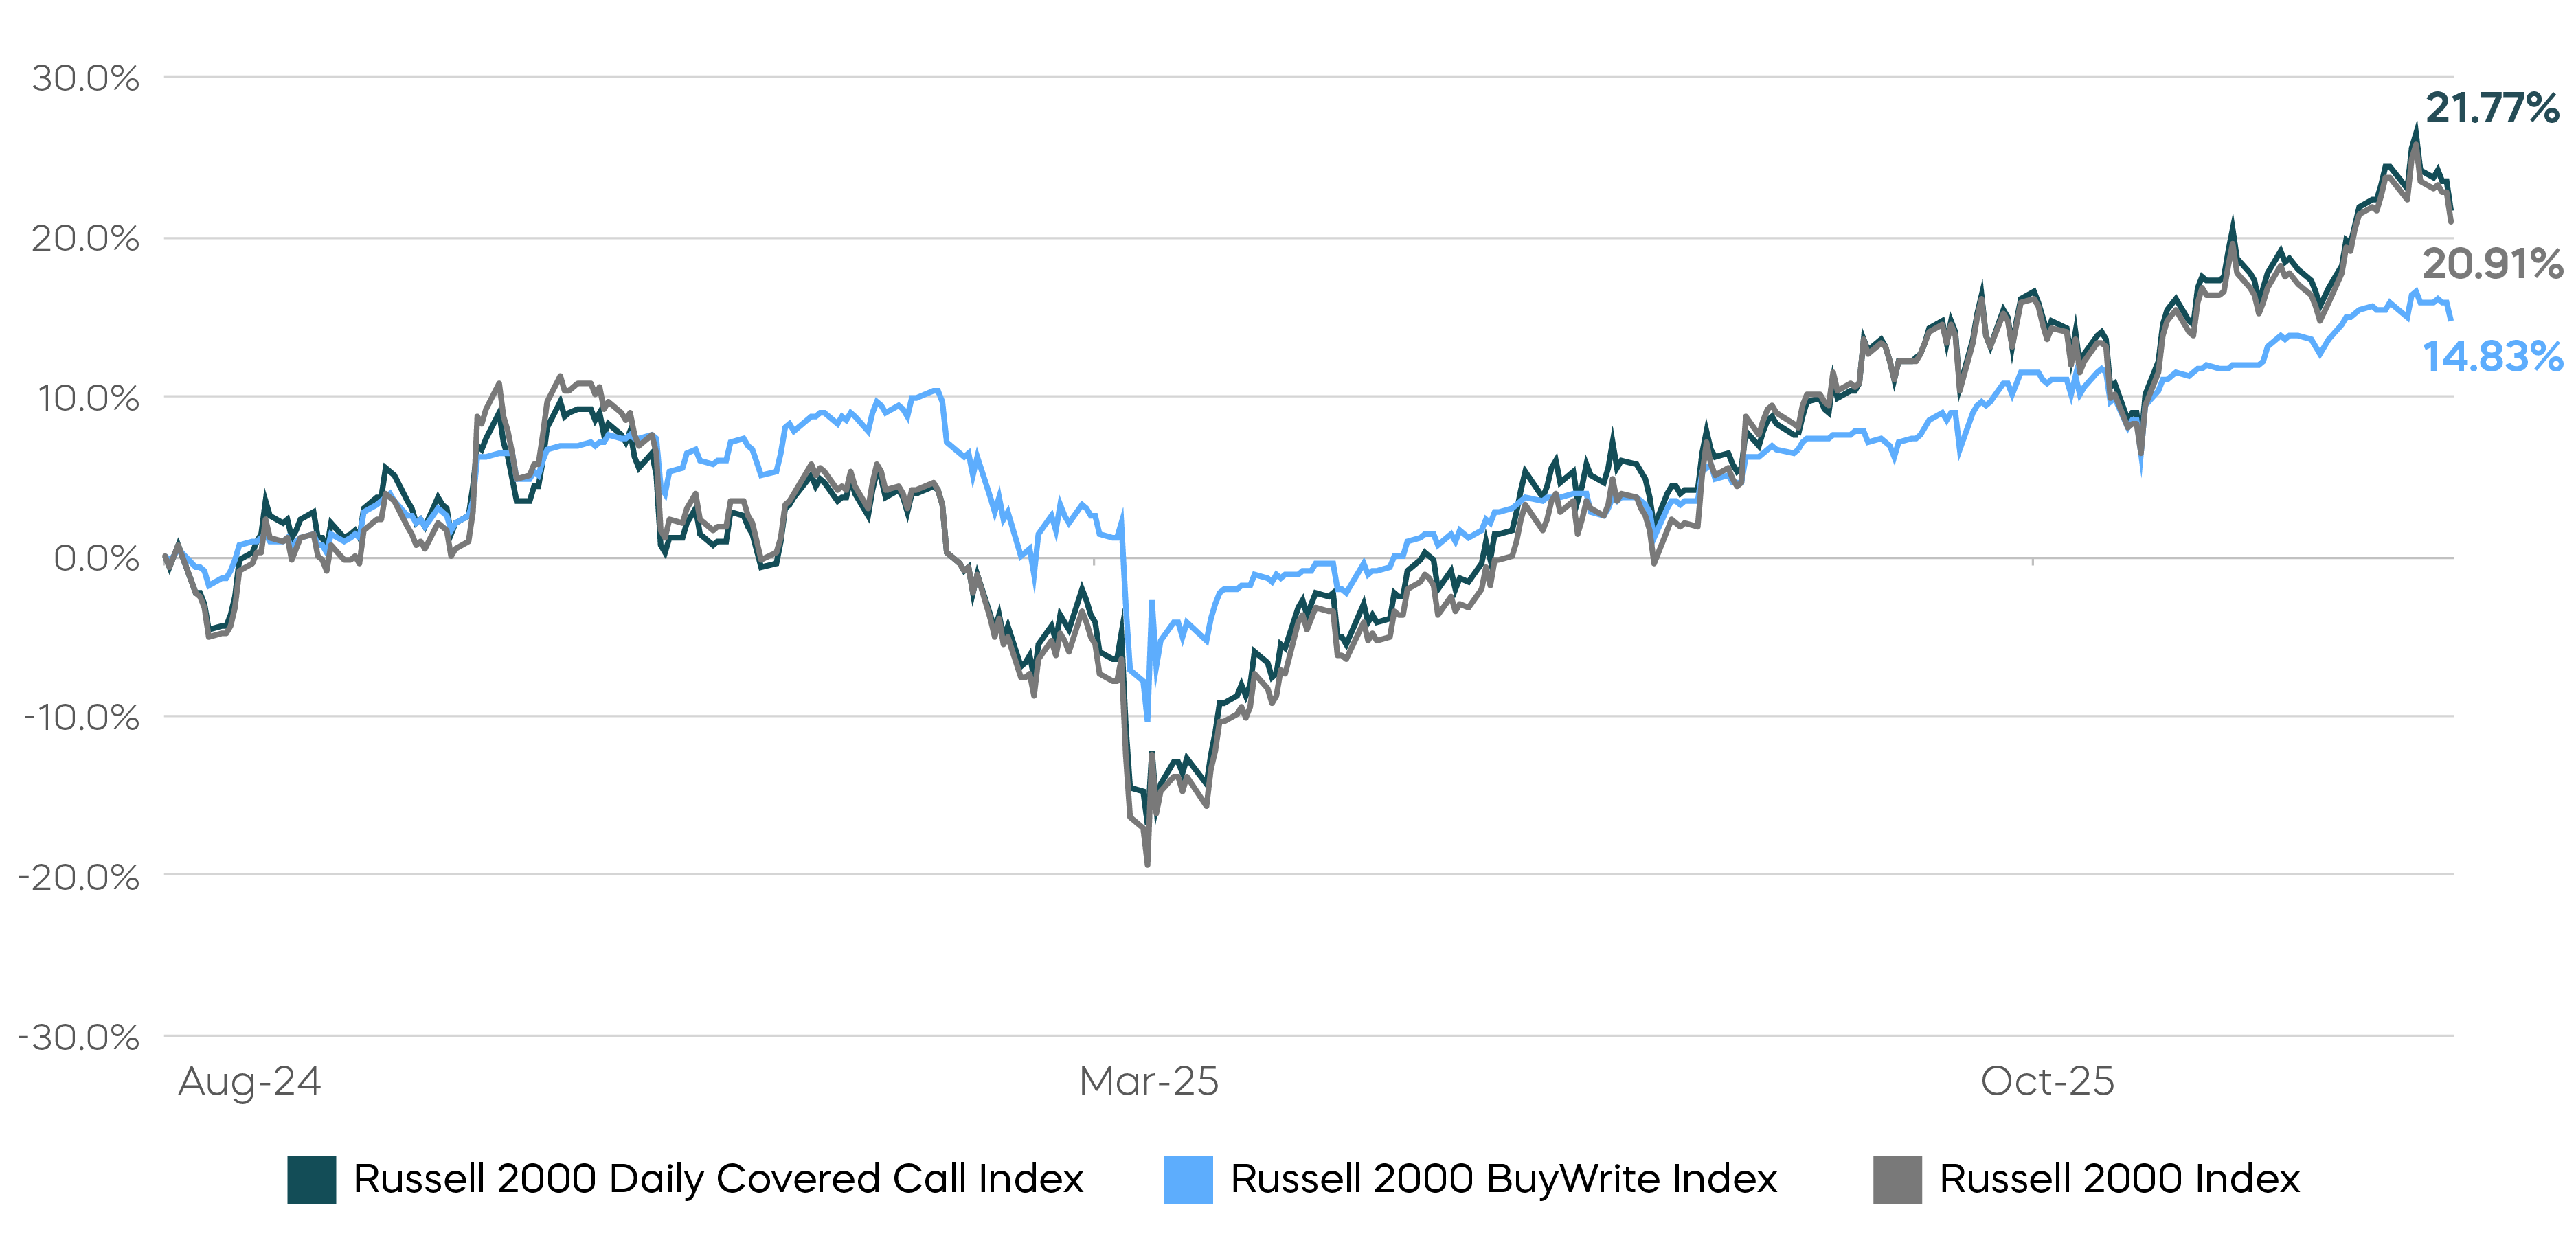
Source: Bloomberg. Data from 8/27/24 to 12/31/2025. Index returns are for illustrative purposes only and do not reflect any management fees, transaction costs or expenses. Indexes are unmanaged, and one cannot invest directly in an index. Past performance does not guarantee future results.
Fixed Income Perspectives

A Narrower Fed
With rising debt levels in the Unites States, fiscal dominance has become an increasingly prominent theme. During the confirmation process of Federal Reserve Governor Stephen Miran as recently as last year, discussion surfaced around the third mandate of the Federal Reserve: That in addition to maximum employment and price stability, the Fed should also promote moderate long-term interest rates.
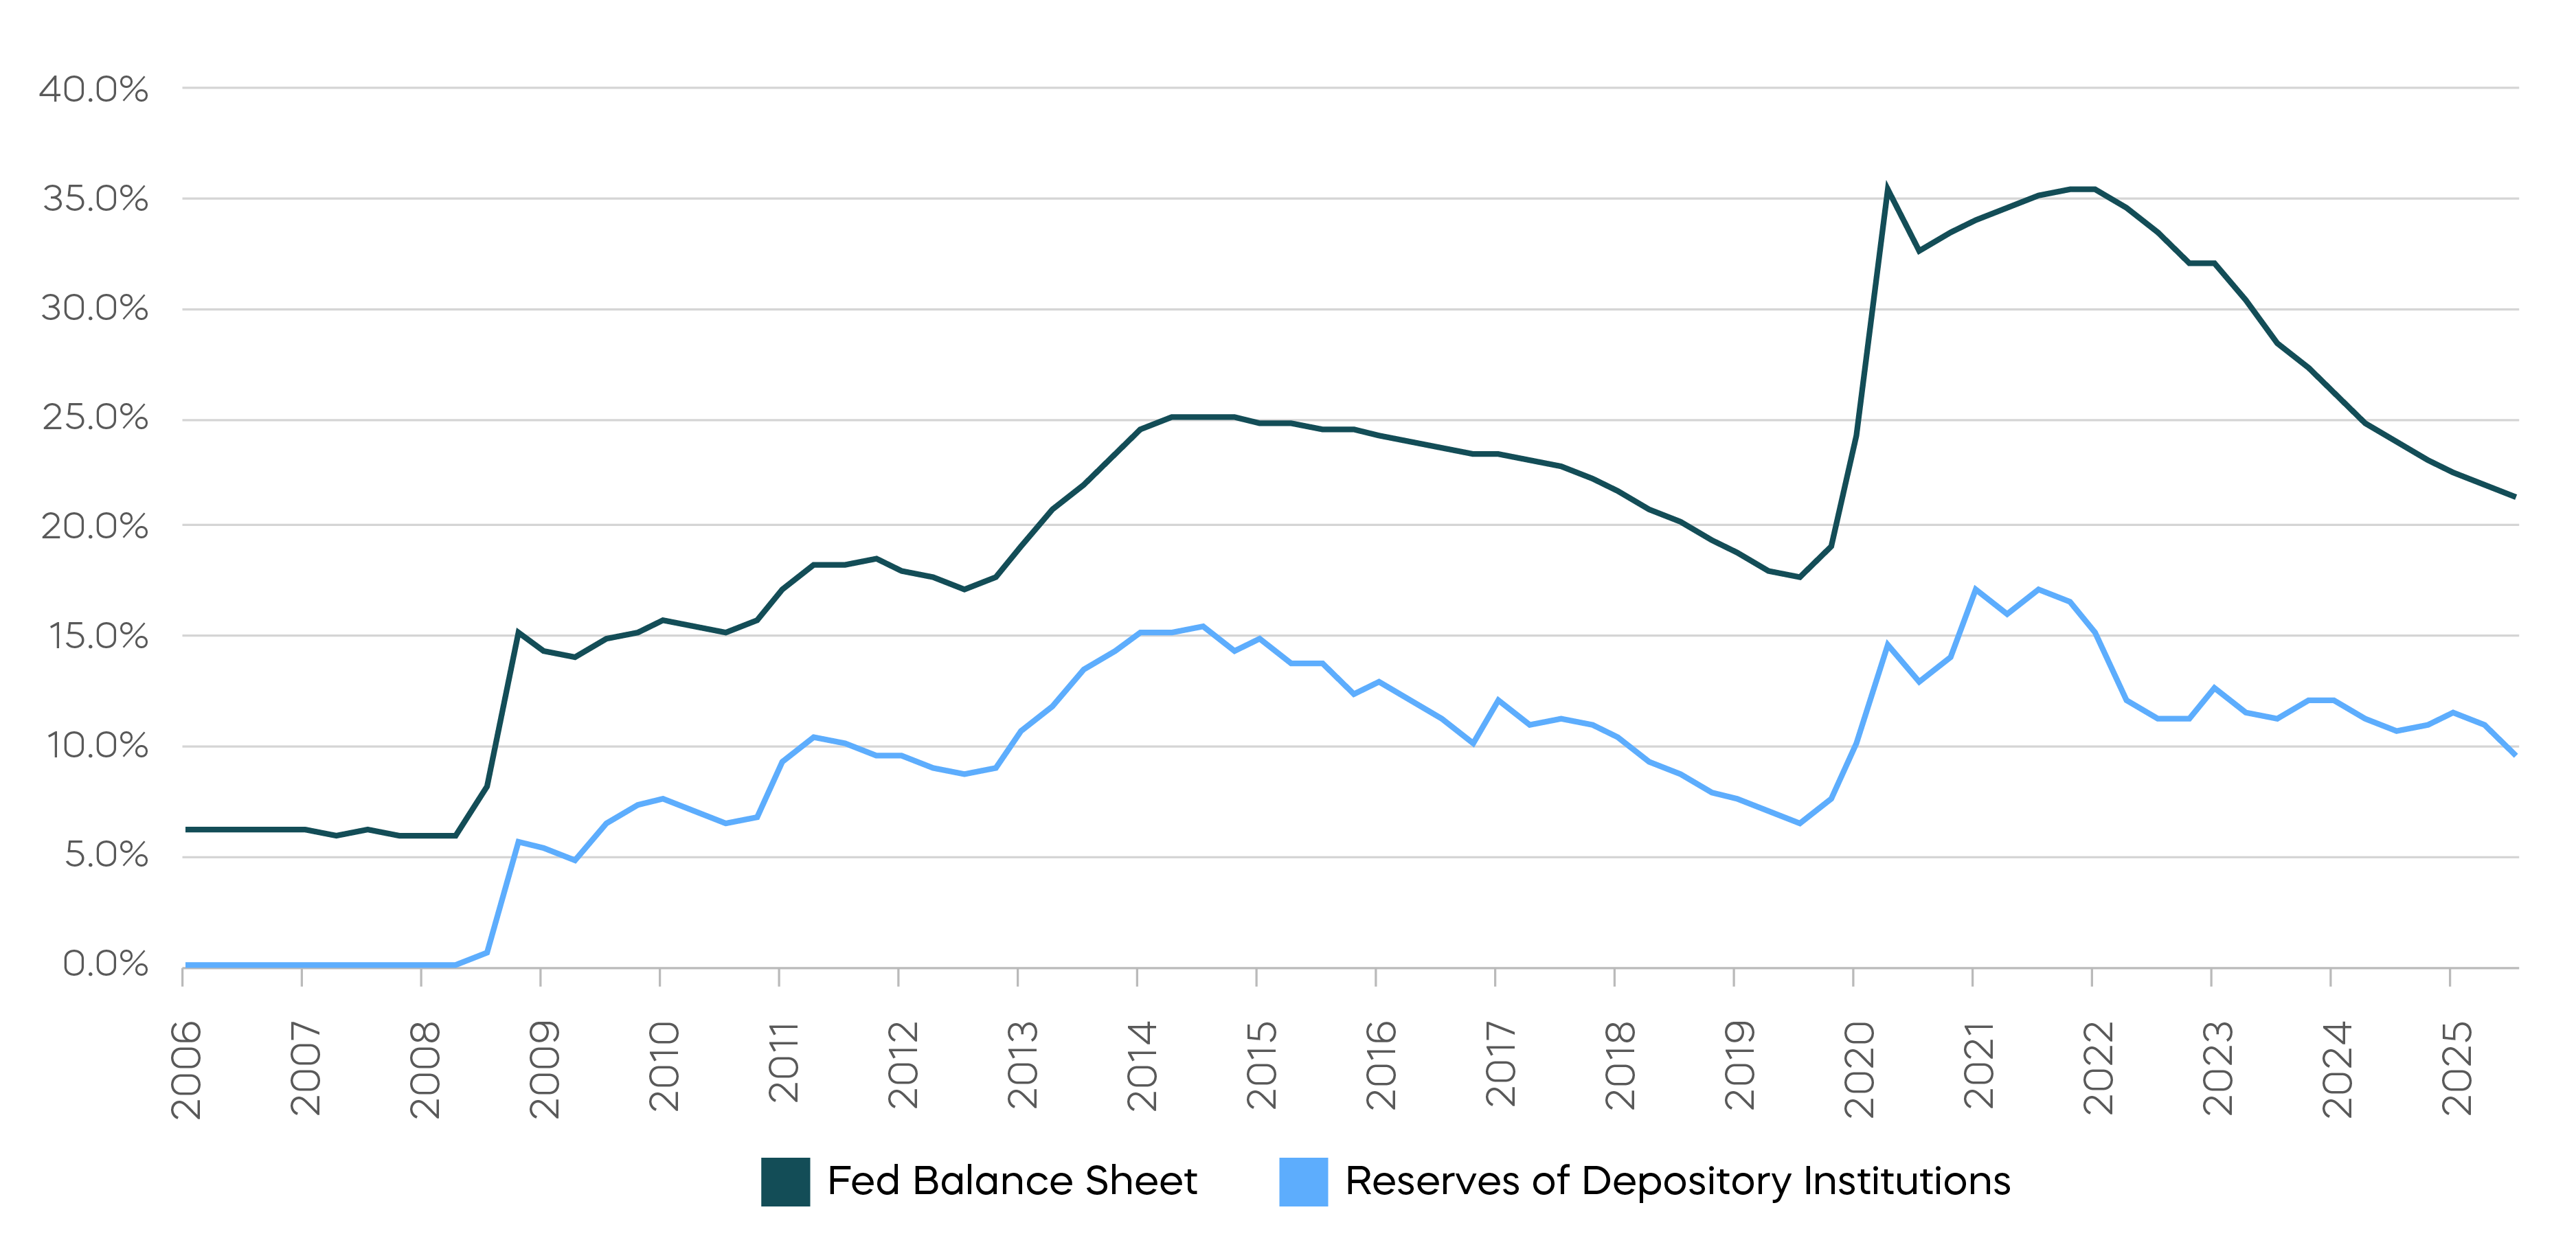
However, the nominee for the next Fed Chair, Kevin Warsh, has long argued for a narrower interpretation of those mandates. Over more than a decade since his tenure as a Fed governor, Warsh has been consistent in criticizing what he views as an expansion of the Fed’s footprint in the economy. Central to his critique is the growth of the Fed’s balance sheet, which expanded from roughly 6% of GDP when Warsh first joined the Board to about 21% of GDP today, following repeated rounds of quantitative easing. That expansion has become a focal point for political scrutiny.
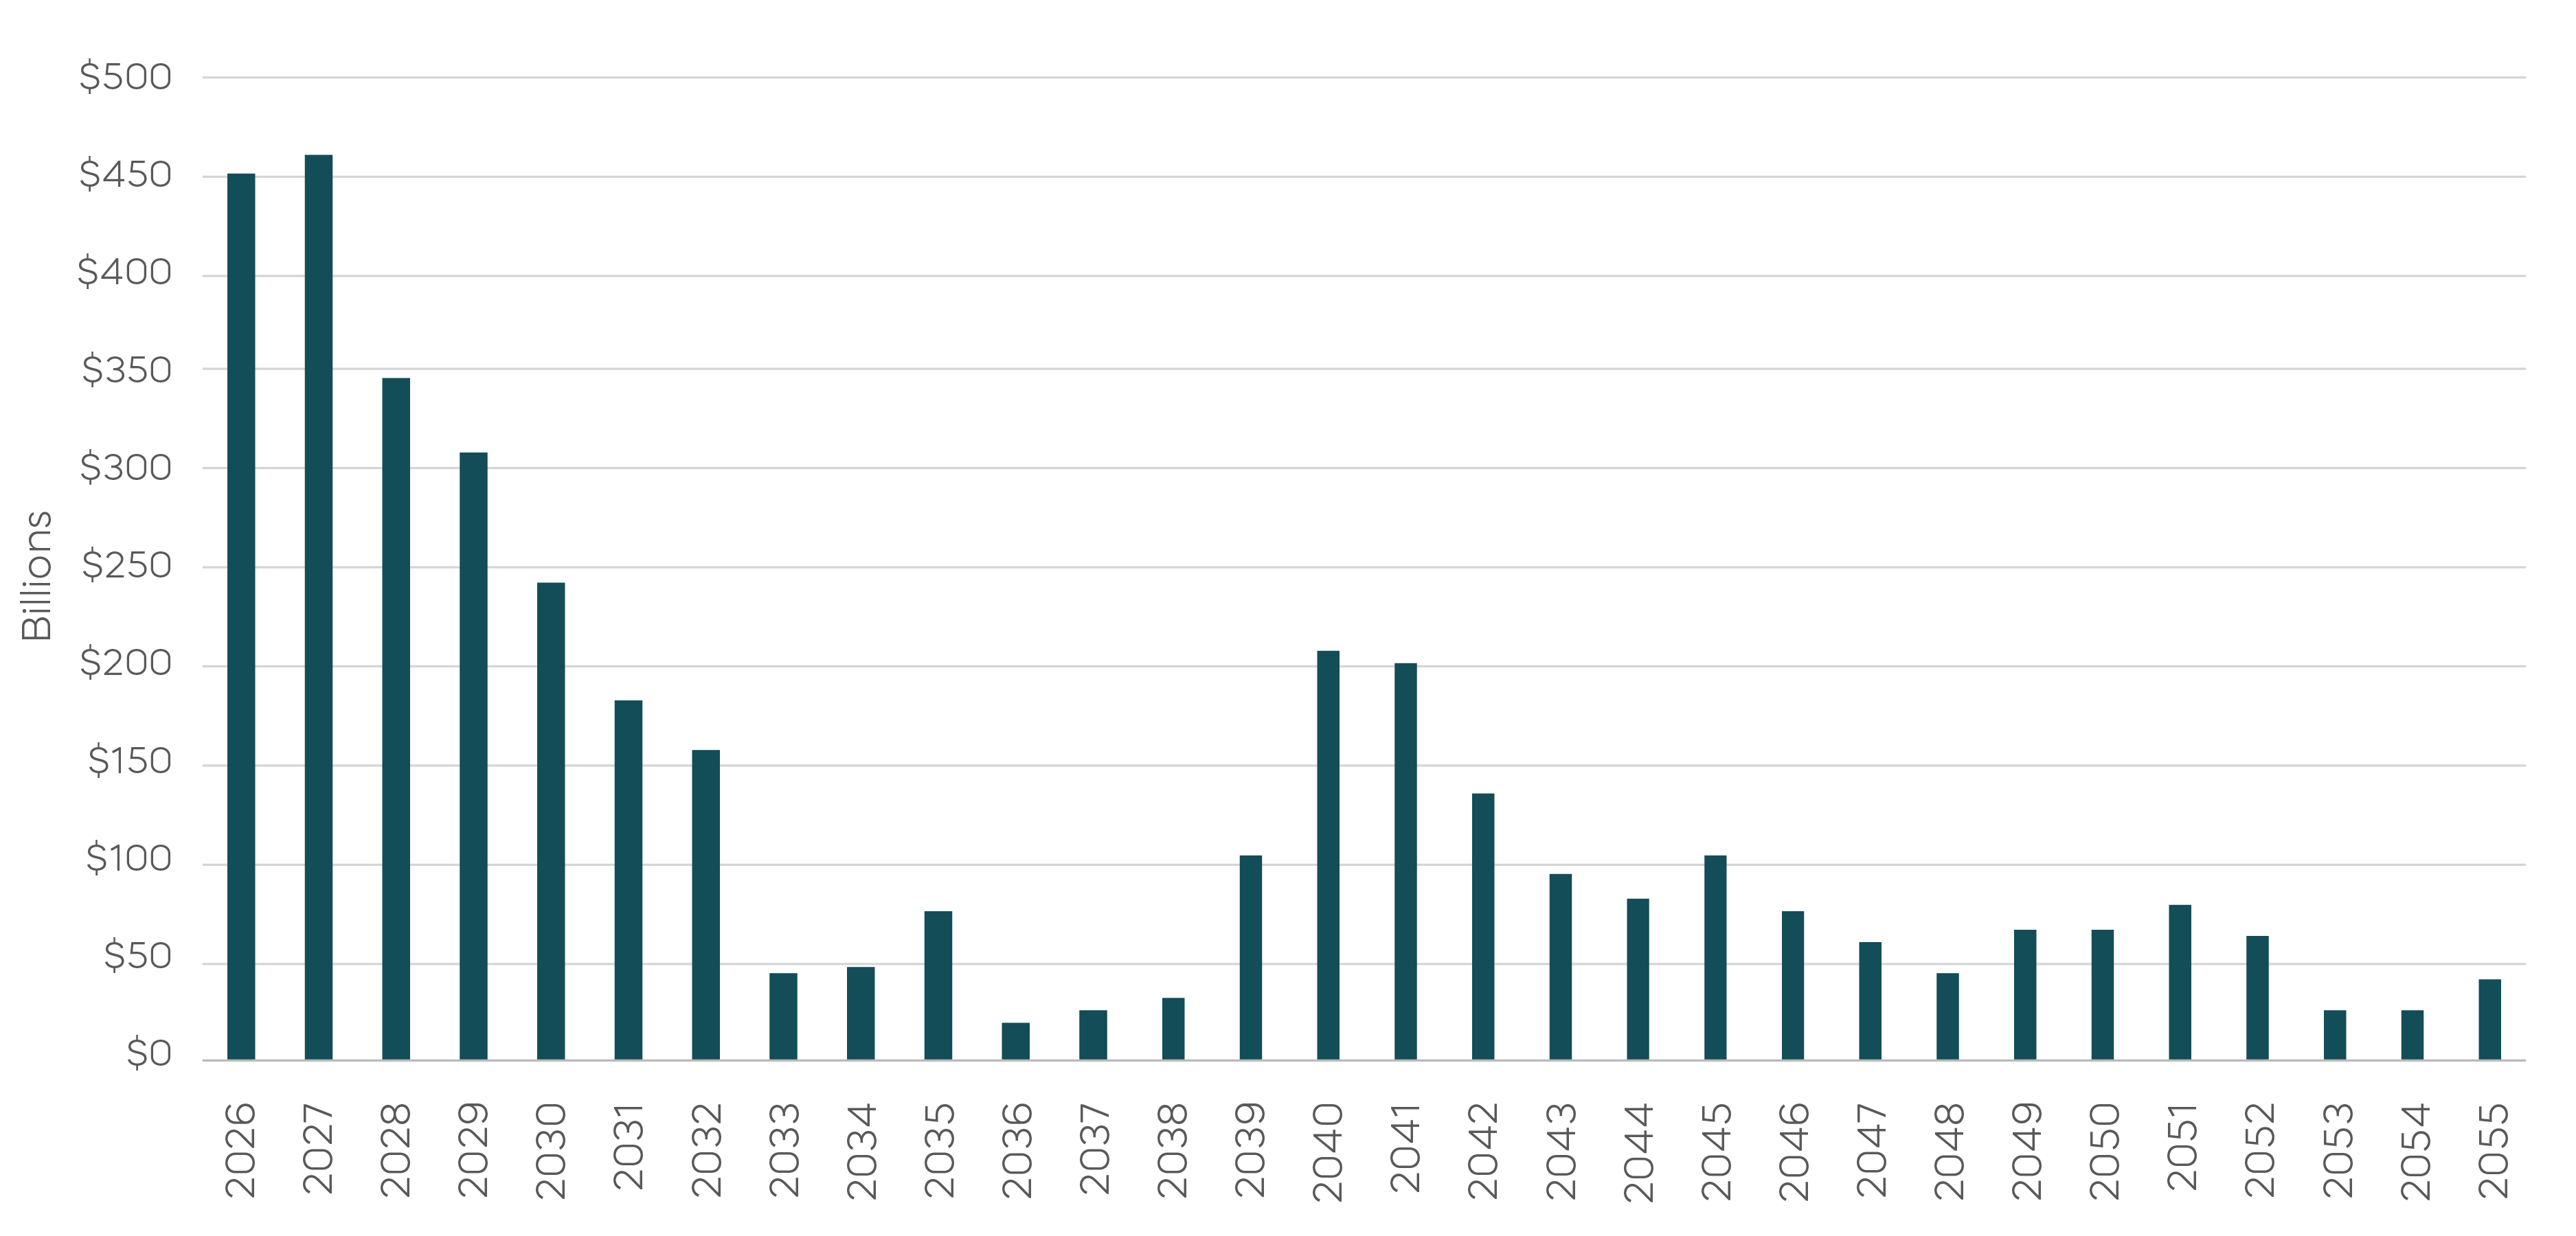
A renewed effort to shrink the balance sheet would effectively mark a resumption of quantitative tightening, which the Fed paused last year. While agency mortgage-backed securities (MBS) would likely be allowed to run off gradually via prepayments to limit disruption to housing markets, there is also roughly $1.8 trillion of coupon Treasury securities on the Fed’s balance sheet that will mature over the next five years. The scale alone suggests that balance-sheet reduction could have a meaningful market impact. Warsh has recently argued that rate cuts could offset much of the associated tightening in financial conditions, and his long-standing consistency lends a degree of credibility to a potential reduction of the balance sheet.
Par Value of Coupon Treasury Securities by Maturity
Source: Federal Reserve Bank of New York, System Open Market Account.
The balance sheet expansion also forced a structural change in how monetary policy is implemented. During expansion, the Fed shifted from a scarce reserve system to an ample reserve system, in which banks hold large quantities of reserve balances at the Fed to settle interbank transactions. When the Fed purchases Treasuries, it creates reserves, and those reserves now constitute a large share of the Fed’s liabilities. This framework also aligns more naturally with regulations put in place after the Great Financial Crisis (GFC). Under leverage rules, banks must hold capital against even the safest assets, including both Treasuries and reserves, though reserves receive superior liquidity treatment. As a result, regulatory adjustments, such as a haircut in the Supplementary Leverage Ratio for Treasuries, may be necessary to make Treasuries a closer substitute for reserves and allow banks to absorb supply released by a balance-sheet runoff.
Federal Reserve Balance Sheet as a Percentage of U.S. GDP
Source: Bloomberg, data from Q1 2006 to Q3 2025.
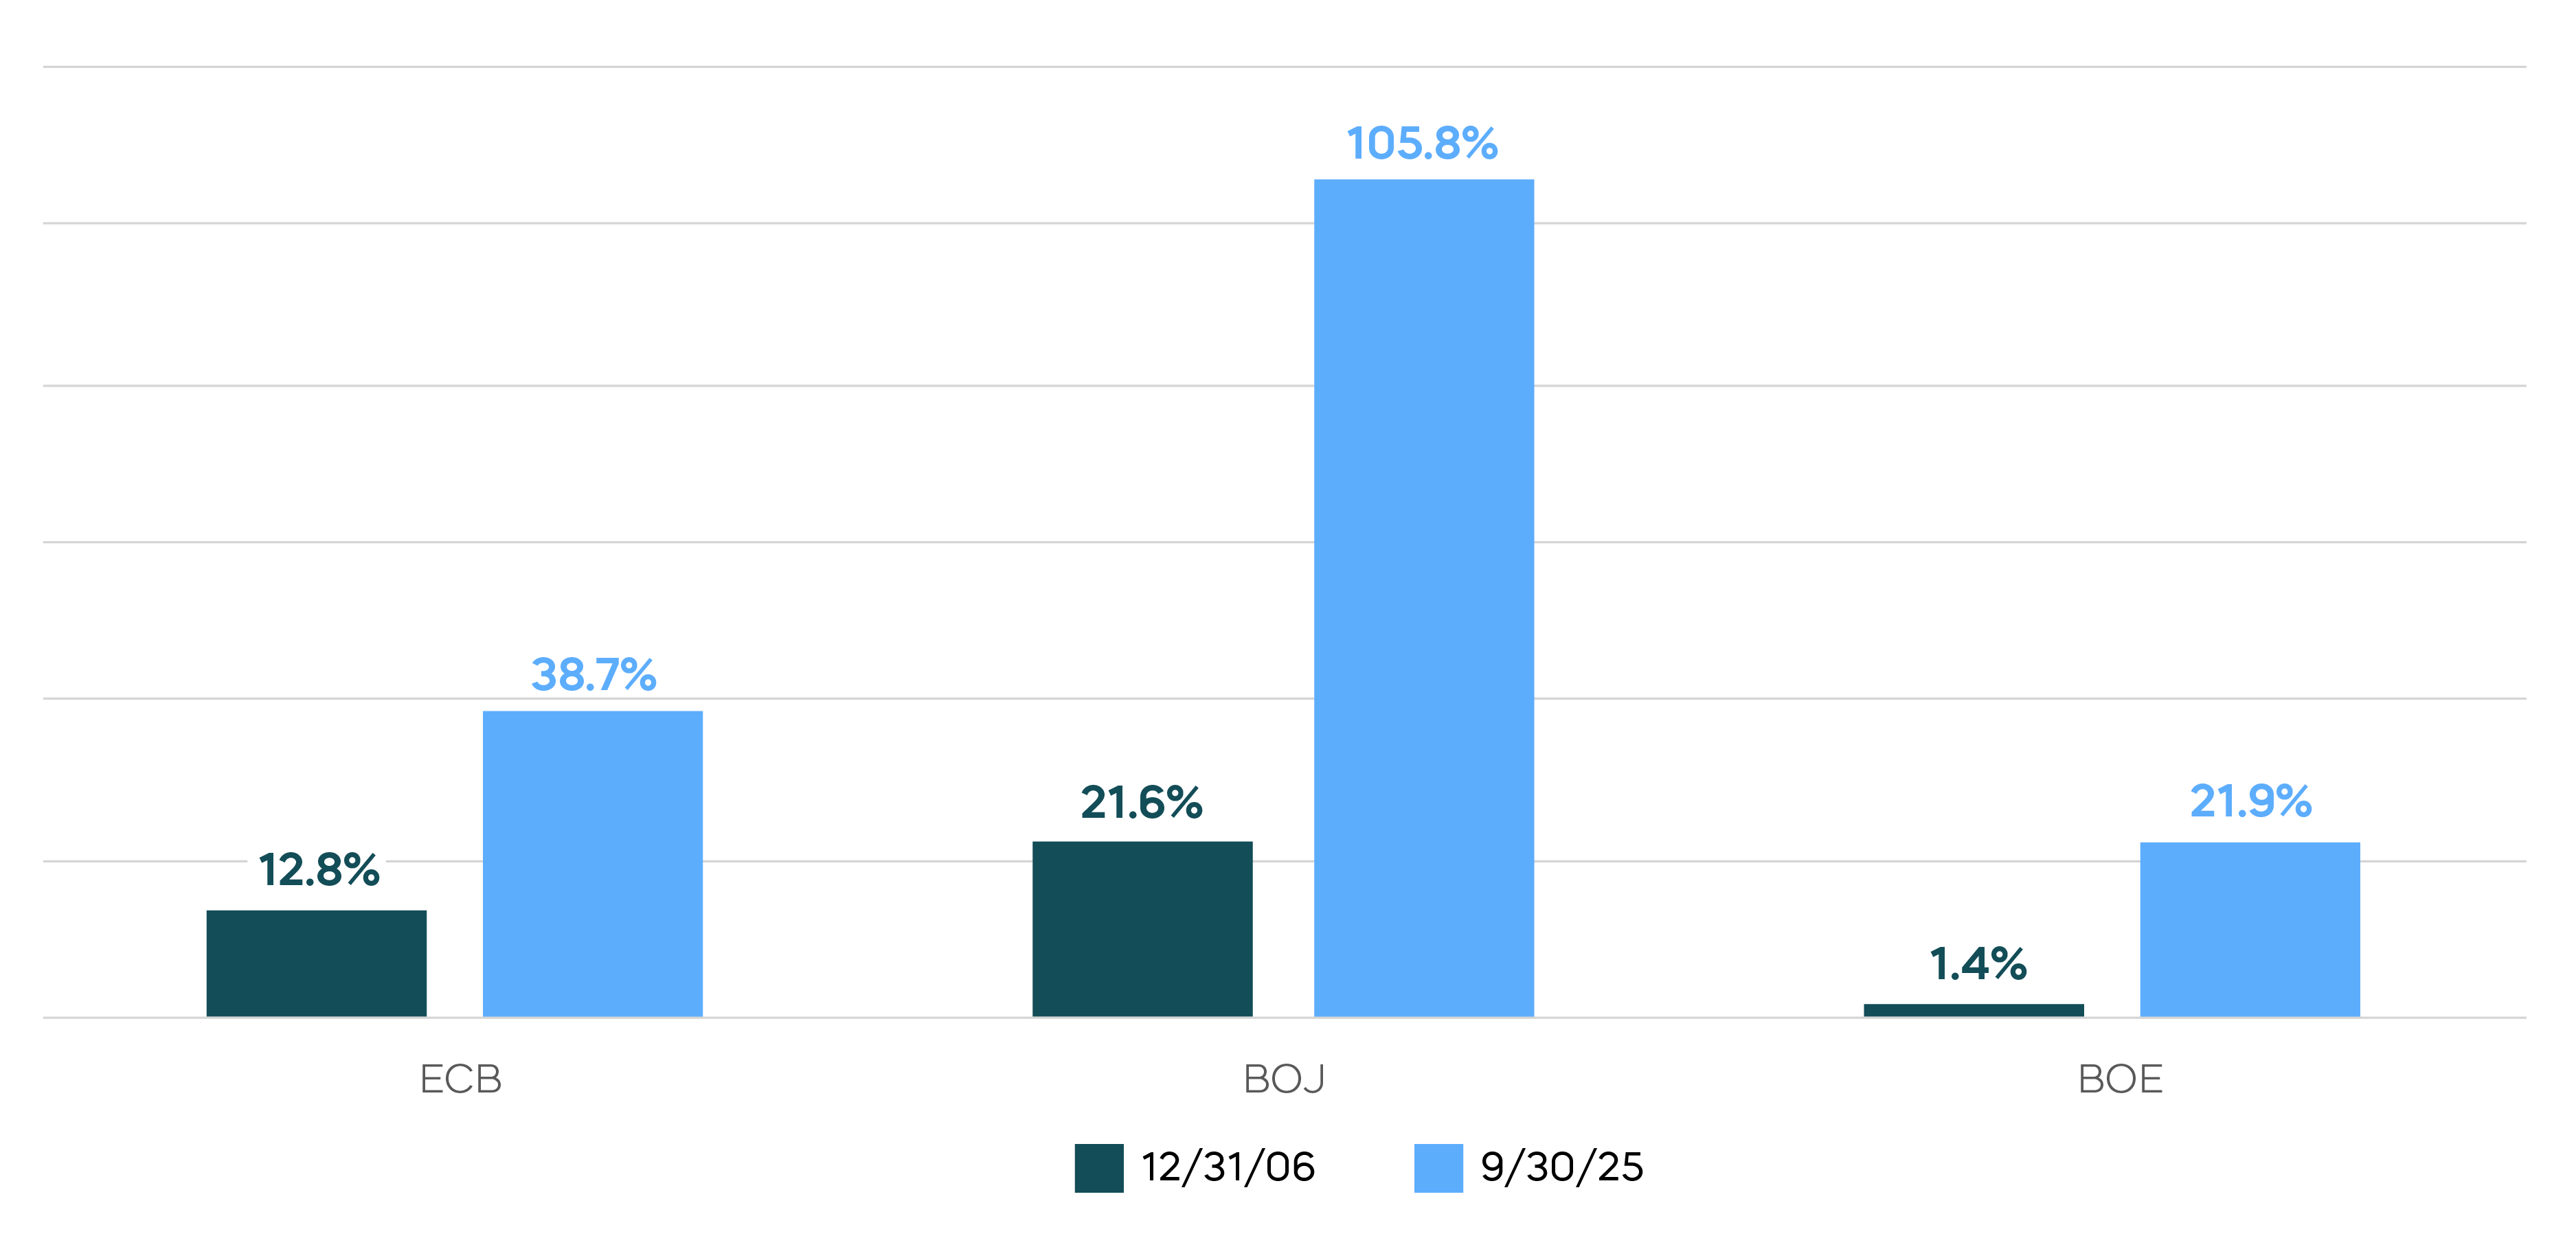
While the ample reserve system emerged directly from quantitative easing (QE), it offers some potential operational advantages. It is arguably more resilient to funding stress because it does not require the Fed to continuously fine tune the marginal level of reserves demanded by the banking system, a task that was error-prone during past stress episodes. Instead, banks hold reserve buffers in advance. Unwinding a large balance sheet also shifts duration risk back to the private sector and can tighten financial conditions, which would make exiting those reserves both economically and politically challenging. Notably, many global central banks adopted similar “floor” systems after the GFC and now operate with balance sheets far larger than historical norms.
Global Central Bank Balance Sheet as a Percentage of GDP
Source: Bloomberg, data from Q4 2006 to Q3 2025.
A coordinated effort to shrink the Fed’s balance sheet seems entirely plausible given Warsh’s views, support from the White House, and comments from Governor Michelle Bowman favoring “the smallest balance sheet possible.” The net benefits of such an action, however, remain uncertain.
Furthermore, a smaller balance sheet could lead to more volatile money markets and a higher term premium. Fed research suggests that QE consistently suppresses term premium. By symmetry, unwinding those purchases would be expected to raise it. For now, the debate raises more questions than answers. Until there is greater clarity under a new Fed chair, uncertainty around the balance sheet path may contribute to a steeper volatility surface, particularly higher volatility at longer expiries.
Estimated Term Premium Effects at Announcement
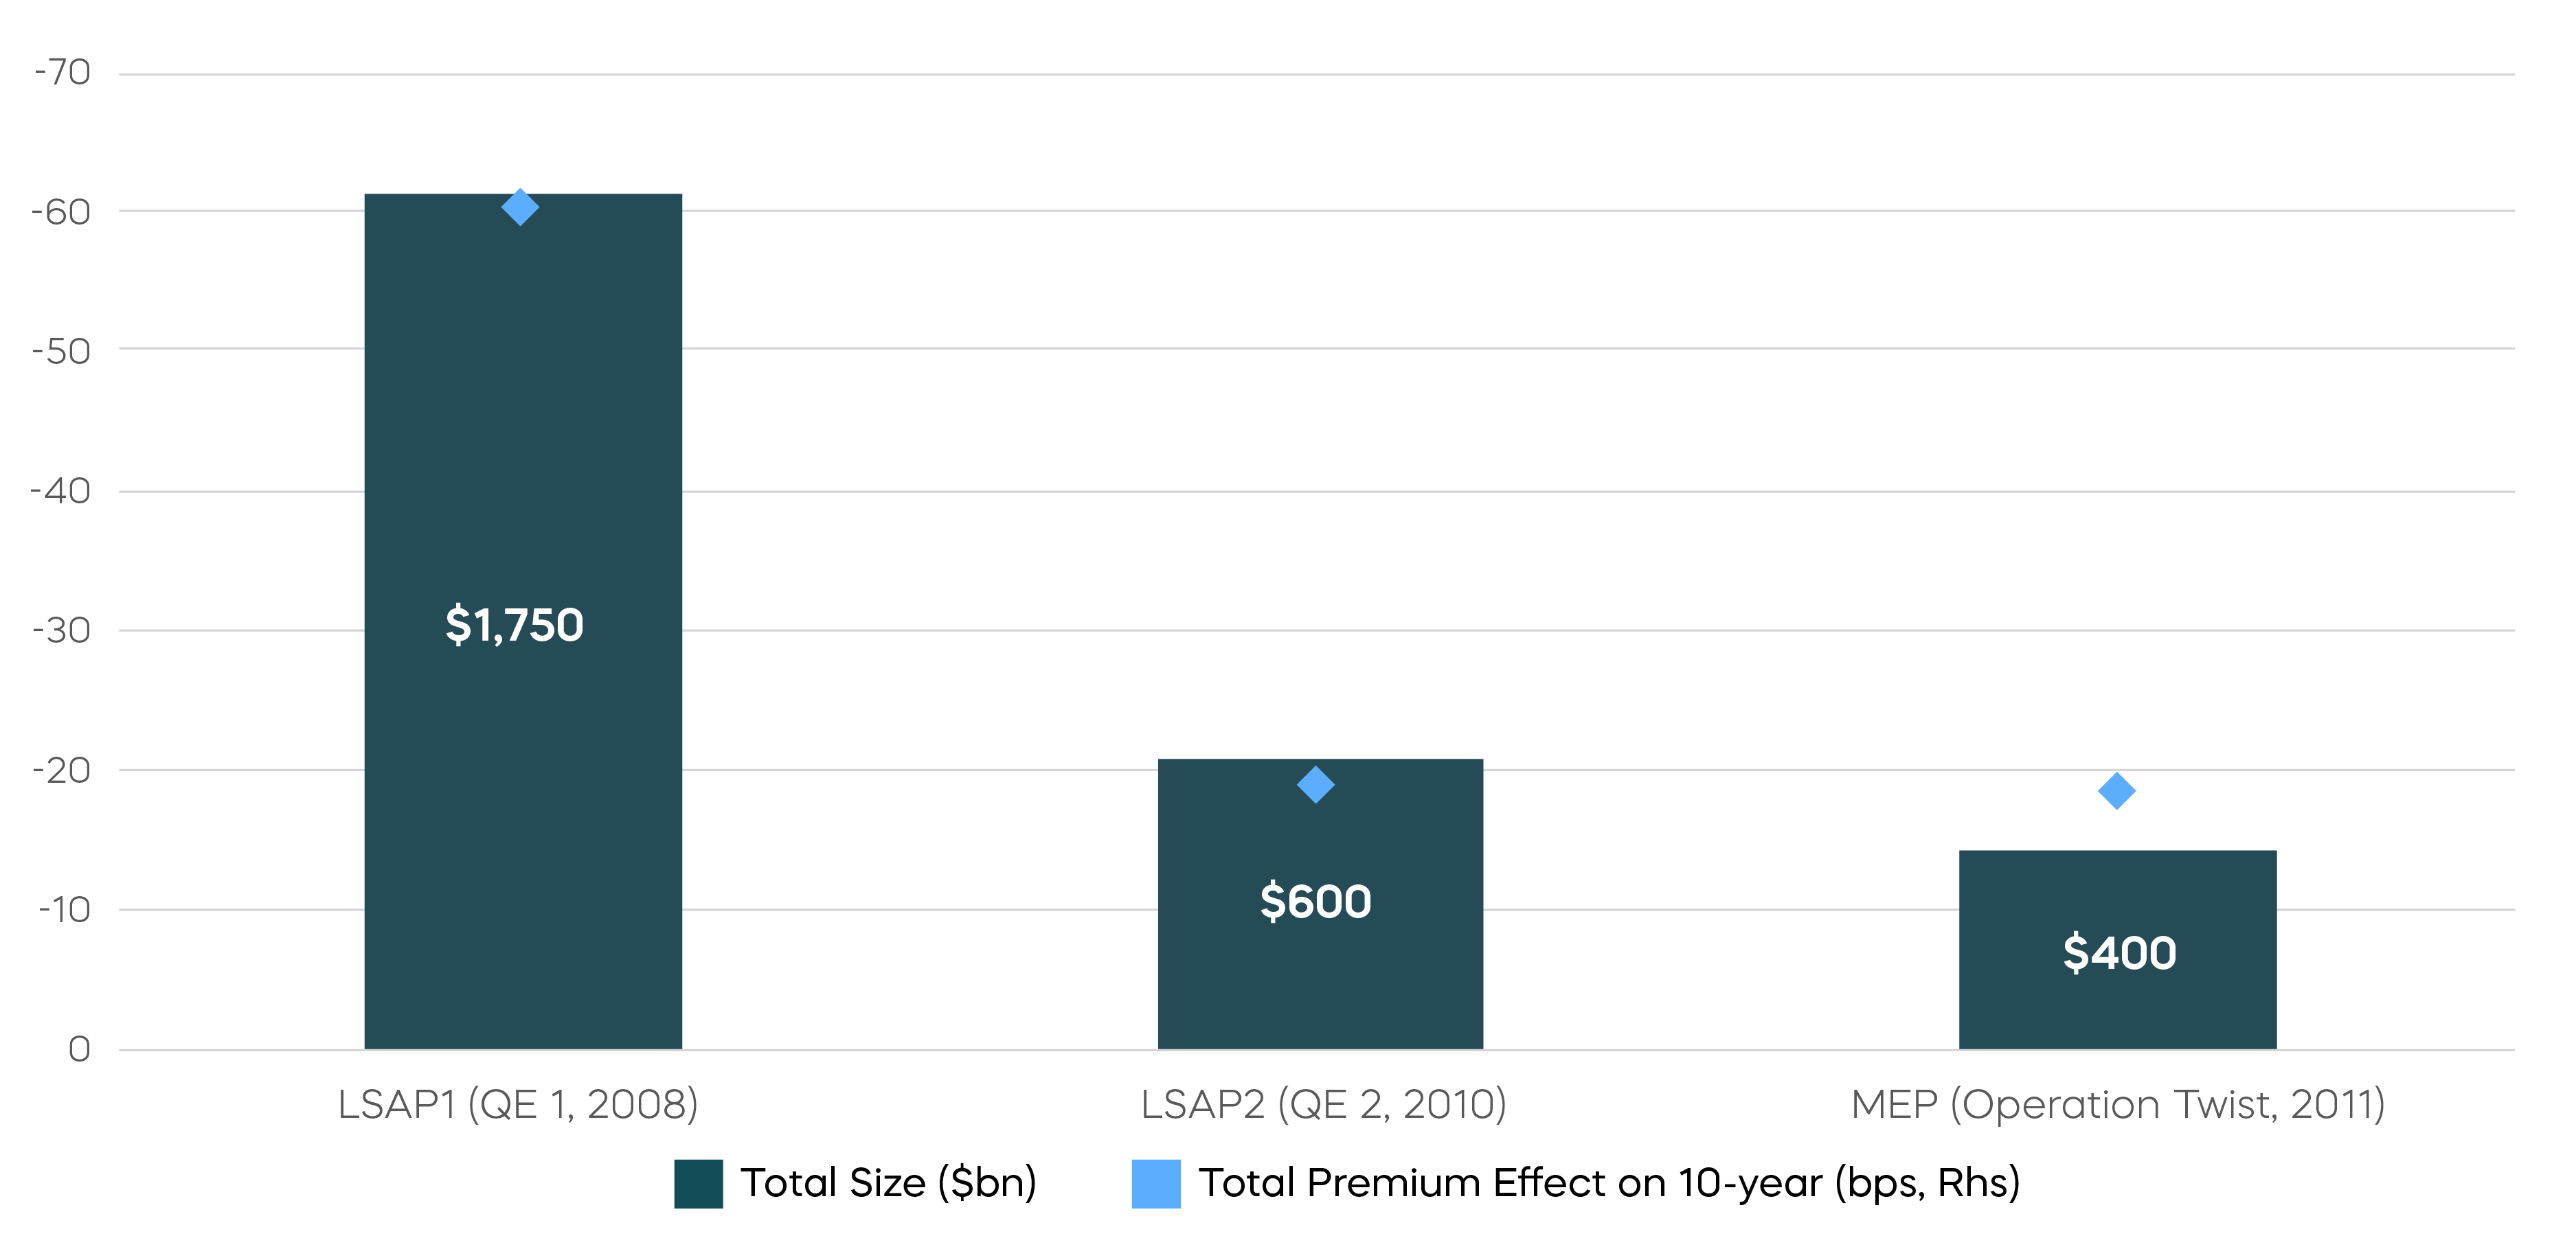
Source: The Federal Reserve Board, May 2012.
[1]Source: Bloomberg and FactSet. Performance data as of 1/30/26.