Key Observations

When everything, everywhere, is happening all at once, it’s often the bond market that does the best job of sorting things out. Here’s what’s happened:
- In the month of March, the 2-year U.S. Treasury yield fell substantially more than the 10-year U.S. Treasury yield, steepening the yield curve and reducing the amount of inversion.
- That steepening was driven by a substantial drop in 2-year breakeven inflation, from 3.18% to 2.68%, while 10-year breakeven inflation barely moved, falling from 2.37% to 2.32%.
The bond market is pointing to the potential for a happy-ish ending—banking challenges bringing inflation down a little quicker, but not triggering a crisis that challenges medium-term and long-term growth.
That stability in longer-term inflation expectations is particularly notable:
- We pointed out that stability last month in the face of news that might typically have caused that expectation to rise.
- This month, we’re noting that stability in the face of developments that might be expected to cause that expectation to decline.
The reinforcement of that stability supports our view that valuation multiples—like price-to-earnings (P/E) multiples that show how much investors are paying for a dollar of a company's earnings—will potentially remain stable. That would leave earnings as the key driver of stock performance.
There’s good news on the earnings expectations front, however. 2023 consensus earnings expectations for the S&P 500 are practically flat relative to 2022. While that low bar provides comfort, keep in mind that S&P 500 earnings shrank 3% in the fourth quarter last year. Here’s a
potential mismatch. 2023 consensus earnings expectations for the S&P 500 Dividend Aristocrats are for a 4% drop from 2022. Those are the same S&P 500 Dividend Aristocrats that delivered nearly 11% earnings growth in the fourth quarter. That combination of high-quality, long-term dividend growers and low expectations may be an opportunity.
Chart of the Month
Fourth Quarter 2022 S&P 500 Dividend Aristocrats Index and S&P Earnings Growth versus 2023 Estimate
Q4 2022 Earnings Growth 2023 Estimates
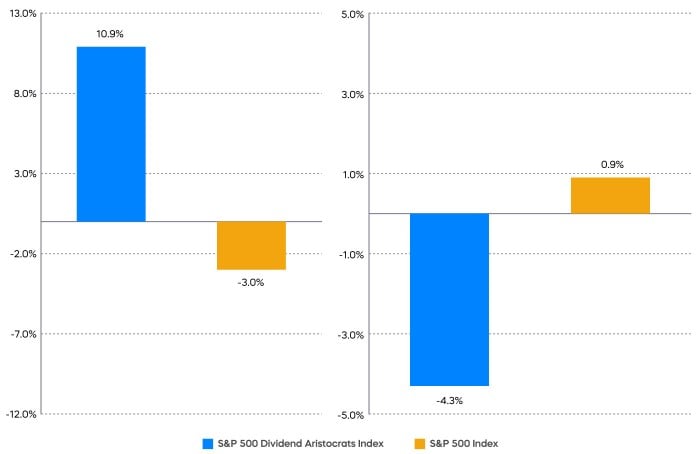
Source: Bloomberg. Data as of 3/31/23, includes 38/67 S&P 500 Dividend Aristocrats and 231 of 500 S&P 500 reporting.
Performance Recap
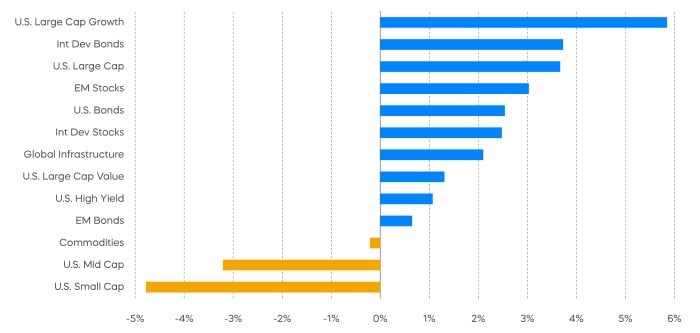
There were a lot of positive returns last month, despite the banking crisis.
Asset Class Returns—March 2023
Asset Class Returns—Year-to-Date 2023
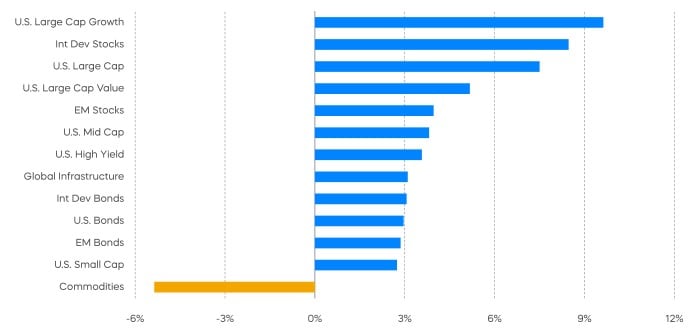
Source: Bloomberg. March returns 3/1/23‒3/31/23; year-to-date returns 1/1/23‒3//22. Index returns are for illustrative purposes only and do not reflect any management fees, transaction costs or expenses. Indexes are unmanaged, and one cannot invest directly in an index. Past performance does not guarantee future results.
Economic Calendar
Here’s a list of key and upcoming economic releases, which can serve as a guide to potential market indicators.

Equity Perspectives

Equities Remain Resilient
Equity markets closed out the first quarter of 2023 with strong returns, and they continued to demonstrate resiliency despite an increasingly shaky economic backdrop.
- The S&P 500’s return of 7.5% for the quarter was impressive, but narrow, as over 85% of returns came from just 10 of the largest stocks by market cap1.
- As we highlighted after January’s rally, market leadership continued to be provided by 2022’s laggards2.
- Most notably, the Nasdaq-100 Index—one of 2022’s worst performers with losses of over 30%—led all major equity averages by posting returns of over 20% for the first quarter.2
The reversal pattern also persisted in the realm of dividends. High dividend yielders generally outperformed dividend growers during 2022, but they have underperformed so far this year.
Choose Your Dividends Wisely
The high degree of interest rate volatility of late has had an interesting effect on dividend stocks, but before we discuss that, we need some context. In the recent era of low inflation and low interest rates, many investors have struggled to generate sufficient levels of income from the bond side of their portfolios. Dividend stocks producing greater yields than bonds—frequently stocks of the high dividend yield variety—were called upon by many to fill some of the void. But those high dividend yielding stocks generally carry higher risk profiles.
The swift back-up in yields over the last year has changed the calculus of that decision. Yes, rates fell during March, but they are significantly higher relative to last year and seem unlikely to fall to extreme lows anytime soon. For the first time in several years, from a yield perspective, fixed income offers an alternative to dividend stocks. With near-zero interest rate policies behind us, what’s a dividend investor to do?
As the rate environment continues to normalize, investors may want to re-evaluate their approach to dividend strategies. Dividend growth strategies—like the S&P 500 Dividend Aristocrats Index which includes companies that have grown dividends for at least 25 consecutive years—potentially represent a more dynamic approach for investing in dividends.
Why Use a Dividend Growth Approach?
First, dividend growth may provide a more balanced approach to returns. Remember, income is typically the smaller component of total return. The larger component is capital appreciation, and it has delivered over 65% of the market’s returns over time (Source: Morningstar, as of 3/31/23). While their yields may be lower, companies in the S&P 500 Dividend Aristocrats Index have generally had a better balance of growth and income. As a result, they have provided greater total returns over time.
Dividend Growth Has Produced Higher Returns
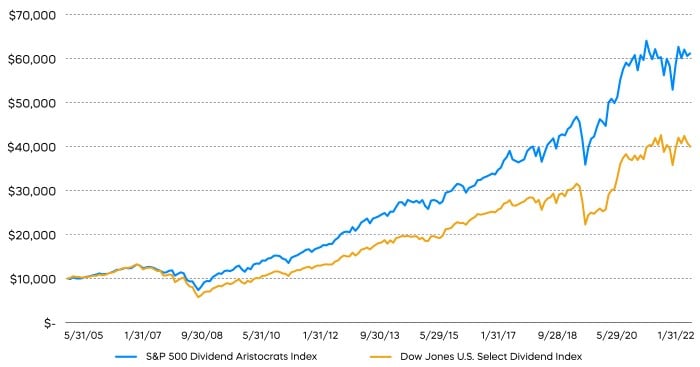
Source: Bloomberg. Data from 5/31/05–3/31/23. Dividend growth is represented by the S&P 500 Dividend Aristocrats Index, and high dividend yield is represented by the Dow Jones U.S. Select Dividend Index. Index returns are for illustrative purposes only and do not reflect any management fees, transaction costs or expenses. Indexes are unmanaged, and one cannot invest directly in an index. Past performance does not guarantee future results.
Dividend growth has also outperformed regardless of the direction of rates. While the Federal Reserve has maintained its higher-for-longer stance, market participants have pushed yields lower in anticipation of economic uncertainty and future rate cuts. This type of rate volatility may be with us for a while. The S&P 500 Dividend Aristocrats Index has historically outperformed the Dow Jones US Select Dividend Index (a proxy for high dividend yield) in both rising and falling rate environments, making it a potentially sound strategy no matter what direction rates go.
Finally, dividend investors should consider that income sustainability and growth generally demand greater attention than initial levels of yield during periods of uncertainty, like those we have today. History shows that high dividend yielding companies typically have less financial flexibility and tend to reduce dividends during periods when economic growth slows. The S&P 500 Dividend Aristocrats, on the other hand, have consistently grown their dividends at attractive rates through numerous difficult environments. This has resulted in higher levels of yield-on-cost over time compared to high dividend yielding companies. Yield-on-cost measures dividend yield based on the original purchase price of a stock, and it can grow significantly over time if a company regularly increases its dividend.
Fixed Income Perspectives

Yields went down, and price went up—as banking sector concerns drove down yields across the curve.
Fixed Income Returns—March 2023
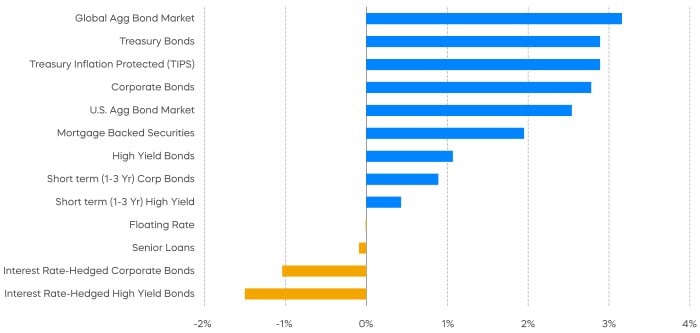
Source: Bloomberg, data from 3/1/23–3/31/23. Index returns are for illustrative purposes only and do not reflect any management fees, transaction costs or expenses. Indexes are unmanaged, and one cannot invest directly in an index. Past performance does not guarantee future results.
Yield curve inversions are generally a bad sign. Since the 2-year versus 10-year yield curve became less inverted in March, that must be a good sign… Right? Not necessarily. It turns out that when an already inverted yield curve becomes less inverted, it may signal that a recession is simply getting closer. The 2-year U.S. Treasury yield generally falls as a result of the anticipation of Fed rate cuts driven by a weak economy. The news was decidedly better over the last month.
Two-Year U.S. Treasury Yield
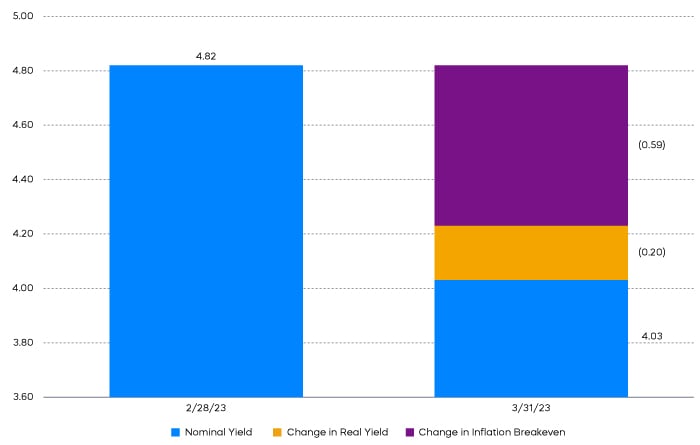
Source: Bloomberg. Data as of 3/31/23.
Most of the decline in the 2-year U.S. Treasury yield in March was reflected in a reduction in inflation expectations. So, expected Fed rate cuts in such a case would not be prompted by a recession or stagflation. Instead, they would be more reflective of inflation declining toward the Fed’s target. That’s a much better story if those inflation expectations materialize.
1Source: FactSet, as of 3/31/23.
2Source: Morningstar, as of 3/31/23.
Sources for data and statistics: Bloomberg, FactSet, Morningstar, and ProShares.
The different market segments represented in the performance recap charts use the following indexes: U.S. Large Cap: S&P 500 TR; U.S. Large Cap Growth: S&P 500 Growth TR; U.S. Large Cap Value: S&P 500 Value TR; U.S. Mid Cap: S&P Mid Cap TR; U.S. Small Cap: Russell 2000 TR; International Developed Stocks: MSCI Daily TR NET EAFE; Emerging Markets Stocks: MSCI Daily TR Net Emerging Markets; Global Infrastructure: Dow Jones Brookfield Global Infrastructure Composite; Commodities: Bloomberg Commodity TR; U.S. Bonds: Bloomberg U.S. Aggregate; U.S. High Yield: Bloomberg Corporate High Yield; International Developed Bonds: Bloomberg Global Agg ex-USD; Emerging Market Bonds: DBIQ Emerging Markets USD Liquid Balanced.
The S&P 500 is a benchmark index published by Standard & Poor's (S&P) representing 500 companies with large-cap market capitalizations. The S&P MIdCap 400 is a benchmark index published by Standard & Poor's (S&P) representing 400 companies with mid-cap market capitalizations. The S&P 500 Dividend Aristocrats Index targets companies that are currently members of the S&P 500 that have increased dividend payments each year for at least 25 years. The Dow Jones U.S. Select Dividend Index aims to represent the U.S.’s leading stocks by dividend yield. THESE ENTITIES AND THEIR AFFILIATES MAKE NO WARRANTIES AND BEAR NO LIABILITY WITH RESPECT TO PROSHARES.
This is not intended to be investment advice. Indexes are unmanaged, and one cannot invest directly in an index. Past performance does not guarantee future results.
Any forward-looking statements herein are based on expectations of ProShare Advisors LLC at this time. Whether or not actual results and developments will conform to ProShare Advisors LLC’s expectations and predictions, however, is subject to a number of risks and uncertainties, including general economic, market and business conditions; changes in laws or regulations or other actions made by governmental authorities or regulatory bodies; and other world economic and political developments. ProShare Advisors LLC undertakes no duty to update or revise any forward-looking statements, whether as a result of new information, future events or otherwise.
Investing is currently subject to additional risks and uncertainties related to COVID-19, including general economic, market and business conditions; changes in laws or regulations or other actions made by governmental authorities or regulatory bodies; and world economic and political developments.
Investing involves risk, including the possible loss of principal. This information is not meant to be investment advice.
The “S&P 500®,” “S&P MidCap 400®,” and “S&P MidCap 400® Dividend Aristocrats® Index” are products of S&P Dow Jones Indices LLC and its affiliates and have been licensed for use by ProShare Advisors LLC. "S&P®" is a registered trademark of Standard & Poor’s Financial Services LLC (“S&P”), and “Dow Jones®" is a registered trademark of Dow Jones Trademark Holdings LLC (“Dow Jones”) and they have been licensed for use by S&P Dow Jones Indices LLC and its affiliates. ProShares ETFs based on these indexes are not sponsored, endorsed, sold or promoted by these entities or their affiliates, and they make no representation regarding the advisability of investing in ProShares ETFs. THESE ENTITIES AND THEIR AFFILIATES MAKE NO WARRANTIES AND BEAR NO LIABILITY WITH RESPECT TO PROSHARES.