


Key Observations

The bond market’s sell-off continued in September. The U.S. 10-year Treasury Yield ended the month at 5.28%, an increase of over 50bps.[1] But the reasons behind rate shifts are worth exploring.
Rising rates may be the biggest market story of 2026, but the current cycle includes a particularly interesting aspect: Higher Treasury rates may dominate the headlines, but an important driver has emerged this cycle. Elevated levels of corporate debt issuance may be one of the key factors driving higher Treasury rates as corporate bonds compete with Treasuries for investors’ attention.
Typically, a surge in corporate debt issuance would lead to wider corporate credit spreads—the yield over and above “risk free” Treasury rates—as issuers compete with one another. In the current environment, however, massive corporate issuance may actually be pushing the “risk free” Treasury rates higher while leaving credit spreads alone.
Chart of the Month
Rising Corporate Credit Yields Have Been Driven by Treasury Rates, Not Expanding Spreads
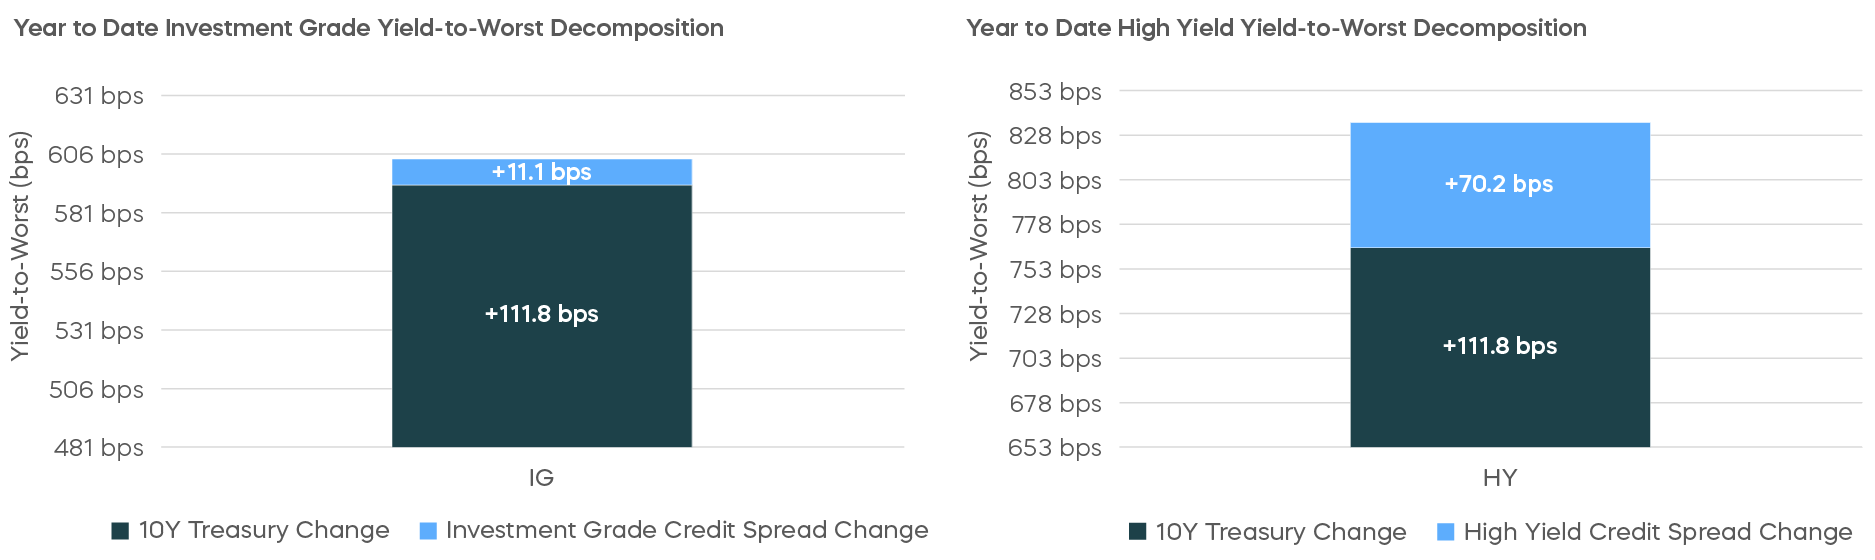
As the charts here show, for investment grade bonds, credit spreads have barely moved, with nearly the entire increase having come from higher Treasury yields. For high-yield bonds, more than half of the increase in corporate bond yields reflected higher Treasury benchmark yields.
What’s the takeaway?
As we made the case in last month’s commentary, Treasury yields, while higher than they have been in some time, may still be in a “normal” range. Those elevated yields seem, so far, to have been accommodated by a relatively healthy economy and rising stock market. It’s also true that, historically, credit spreads are typically negatively correlated with Treasury yields.
Regardless, evidence suggests that elevated corporate issuance has been a significant factor contributing to increased Treasury yields. This may be particularly true on the investment grade side, where issuers with “fortress” balance sheets may be rationally priced to reflect risk not much higher than U.S. Treasuries.
If we are in an environment where corporate bond issuance is influencing Treasury yields, strategies for hedging Treasury rate risk may have added appeal.
Asset Class Perspectives
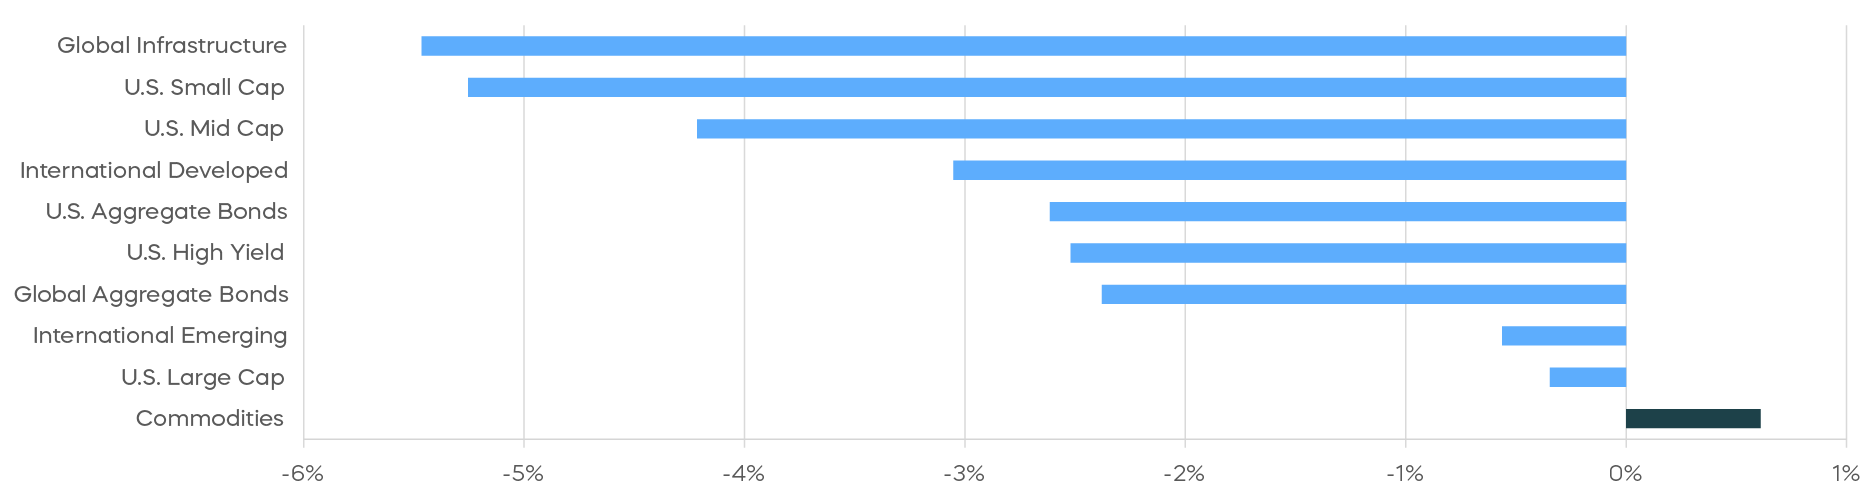
Asset Class Returns—September 2026
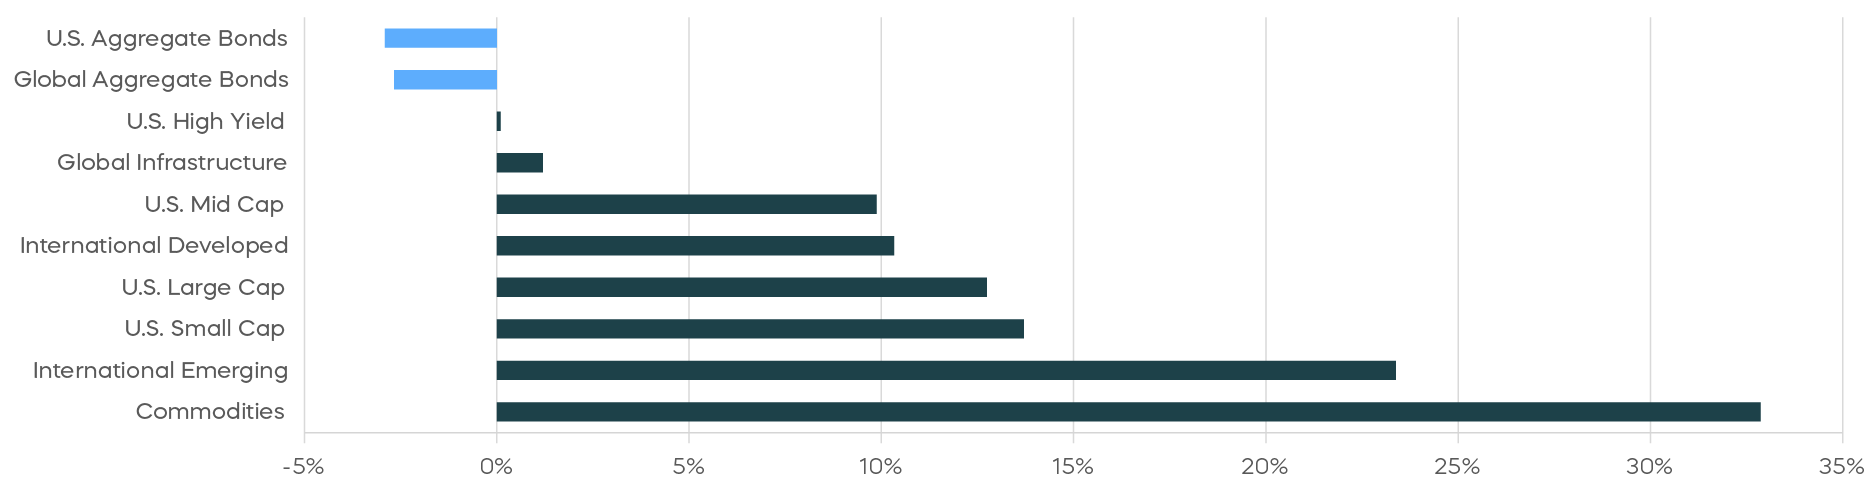
Asset Class Returns—Year-to-Date 2026
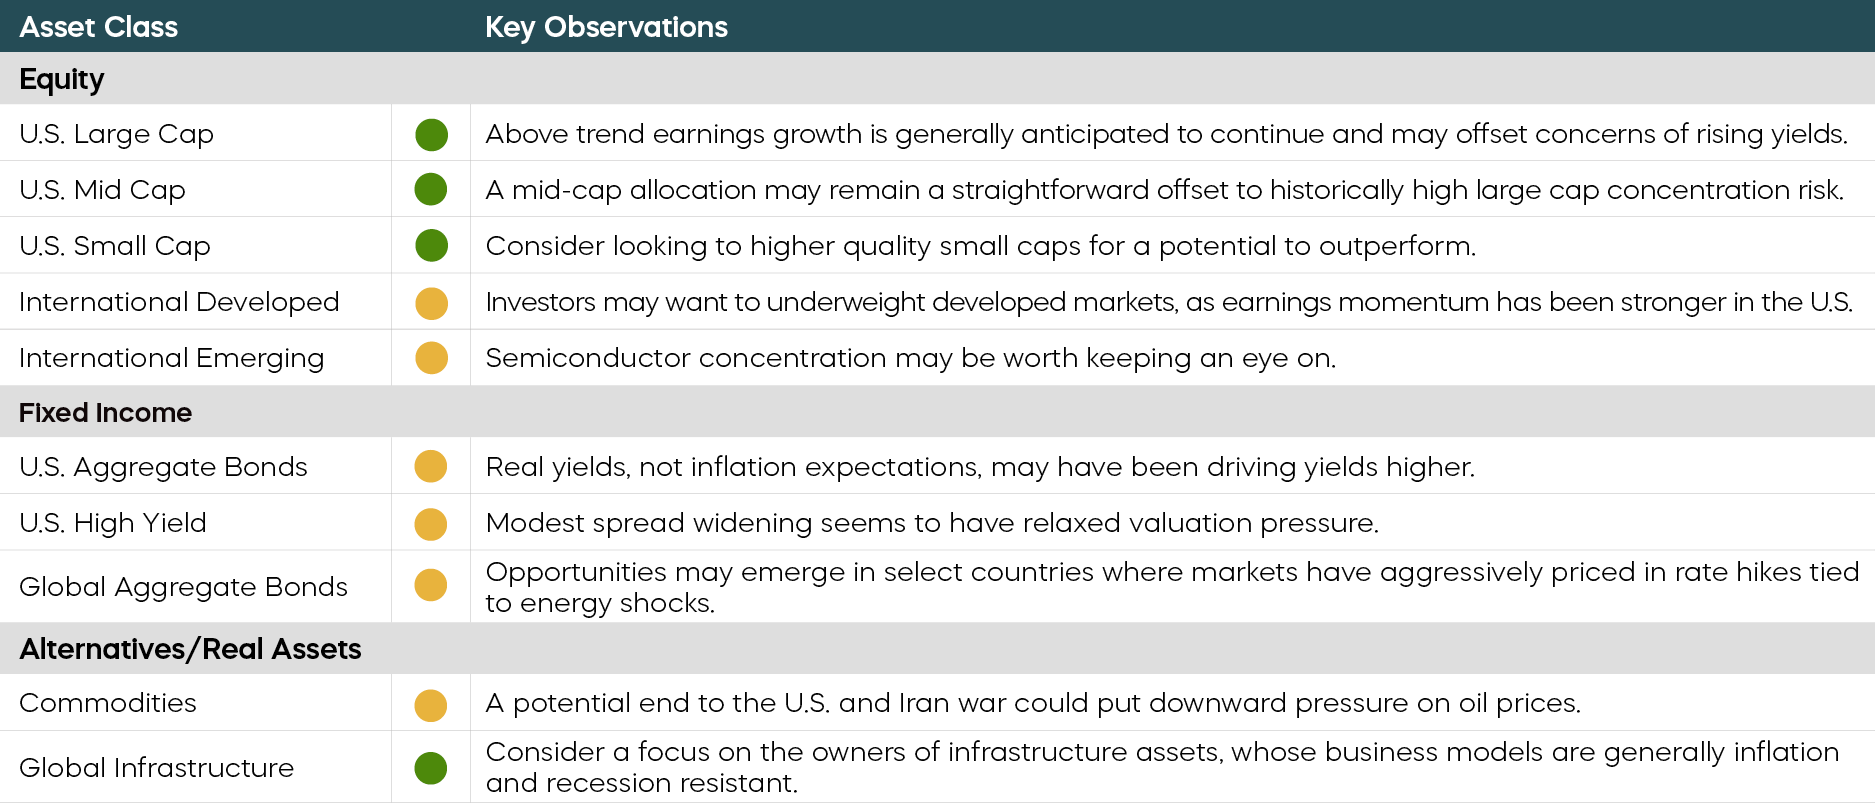
The following are observations on a range of asset classes. Green indicates a constructive backdrop and yellow indicates a neutral environment. Red, while not shown here, would indicate a challenging backdrop.
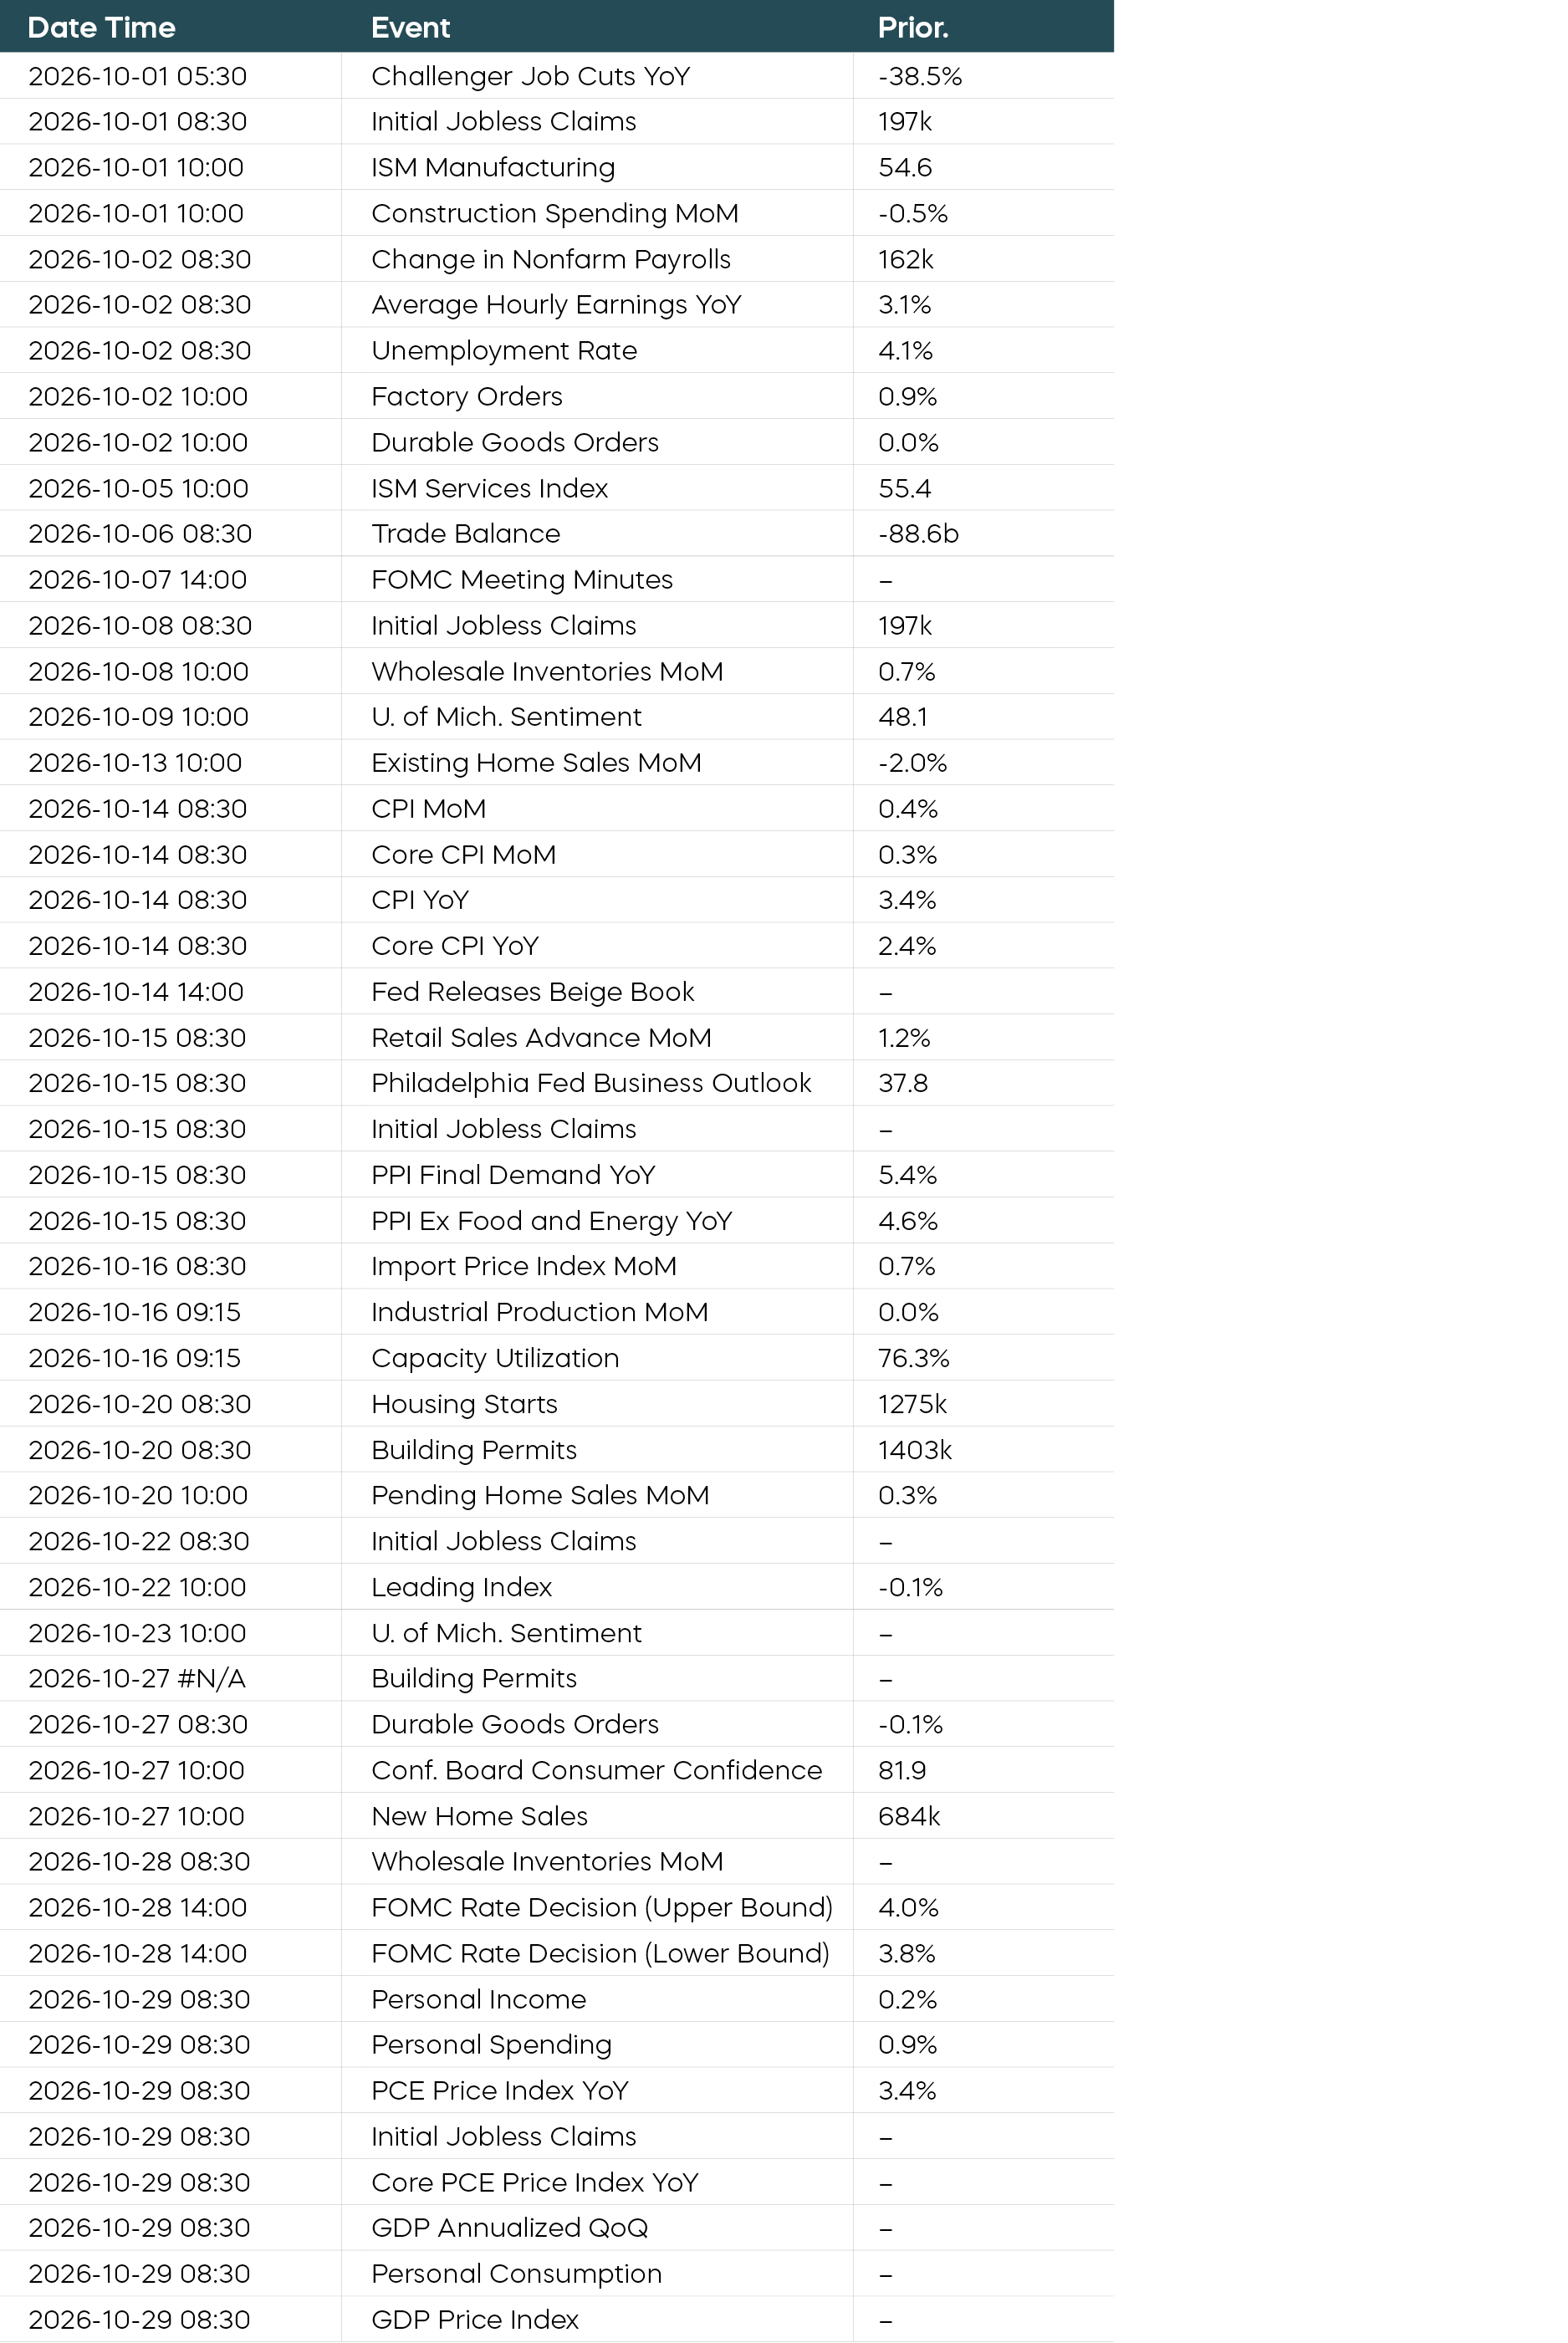
Economic Calendar
Following is a list of key and upcoming economic releases, which may serve as a guide to potential market indicators.
Equity Perspectives
 Can equity markets continue to shrug off rising rates?
The bond market rout, with Treasury yields rising to multi-year highs, has been a dominant story for the past month. Nonetheless, U.S. equities seem to be entering the fourth quarter in a position of relative strength. Solid year-to-date gains seem to be supported by a resilient economic backdrop and solid corporate fundamentals.
In a reversal from second-quarter trends, September’s equity market leaders were mostly mega-cap growth and high-momentum stocks. Mid- and small-cap stocks declined during the month, as did quality and dividend-oriented stocks.[2]
Notably, a divergence has emerged across equity and bond market implied volatility levels that warrants close attention.
In last month’s commentary, we noted that equity performance has been influenced more by the pace and volatility of changes in interest rates, rather than by direction alone. Let’s look at the relationship between those trends again in the chart that follows. Before September, the general level of volatility in interest rate movements (as measured by the MOVE Index) had been relatively well contained and paralleled the changes in the level of equity volatility (as measured by the VIX).
That changed in late September, though. The MOVE Index surged to levels on its scale that are more typically associated with periods of elevated macroeconomic uncertainty. Meanwhile, the level of VIX remained relatively subdued and ended the month near 16, indicating that risk may be manageable.
Bond and Equity Volatility Diverged in September
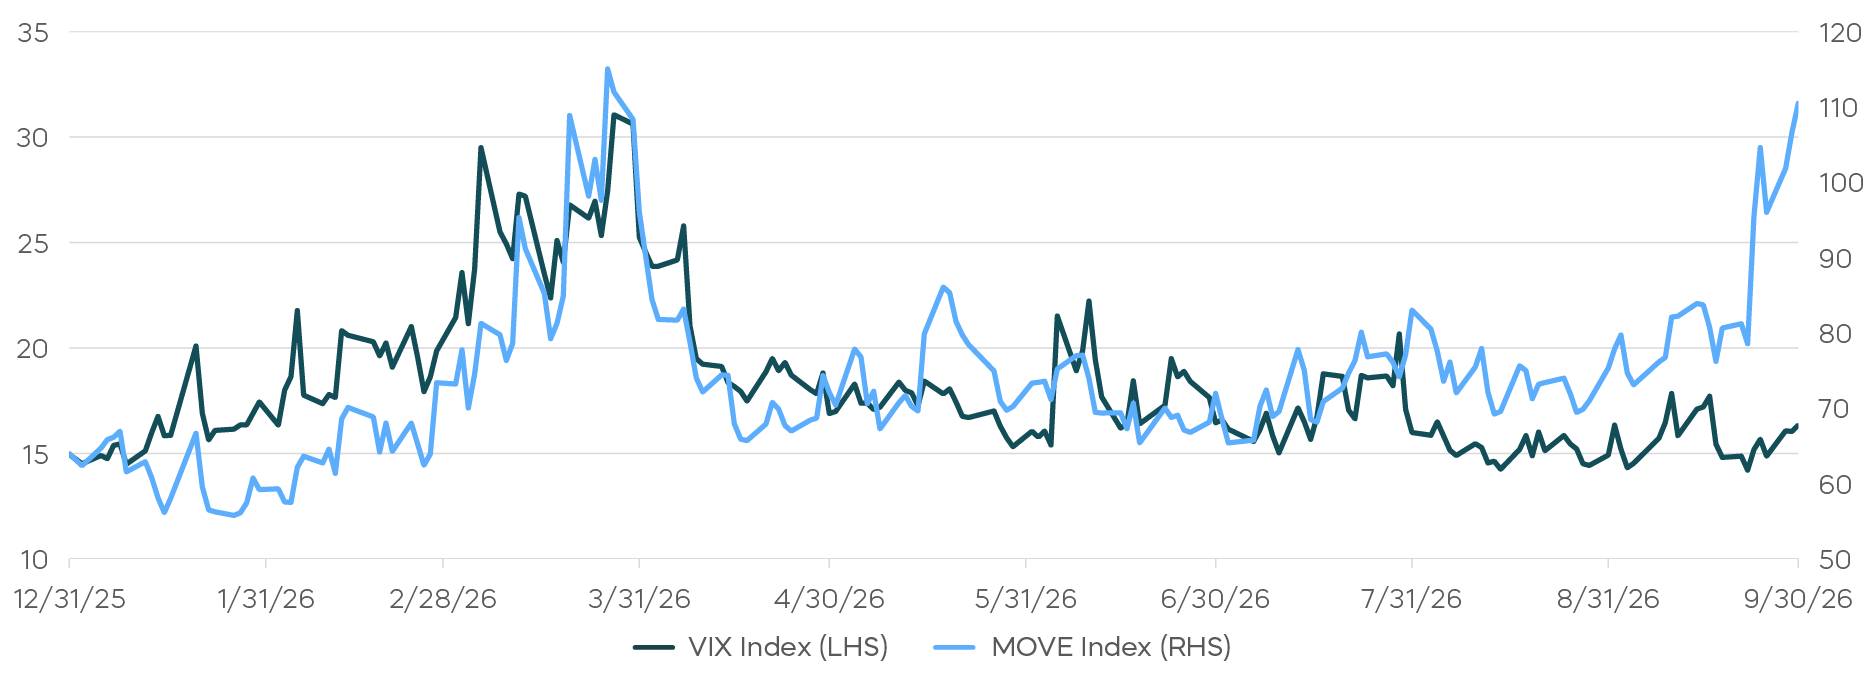
Which index is sending the potentially more accurate signal? While the relationship is imperfect, elevated bond-market volatility has frequently preceded a more challenging environment for equities. A further rise in bond-market volatility could increase pressure on already elevated equity multiples.
But to be clear, the earnings outlook seems to remain robust and there does not appear to be any overt threat pointing to a potential deterioration in equity markets. If Treasury yields stabilize and the MOVE Index retreats, equities could advance through the end of the year.
How can investors actively defend against rising rates?
As interest rates rose in September, market action underscored the need for investors to consider the implications in their equity portfolios. The large-cap-focused S&P 500 produced modest gains, while mid- and small-cap stocks declined. Historically, equity performance has varied during periods of rising rates. The financials and energy sectors have generally performed well, while rate-sensitive sectors like utilities and real estate investment trusts (REITs) typically have not. Third-quarter results were no different. Energy stocks produced returns of 17% for the quarter while utilities declined by over 12%.[3]
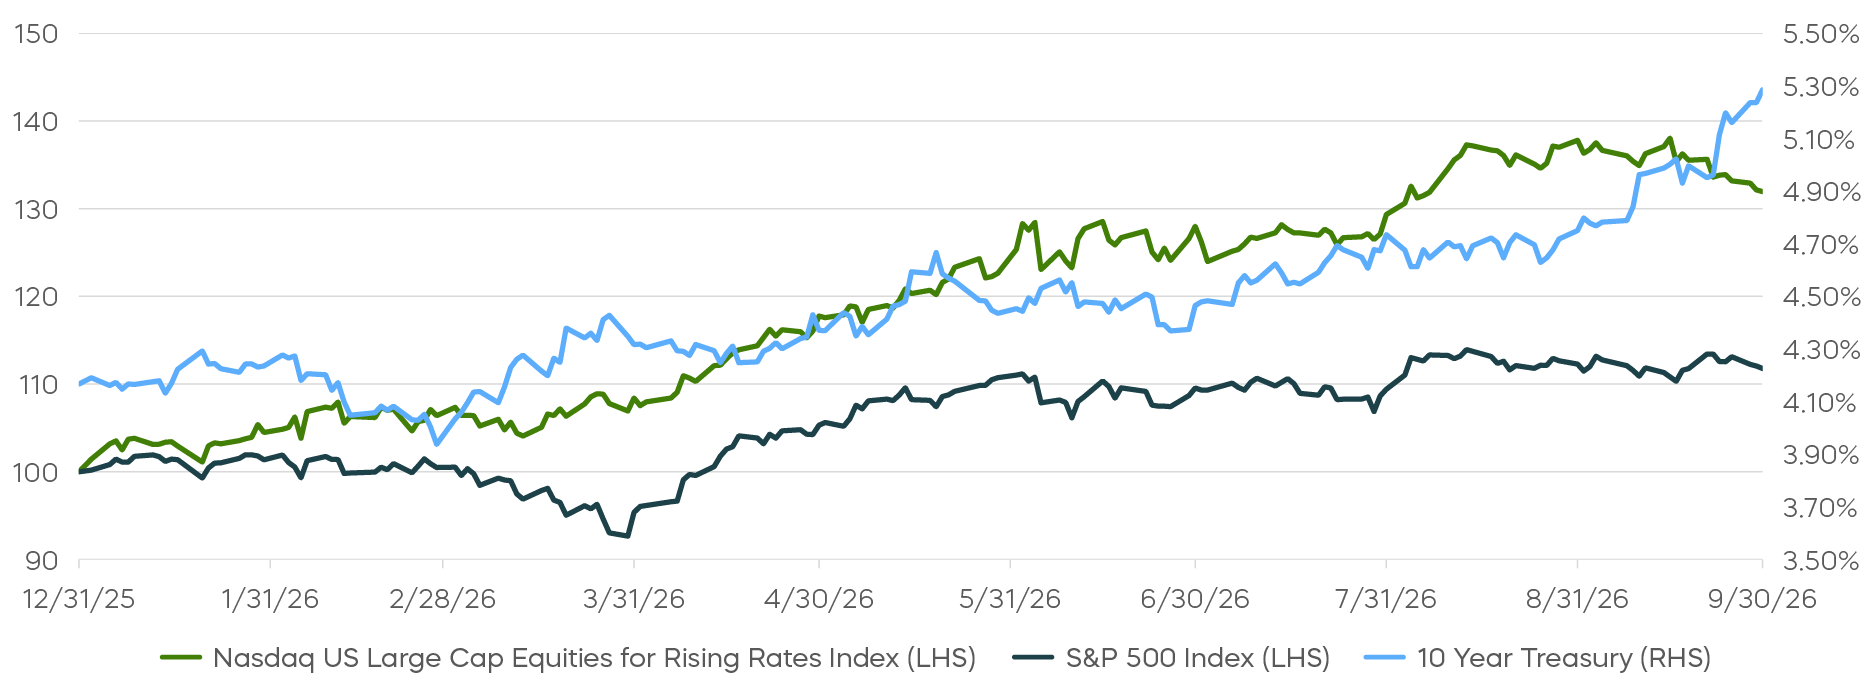
Investors may be able to take advantage of these dynamics by focusing on a strategy specifically designed to outperform when interest rates rise: the Nasdaq U.S. Large Cap Equities for Rising Rates Index. The strategy targets the five sectors with the highest recent correlations to changes in 10-year U.S. Treasury yields, and within those sectors the stocks that have tended to outperform as rates have risen. Reconstituted every three months, this approach produces an index with a dynamic portfolio of 50 stocks from five sectors. The sectors with the highest correlation to rates have the highest weighting and the stocks within each of the five sectors are equally weighted.
The index’s recent performance illustrates how an equity strategy specifically designed for a rising rate environment may help investors go on the offensive when Treasury yields are on the rise.
The Nasdaq U.S. Large Cap Equities for Rising Rates Index Has Outperformed This Year
Fixed Income Perspectives
There are plenty of concerns across the bond landscape. But some corners of the market that have given investors pause recently, including fixed-rate mortgages and private credit, still seem to be working as intended.
There’s no denying the U.S. housing market is moribund, as potential buyers navigate mortgage rates above 7% against a backdrop of record-high prices. Low turnover in existing homes isn’t helping either, as long-time homeowners are staying put in their homes enjoying the 3% to 4% fixed mortgage rates they secured years ago.
But is that “locked-in” effect, for current homeowners who refuse to sell, really such a bad thing? Not necessarily, if you consider the alternatives.
Faced with fewer (and costlier) options for housing, some buyers are starting to turn once again to floating-rate mortgages to access more reasonable rates. This sparks memories of the Great Financial Crisis, when failures of the securitized versions of such loans sent the economy into a tailspin.
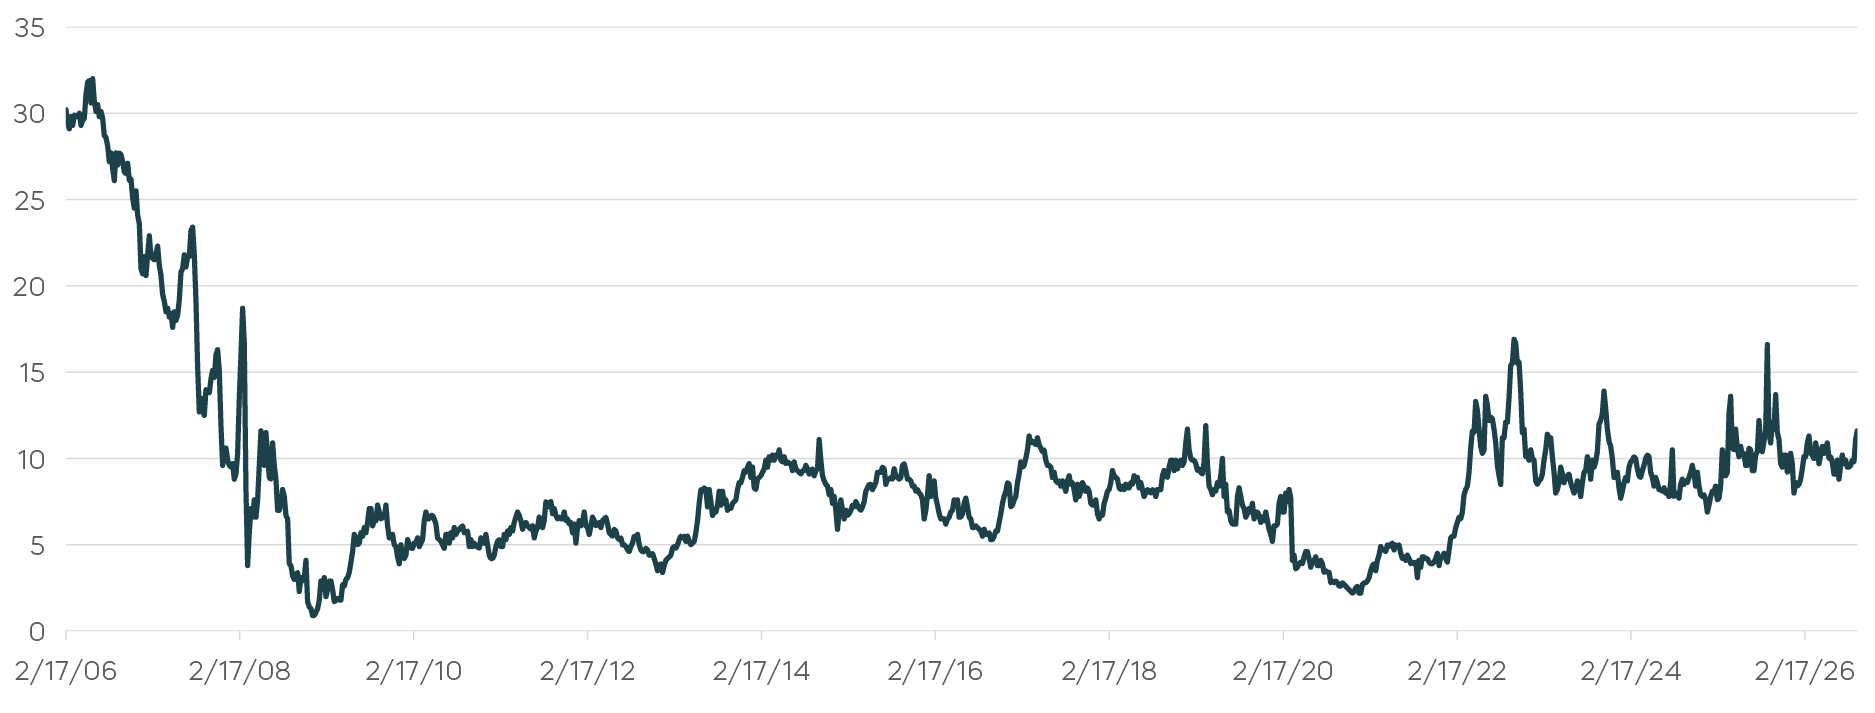
The use of adjustable-rate mortgages remains relatively low
So far, the share of new adjustable-rate mortgages being issued continues to be low, and any risk of a return to past failures seems well contained.
Adjustable-Rate Mortgage (ARM) Share of U.S. Mortgage Applications Remains Low
As for the millions of homeowners who retain fixed mortgages locked in at less than half of today’s rate? Their spending power may be contributing to broad economic resilience.
Private credit is growing, and that’s OK.
Over the past decade, private credit has grown nearly three times faster than overall corporate borrowing.[4] So how should investors frame its rising popularity?
Again, a broader perspective is important. First, private credit still only amounts to roughly 9% of corporate borrowing.[5] Second, that expansion of private credit is probably a direct result of the Great Financial Crisis, which prompted tighter financial market regulation designed to move potentially challenging debt away from large banks. As a result, if any stress emerges among private credit issues, damage could be less widespread among systemically important lenders.
Also, the underlying fundamentals for the larger public market are generally quite strong.
Net debt to EBITDA for S&P 500 companies averaged 4.3X at the beginning of this century and leading up to the Great Financial Crisis. Today, that metric stands at around 1.5X and is forecast to fall even further by the end of the year.[6] Earnings have been strong, as has cash flow growth. And lower debt ratios may be a sign of increased corporate financial prudence. Some lessons seem to have been learned.
When you combine today’s increasingly strong fundamentals with the apparently solid economy and meaningfully positive structural changes, you get a supportive backdrop for corporate credit, even if Treasury rates continue to tick upward.
[1] Source: Bloomberg, data as of 10/1/26.
[2] Source: Standard & Poor's as of 9/30/26.
[3] Source: Bloomberg data as of 9/30/26.
[4] Source: JP Morgan, “Why private credit remains a strong opportunity,” 7/31/25.
[5] Source: JP Morgan, “Why private credit remains a strong opportunity,” 7/31/25.
[6] Source: Bloomberg, data as of 10/1/26.