


Key Observations

- Markets reacted positively to an orderly election outcome, but elevated equity expectations and stubborn inflation suggest investors should remain selective across stocks and bonds.
- Stocks have done well historically after midterm elections, and companies could benefit from the “good gridlock” of two parties in power.
- Bonds may require more nuance, as Treasurys continue to digest inflation and shifting “real” rates.
It’s true in both politics and investing: Performance only matters relative to expectations. For stocks, third-quarter earnings season has delivered a blended earnings growth rate of 30.2% year over year, with 60% of companies reporting. Yet those impressive results have been greeted with skepticism and poor stock market performance. There’s no mystery here. Expectations are simply very high.
Meanwhile, a “blue wave” following midterm election results, featuring a substantial Democratic performance, exceeded expectations. That has kicked off a substantial rally. But what, exactly, does the election mean for markets?
There’s a notion among investors that the stock market loves gridlock: Give it a divided government with limited ability to change rules and regulation, and companies can thrive, as the theory goes. Wouldn’t a Democratic victory of this magnitude, which delivered both the House and the Senate to single-party control again, be viewed negatively by the market?
The answer may lie with market expectations for “good gridlock.” The sheer scale of the Democratic victory was a likely driver of President Trump declaring that he was “absolutely willing to accept those results,” removing much of the threat of post-election chaos and litigation—a clear positive for markets. But the president said something else as well. He declared himself “Mr. Veto.” As a result, gridlock may be alive and well. Thus, the sweet spot for companies may be here—a well-behaved democracy where not much changes. That is perhaps the expectation that was exceeded on election day.
Chart of the Month
U.S. Stocks Have Historically Performed Well in the Months After Midterm Elections
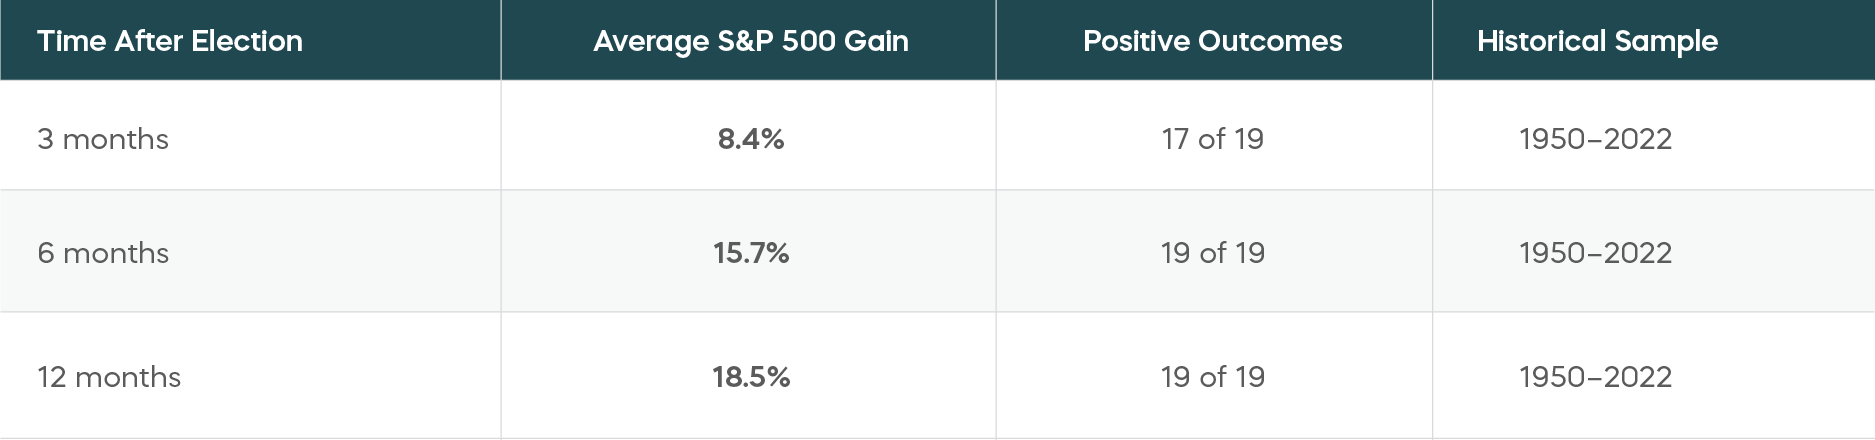 Source: Bloomberg. Data from 1950-2022, using the S&P 500 as the benchmark.
Any “good gridlock” outperformance piles on top of historically strong stock market performance post midterm elections. Now, if there were just a few more areas of the stock market where expectations weren’t quite so high…
Asset Class Perspectives
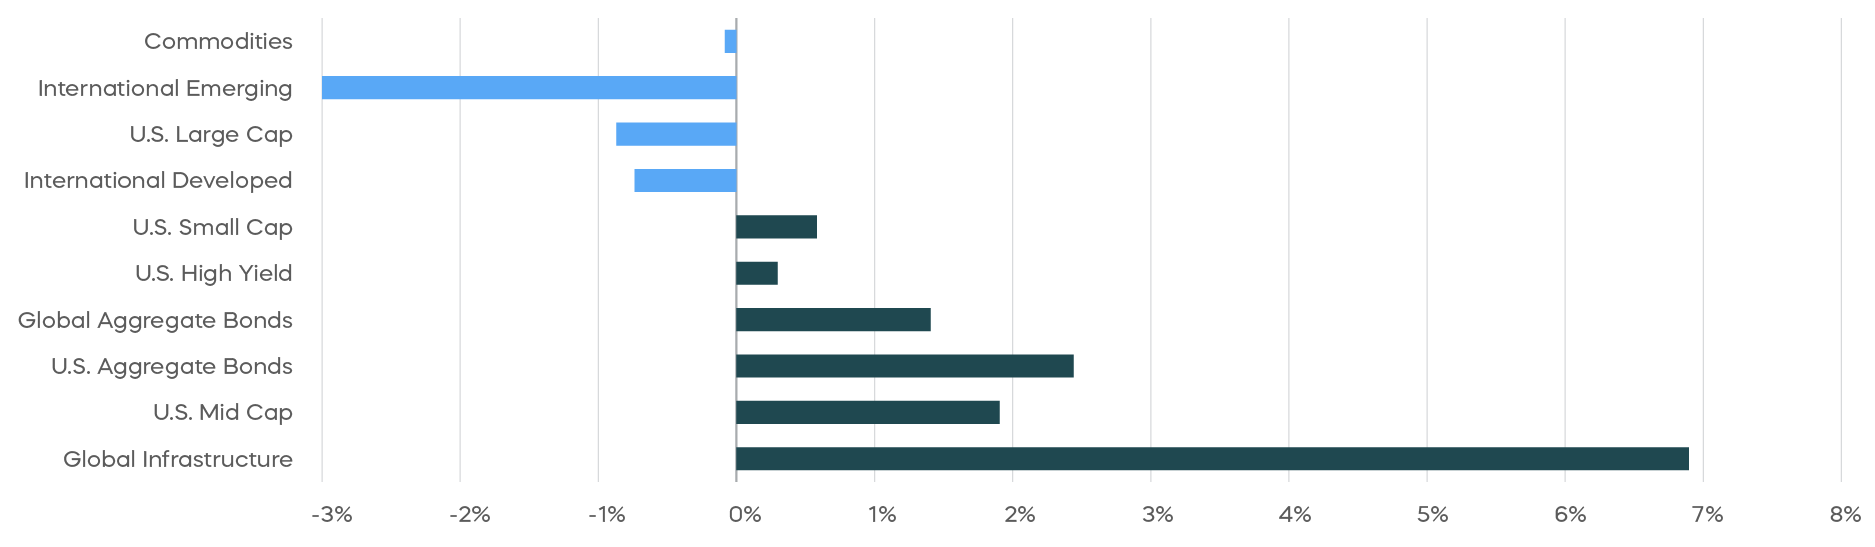
Asset Class Returns—October 2026
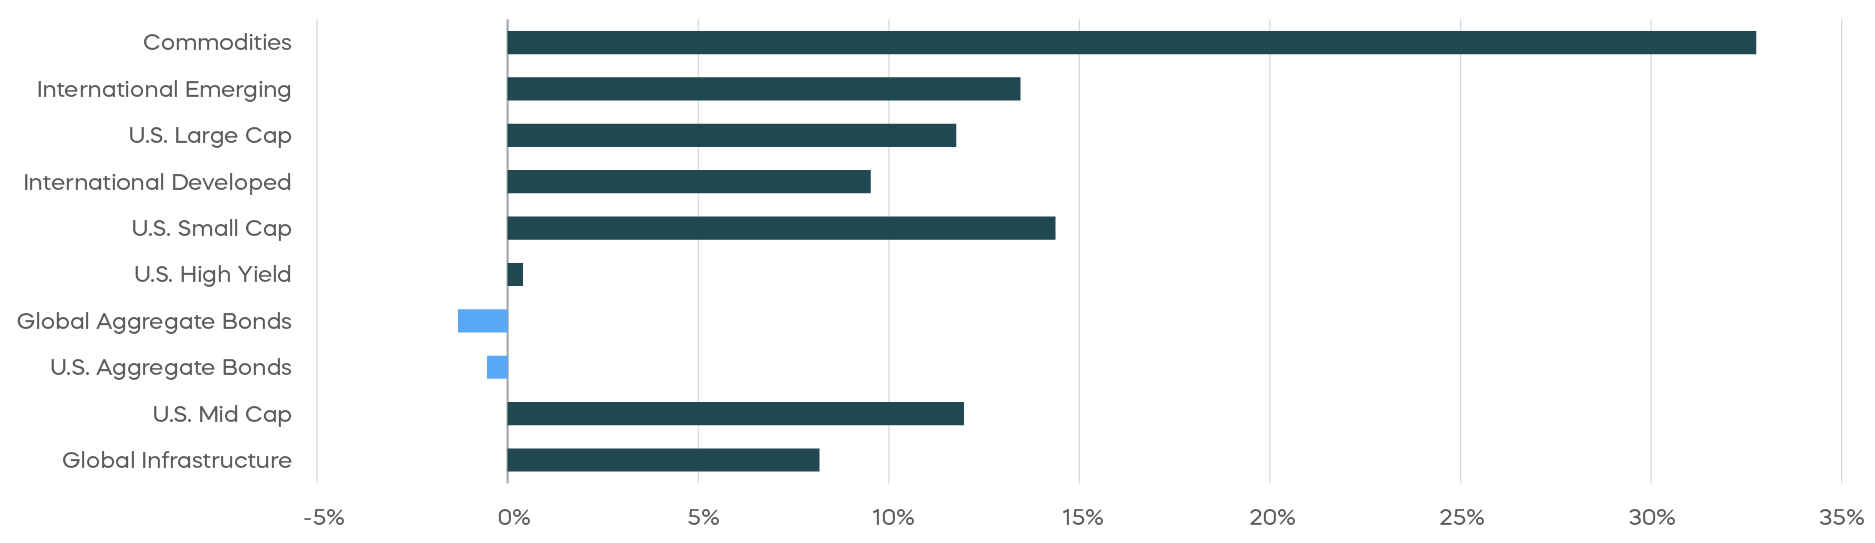
Asset Class Returns—Year-to-Date 2026
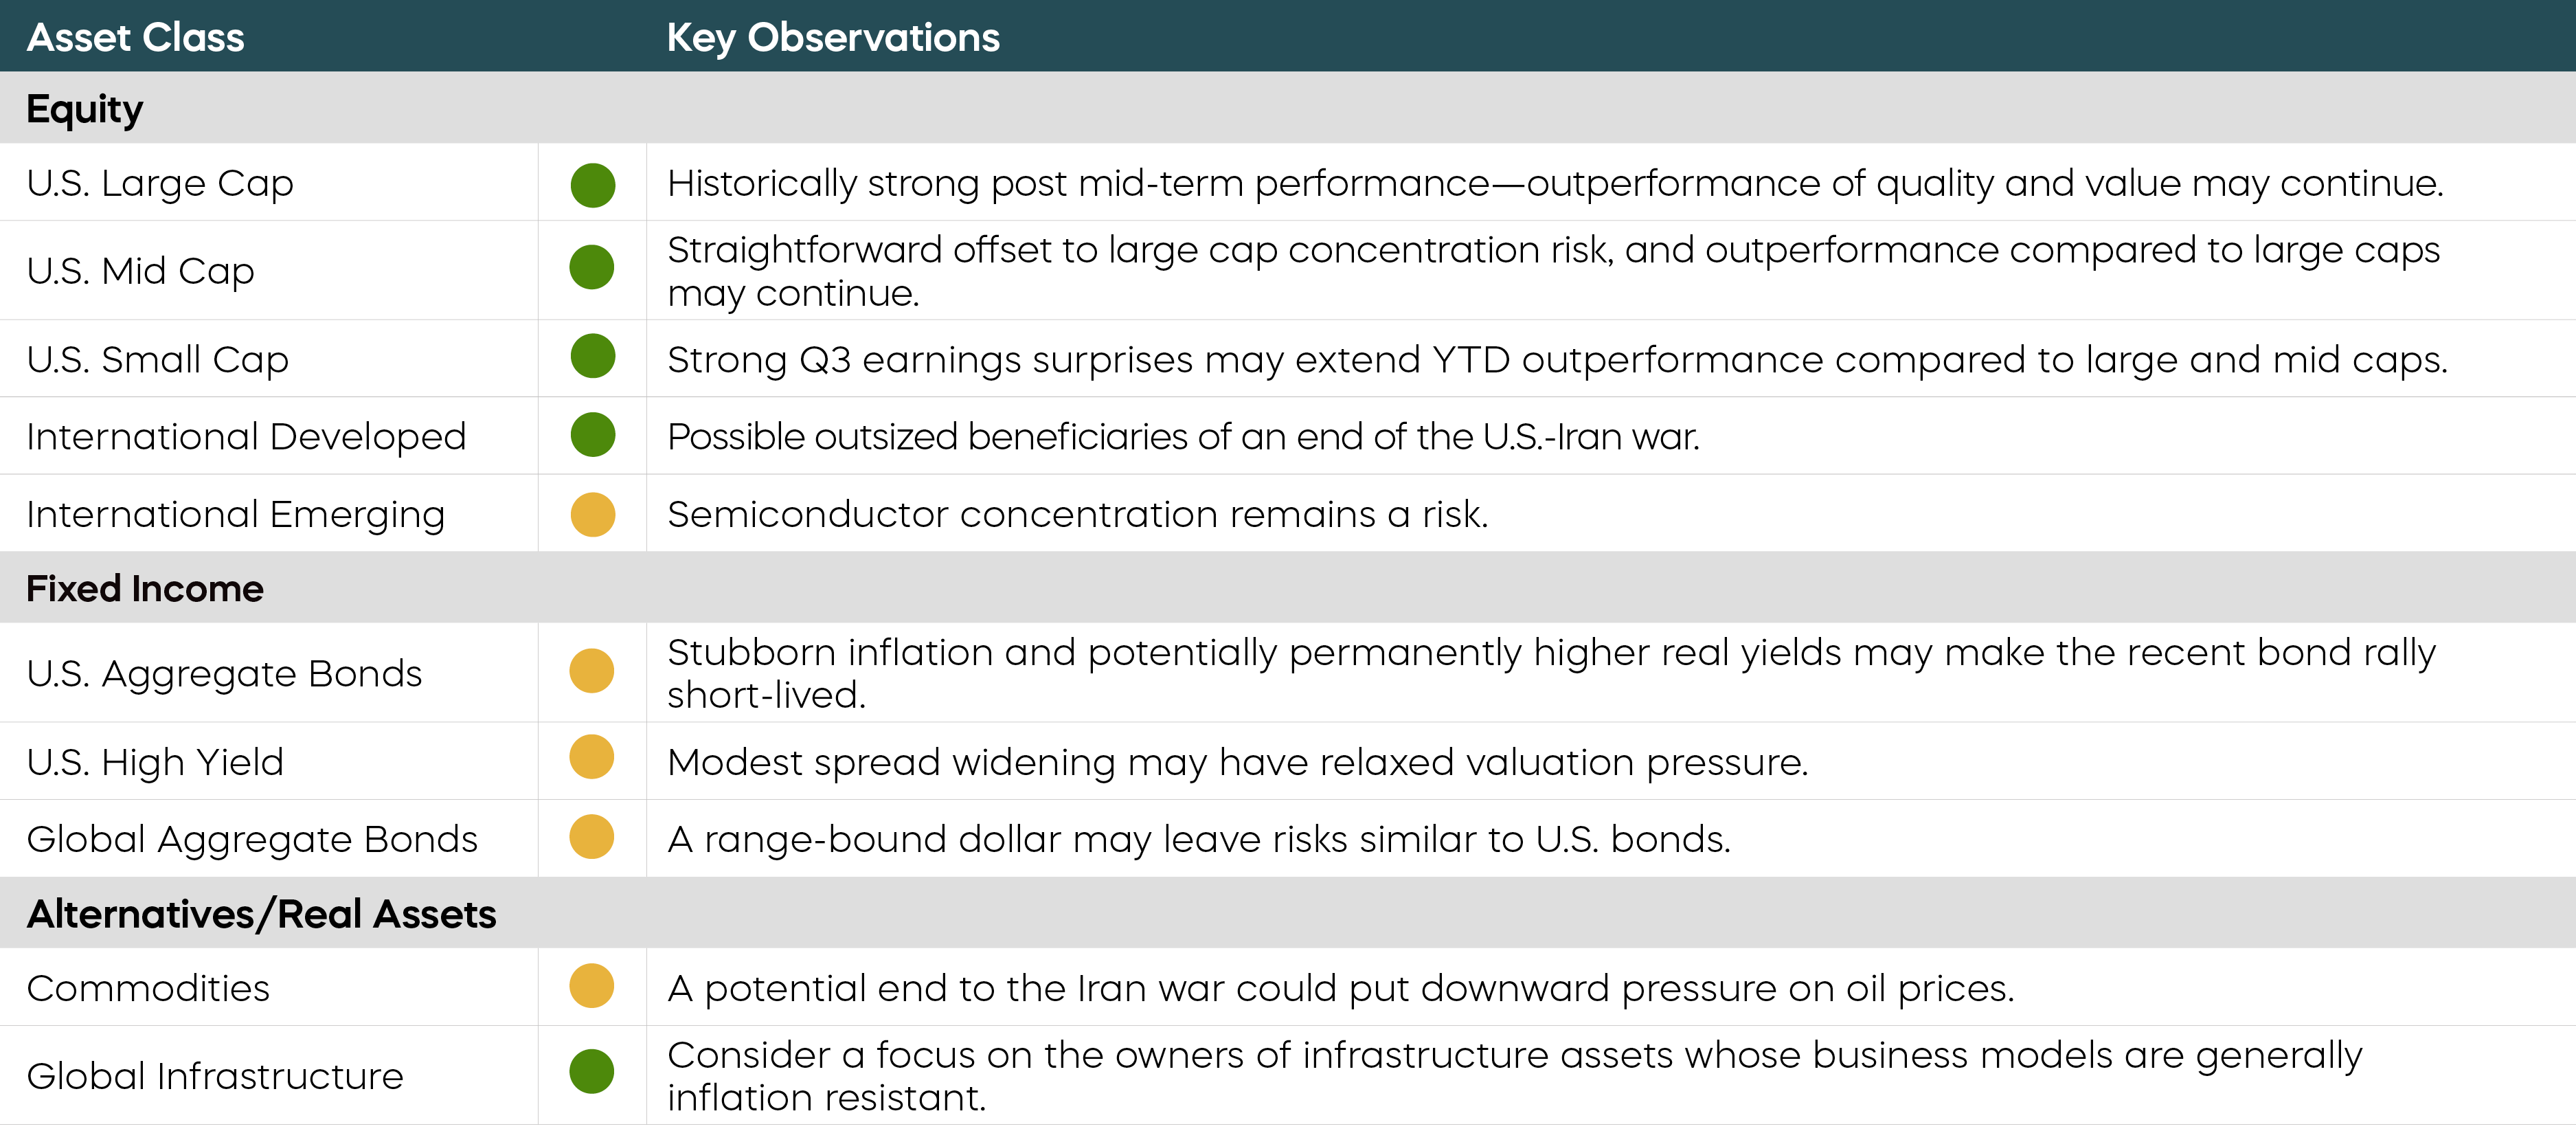
The following are observations on a range of asset classes. For each, green indicates a constructive backdrop, yellow indicates a neutral environment, and red would indicate a challenging backdrop.
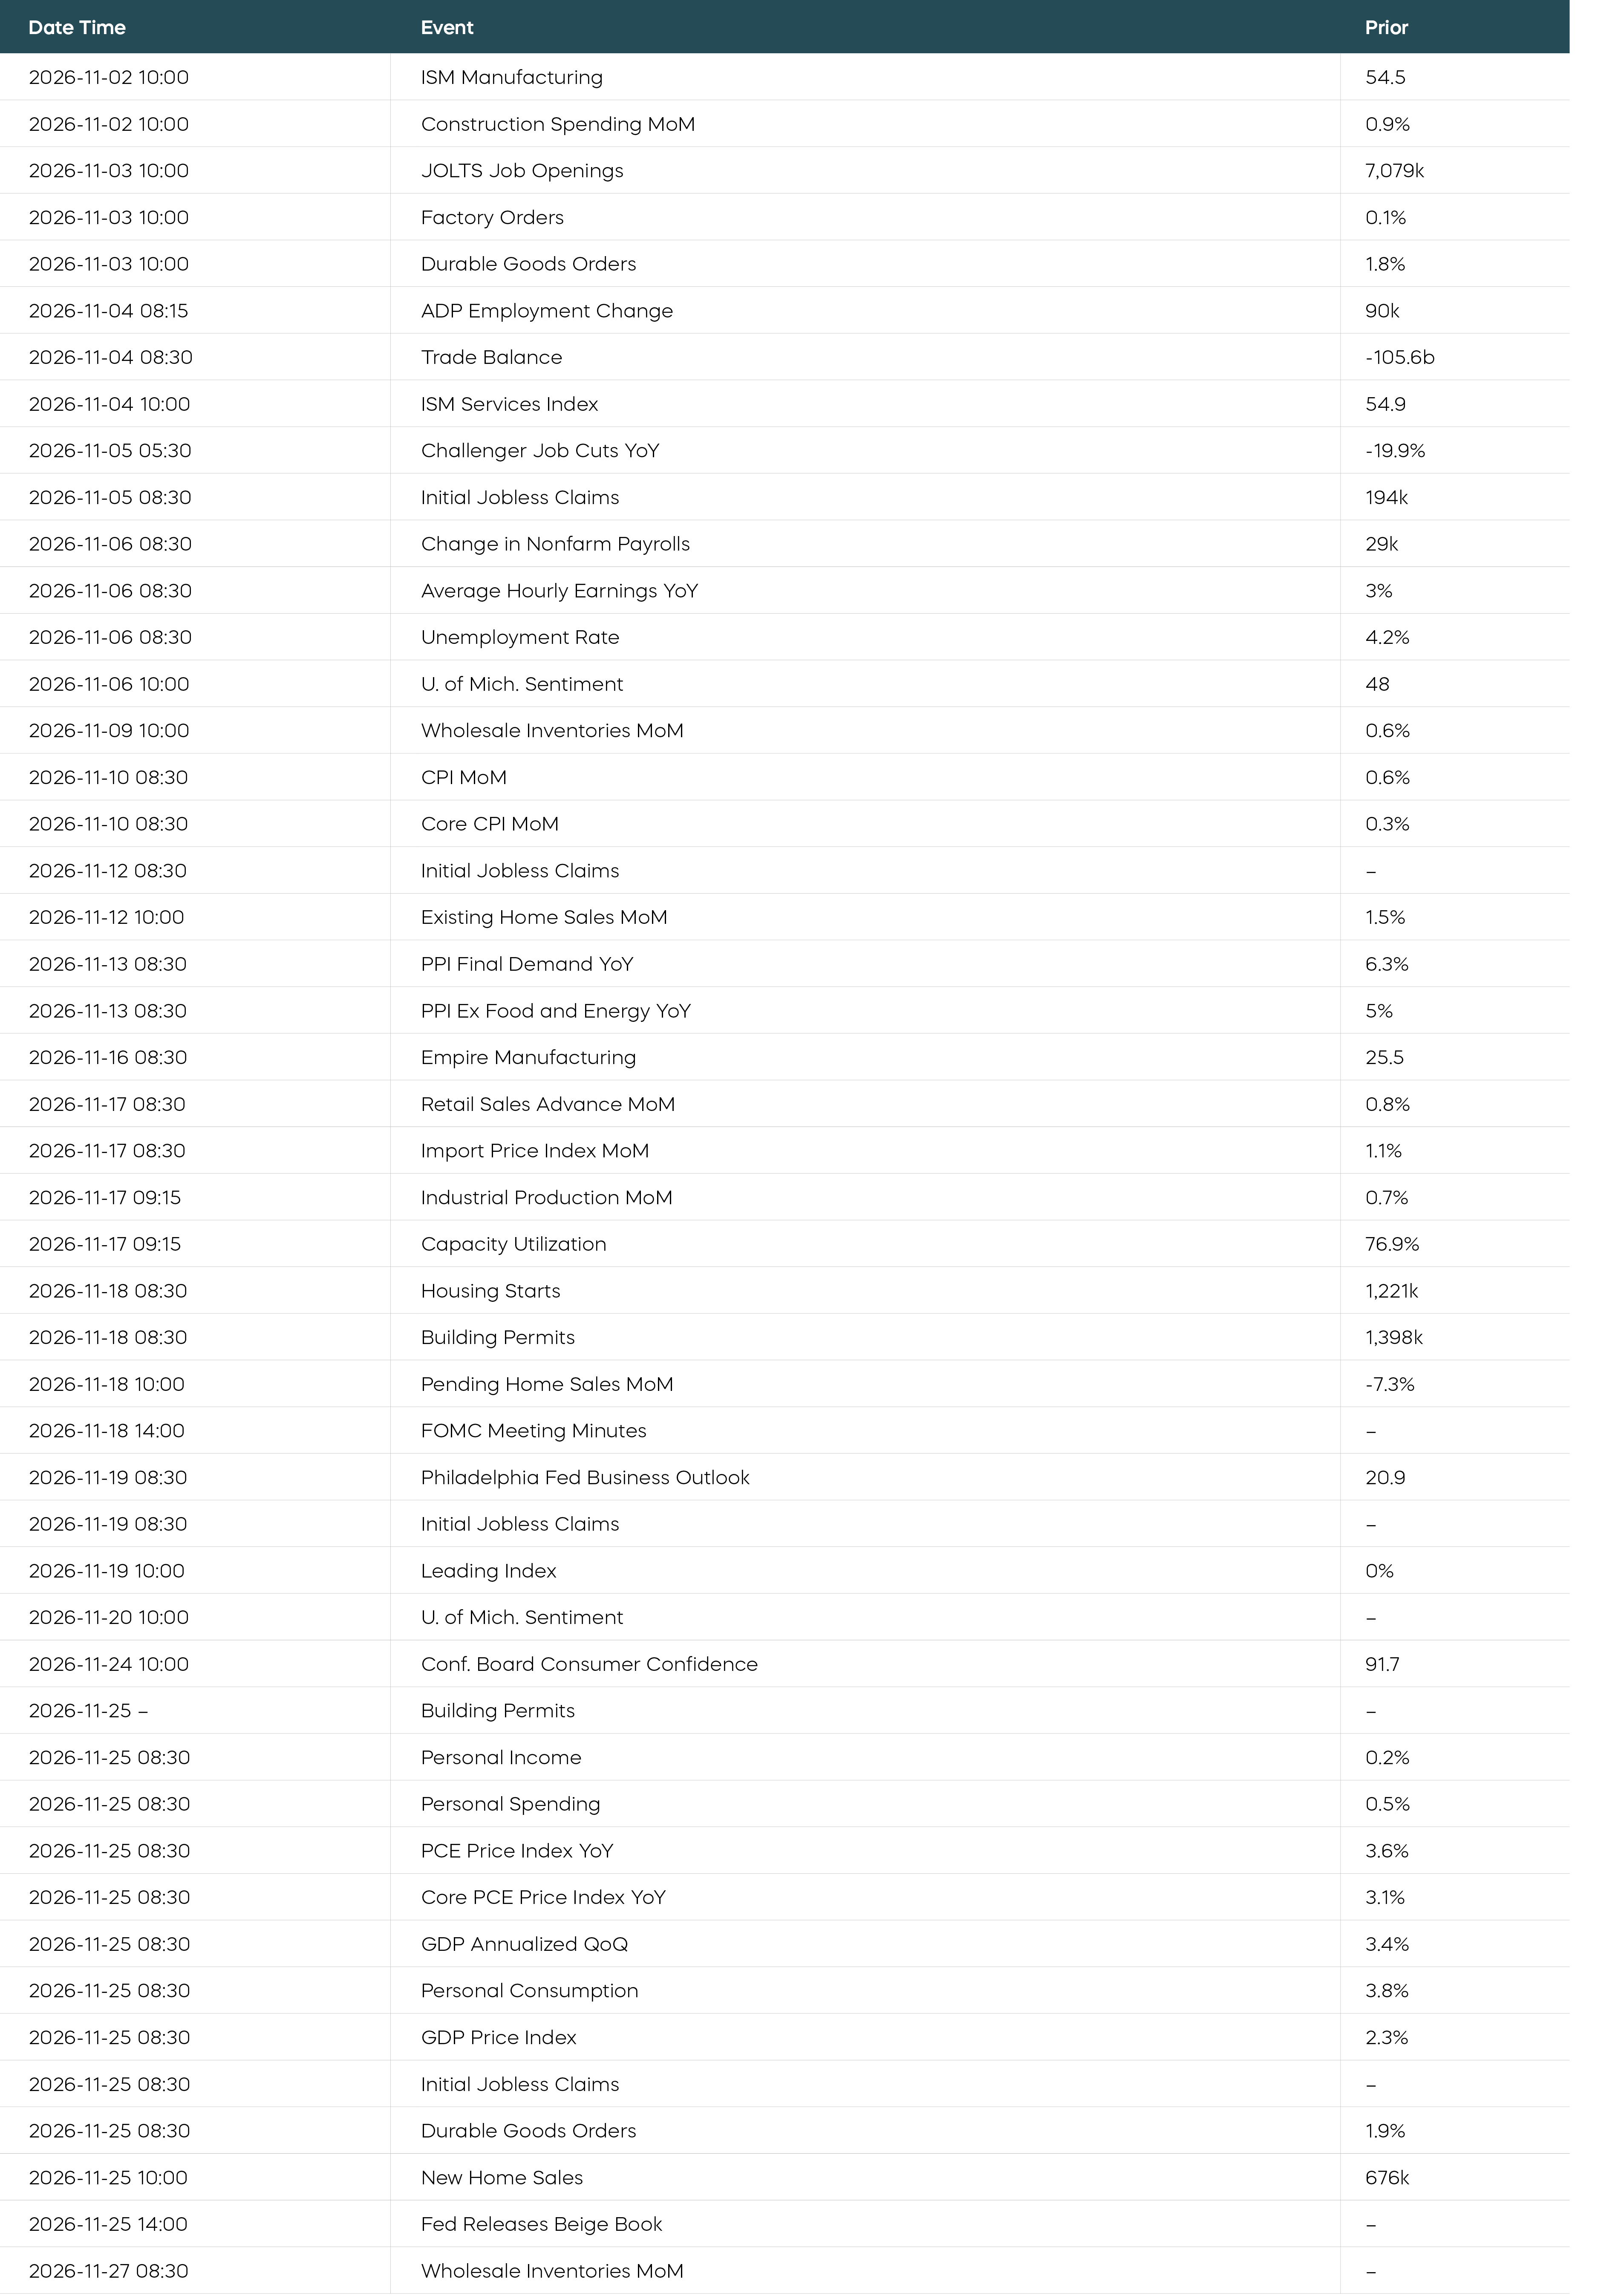
Economic Calendar
Following is a list of key and upcoming economic releases, which may serve as a guide to potential market indicators.
Equity Perspectives

- Third-quarter earnings season is delivering another impressive demonstration of corporate America's resilience.
- Despite elevated interest rates, high energy prices, and ongoing global conflicts, earnings growth is high. But so are expectations.
- Strong earnings are no longer necessarily translating into strong stock performance. Outperformance in October came from the Dividend Aristocrats—a strategy with low expectations but strong earnings momentum.
Through October 30, approximately 60% of S&P 500 companies had reported third-quarter results, with 82% exceeding earnings expectations, according to FactSet. Aggregate earnings growth was running just over 30% year over year, reinforcing the fundamental driver that has continued to support equity prices throughout 2026. There is, however, an important distinction between strong earnings and earnings relative to expectations. FactSet reports that over the last 10 years, 77% of companies within the S&P 500 typically beat expectations. So, the current 82% beat rate is above the 10-year average of 77%. More notable is that aggregate reported earnings this quarter are just 1.9% above estimates, compared with a 10-year average earnings surprise of approximately 8%. In other words, companies are delivering excellent results, but investors have already anticipated much of that strength.
When good earnings are no longer good enough
Several high-profile earnings announcements illustrate the increasingly demanding equity environment. Caterpillar reported third-quarter adjusted earnings of $7.20 per share, exceeding consensus estimates, with sales and revenues increasing 17% year over year. Nevertheless, its shares declined approximately 9% following the announcement. Tech names Fortinet and ServiceNow also beat consensus earnings and revenue expectations, yet their shares declined approximately 20% following the announcements.
These examples underscore an important point: When valuations reflect expectations for exceptional performance, simply beating quarterly estimates may not be sufficient. Investors are becoming increasingly discerning. They are demanding evidence that earnings momentum can accelerate, margins should remain sustainable, and eye-popping capital expenditures may ultimately generate attractive returns.
Earnings growth is broadening beyond the Magnificent Seven
While the S&P 500 remains top-heavy (technology is still almost 40% of the S&P 500) and narrow from a contribution perspective (just 10 stocks have contributed over half of the 2026 returns), fundamentals are broadening. According to FactSet, the third-quarter earnings growth rate for the S&P 493—the S&P 500 excluding the Magnificent Seven—has increased to 32.6%, compared with 22.6% for the Magnificent Seven. This represents a meaningful reversal from recent quarters, when mega-cap technology companies dominated earnings growth.
Earnings Growth Broadens Beyond the Magnificent Seven
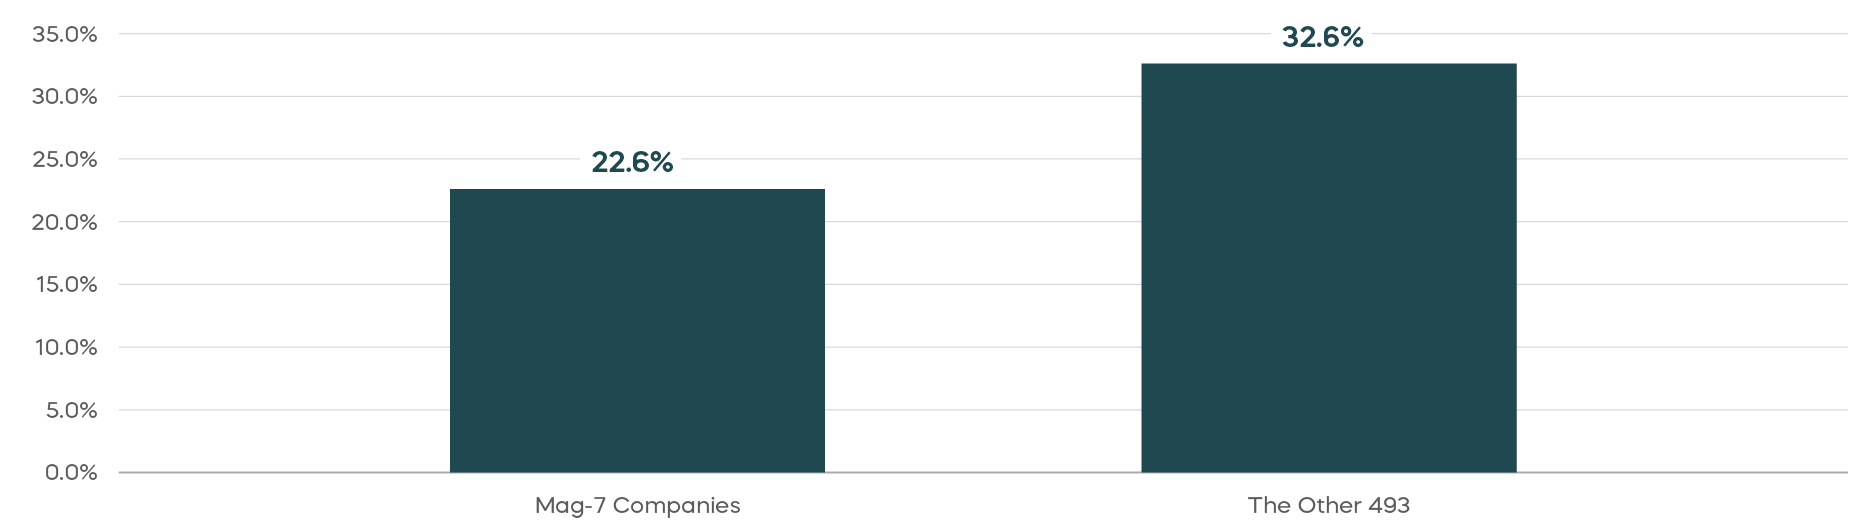
Importantly, according to FactSet, the S&P 493's earnings growth estimate has risen from 27.8% at the end of September, while the Magnificent Seven's estimate has declined from 33.6%. This development could have important implications for equity leadership. For much of the past several years, investors have rewarded companies offering the strongest earnings growth, particularly among mega-cap technology stocks. As earnings growth becomes more widely distributed, opportunities for outperformance may increasingly extend beyond this narrow group.
In short, earnings growth is broadening beyond mega-cap technology, but high valuations leave little room for disappointment.
The Aristocrats could be positioned for times like these
Given that the bar for earnings growth is high and surprises few, identifying stocks with lower expectations and strong earnings revisions may position investors to potentially outperform. Dividend strategies have been decidedly out of favor in a period of growth stock dominance, but remain valuable strategies. Therein lies the opportunity. The S&P 500 Dividend Aristocrats—companies that have increased their dividends for at least 25 consecutive years—continue to trade at discounted valuations relative to the broad market. They are also showing much stronger earnings momentum, suggesting improving fundamental momentum among companies with established records of profitability, financial discipline, and growing distributions.
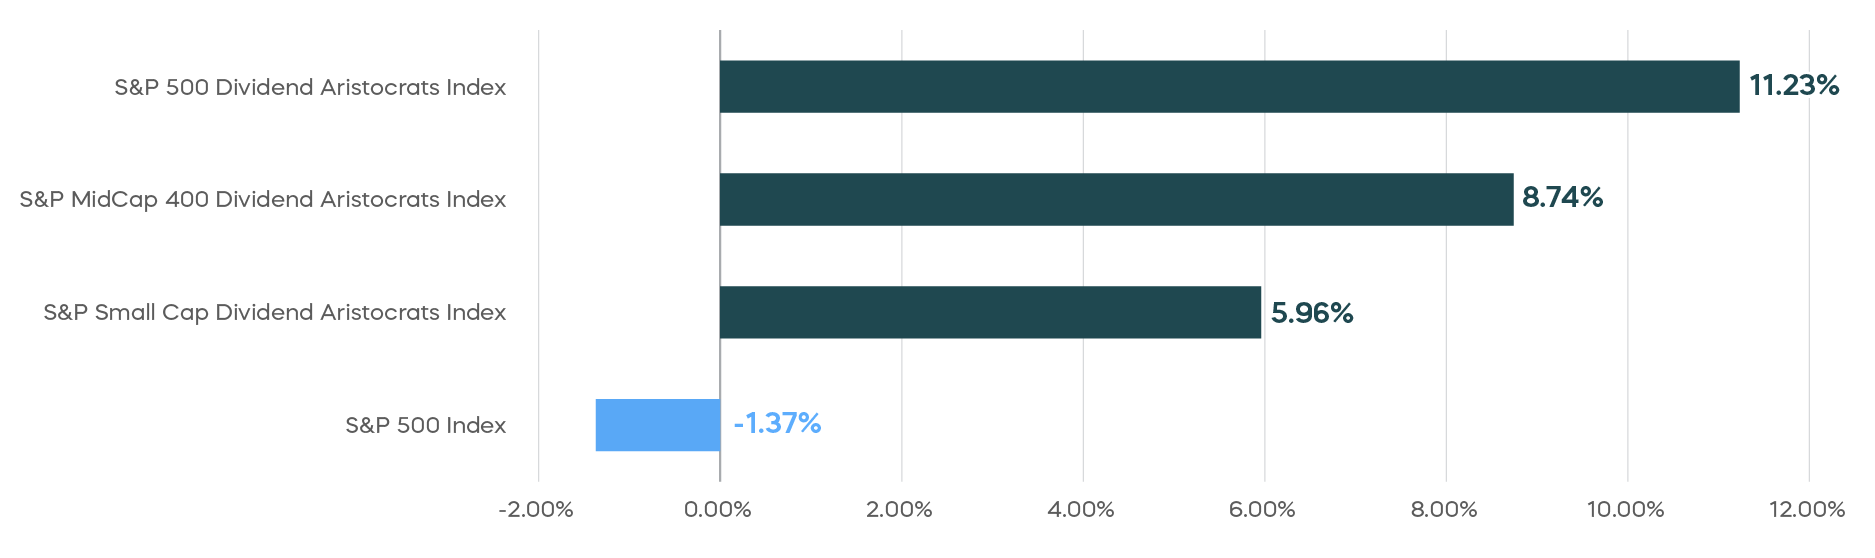
At the end of 2025, the Dividend Aristocrats were expected to deliver 2026 earnings growth of approximately 9%. As of November 3, 2026, expectations are for 2026 earnings growth of over 25%—a positive revision well ahead of the S&P 500. This distinction may become increasingly relevant as investors scrutinize elevated valuations and the substantial capital spending commitments of some of the market's largest companies. October’s performance seems to confirm the trend. As you can see below, Dividend Aristocrats delivered strong returns for October across the cap spectrum, well ahead of the S&P 500.
Dividend Aristocrats Led in October
The bottom line is that corporate earnings remain a powerful support for equities, but elevated expectations leave little room for disappointment. As earnings growth broadens and investors become more selective, companies demonstrating sustainable profitability, disciplined capital allocation, and improving earnings expectations may be increasingly positioned to outperform.
Fixed Income Perspectives
Higher real interest rates and stubborn inflation point to a potential end to the Treasury rally.
If equity markets favor “good gridlock,” shouldn’t it be good for the bond market too? More checks and balances around expansionary fiscal policy should reduce inflation pressures. At the same time, a well-behaved democracy might also cause less drama around ongoing fights over continuing resolutions and the debt ceiling—taking a bit of risk out of “risk-free” government debt. So, if the election results kicked off a substantive stock market rally, why have 10-year Treasury yields barely budged?
A key part of the answer is that the bond rally has already happened. While the stock market struggled in the month leading up to the election, 10-year Treasury yields had already fallen roughly 40 basis points. But this rally may end up being short-lived.
Core CPI and PCE Inflation 2025-2026
|
|
Core CPI |
Core PCE |
|
12/31/25 |
2.6% |
2.9% |
|
12/31/26 |
2.6% |
3.1% |
Source: Bloomberg, data as of 11/4/2026. 2025 figures are actual, 2026 figures are year-end forecasts.
In a midterm election dominated by high gasoline prices and affordability concerns, a largely overlooked message was that inflation—at least core inflation—has been quite stable this year. Higher energy prices have had limited spillover into broader prices. Economic resiliency in the face of higher energy prices has been quite strong, as has much of the economic data. Institute for Supply Management manufacturing and services sentiment indicators are both well past their “neutral” reading of 50. The latest Conference Board Consumer Confidence Index rose 7.5 points to 91.7 in October, while the most recent GDP print meaningfully surpassed expectations. Mix such economic strength with a normalization of real interest rates, however, and the risk that the bond rally could falter becomes clear.
In our September Market Commentary, we discussed how the real interest rate on the 10-year Treasury in a post-quantitative easing era may be 3% to 3.5%, not the 2% level that many assume. But let’s go back to that stable—or rather stubborn—core inflation rate. If we put the two together, the math points to the possibility of a 10-year Treasury rate in the 5.5% to 6% range. The good news is that the economy, and potentially the stock market, may be able to digest these levels reasonably well. After all, inflation with a two-handle paired with strong economic growth looks a lot like the soft landing investors had hoped for coming out of the high-inflation COVID era.
For bond investors, however, the relationship is straightforward: When yields rise, bond prices fall.