Key Observations

What do markets look like when conflict ends?
A ceasefire in the Middle East is the latest twist for investors who have grown increasingly reactive to each new headline. Volatility has surged: prior to the ceasefire, the VIX had roughly doubled this year and averaged 25 in March—about 67% above year-end levels—underscoring just how uncertain the path forward has been.[1]
If the ceasefire leads to a more lasting peace, history offers some guidance on where markets may go—but also a warning. While markets have often rallied following past conflicts, the timing and trajectory of those recoveries are notoriously difficult to predict. To put today’s environment in context, we look at market behavior during and after the First and Second Gulf Wars.
Chart of the Month
S&P 500 Returns During and After Gulf Wars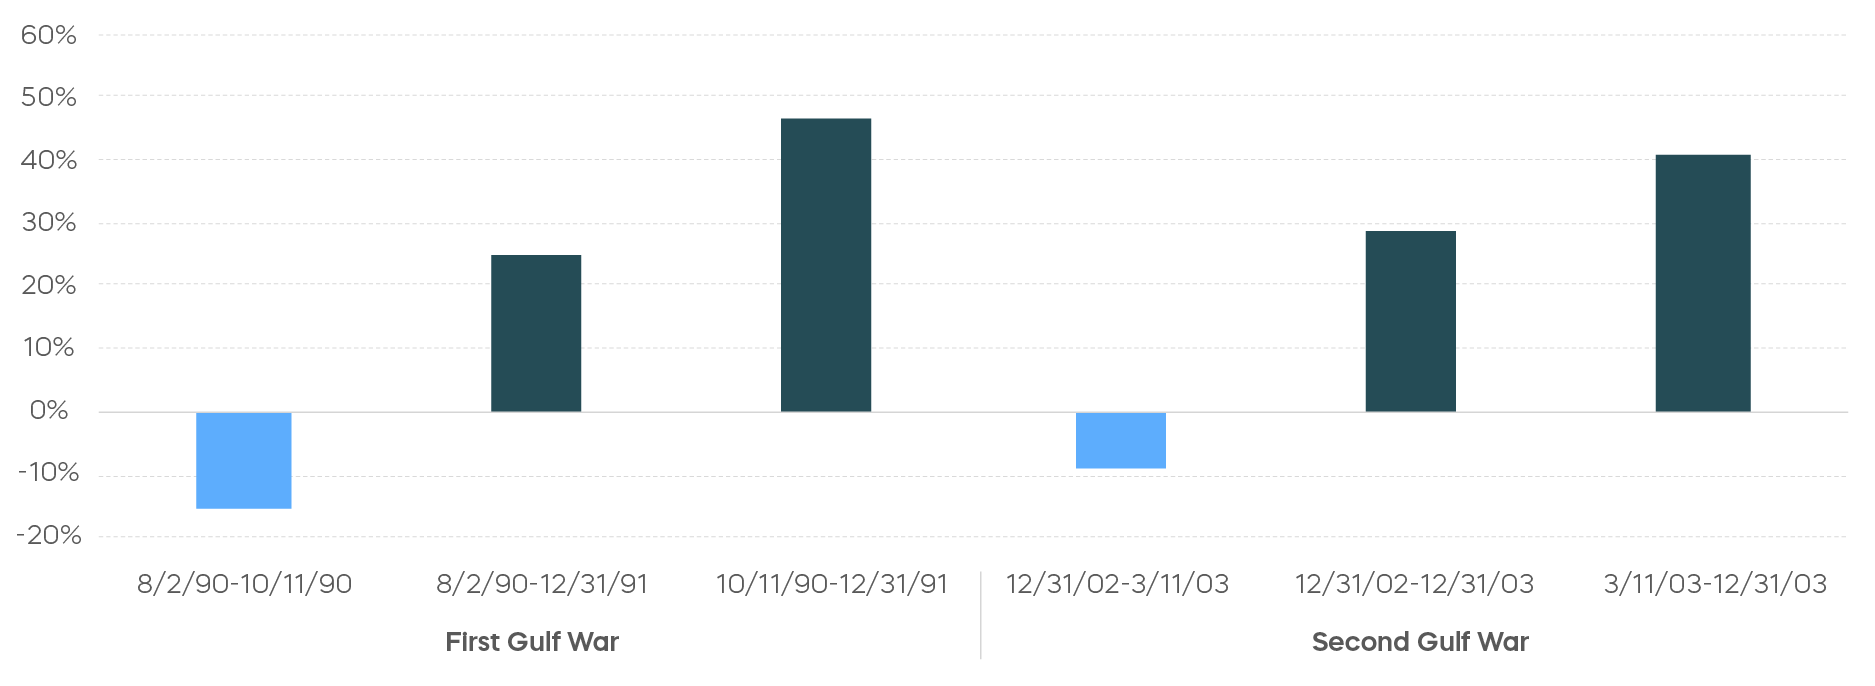
Fundamentals Still Matter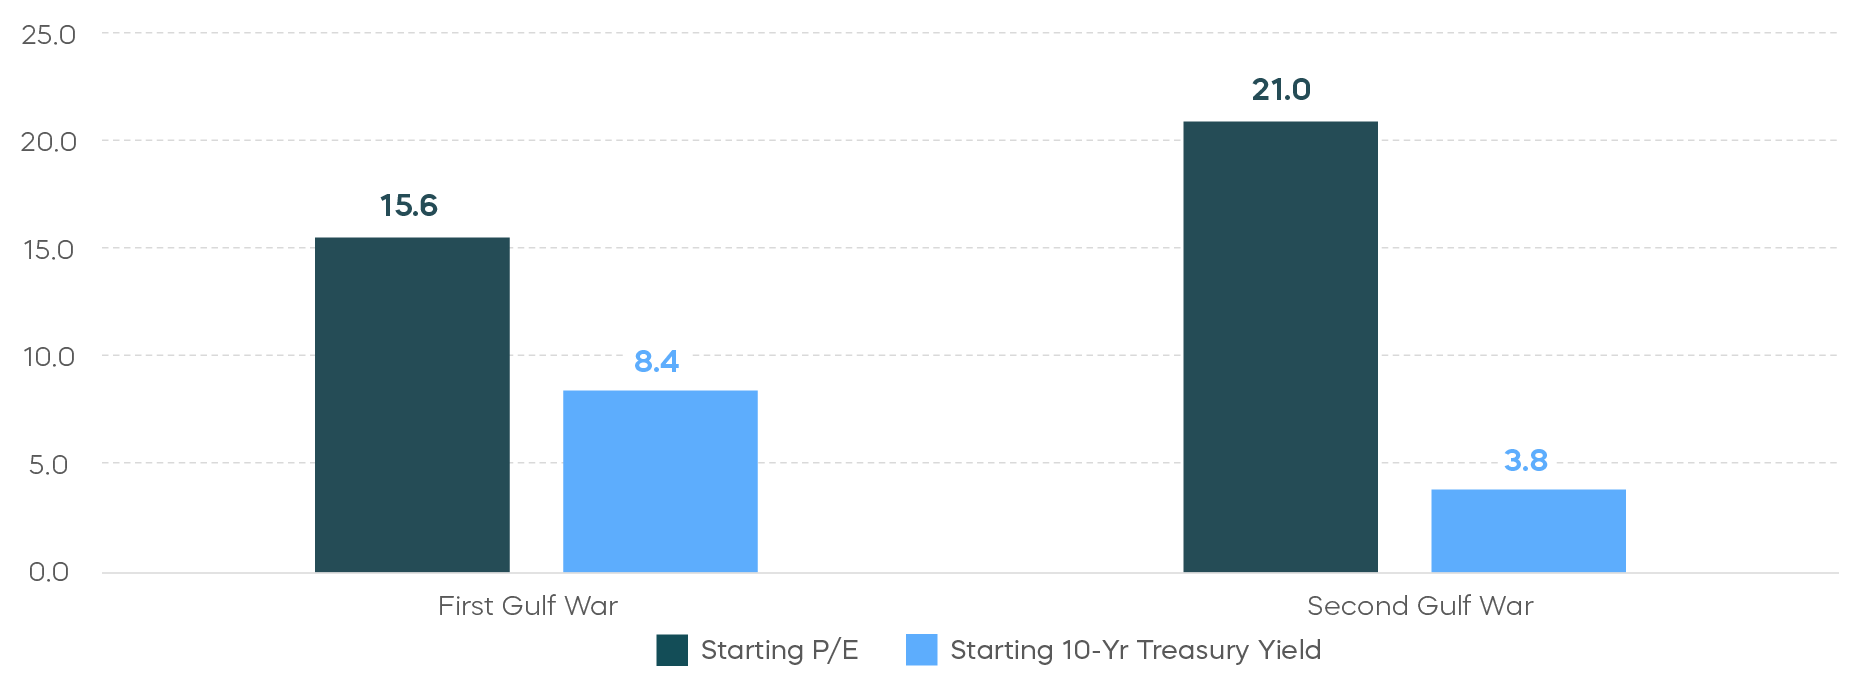
When considering positioning in today’s environment, fundamentals still matter. For example, lower valuations may have supported the rally following the first Gulf War, but interest rates were also significantly higher—suppressing multiples and limiting how attractive those equity valuations truly were.
The second Gulf War looks more like today. At the time, markets were emerging from the tech wreck, so it was reasonable to assume low valuations helped set up a rally there as well. They actually weren't particularly low. Both price-to-earnings (P/E) multiples and interest rates were at similar levels to March’s: 25.6 and 4.3% respectively. [2]
Still, history is only a guide—not a blueprint. Markets were still digging out from a burst tech bubble in 2002, for example. That may not be the case today. And until conflicts subside, there can be little expectation of a return to reliable market direction.
In the current environment, discipline may matter more than precision. Maintaining liquidity for near-term needs and adhering to a defined risk management and asset allocation framework may be more effective than attempting to time turning points.
Asset Class Perspectives
Asset Class Returns—March 2026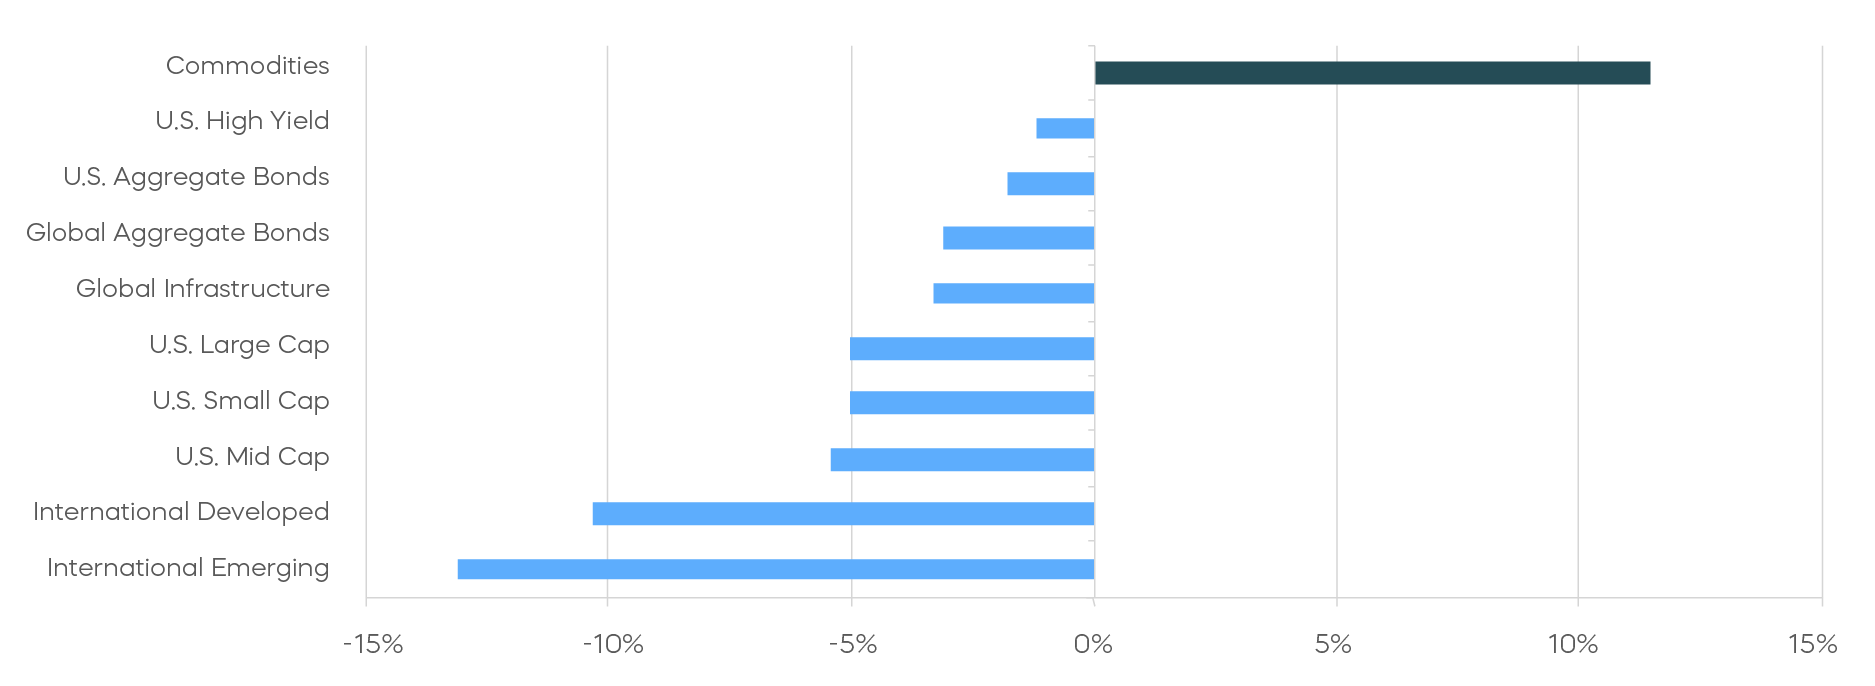
Asset Class Returns—Year-to-Date 2026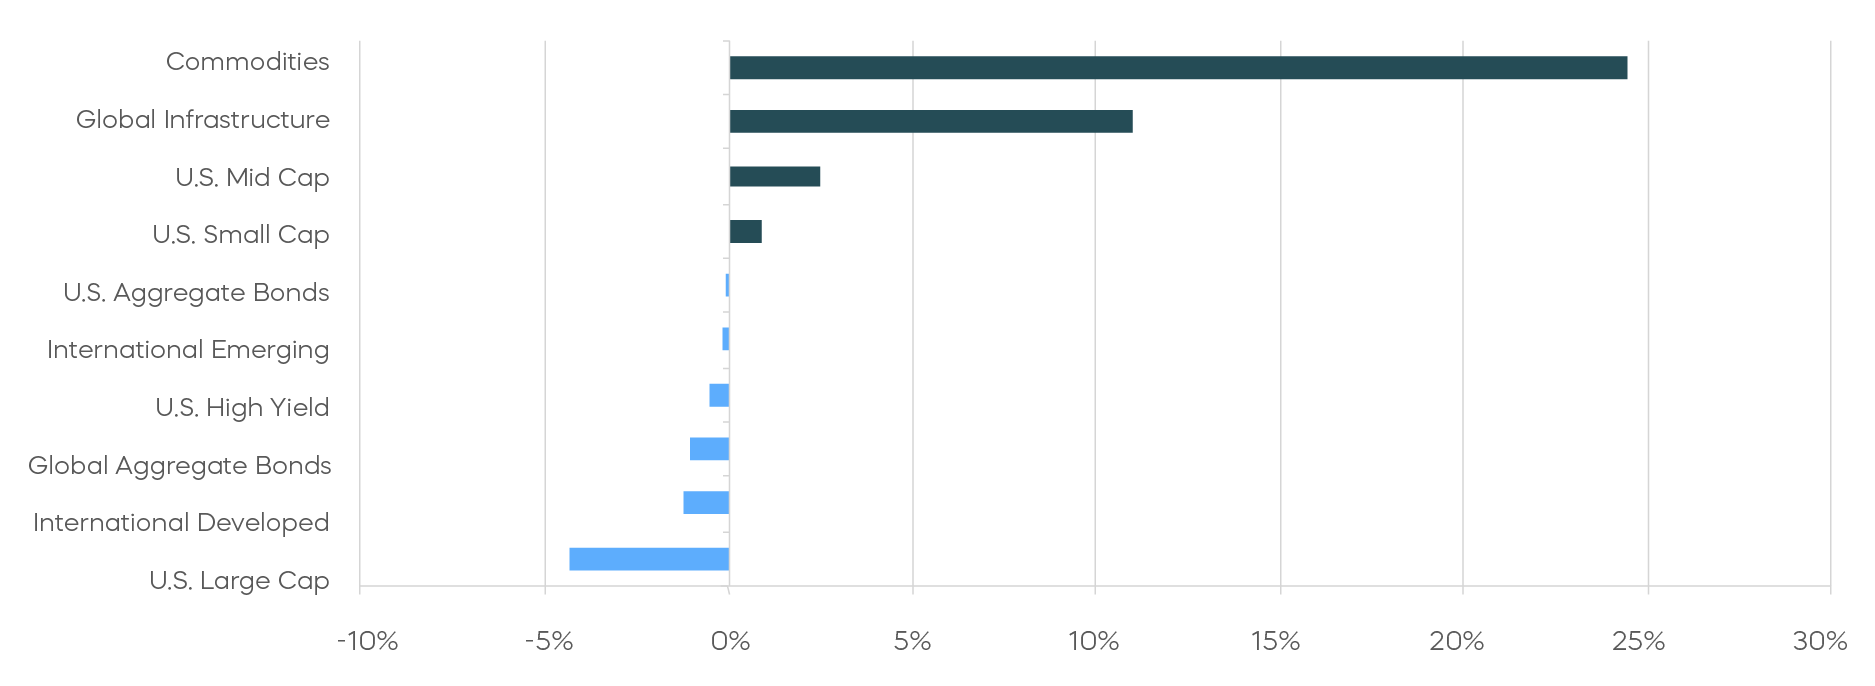
The following are observations on a range of asset classes. For each, green indicates a constructive backdrop, yellow indicates a neutral environment, and red would indicate a challenging backdrop.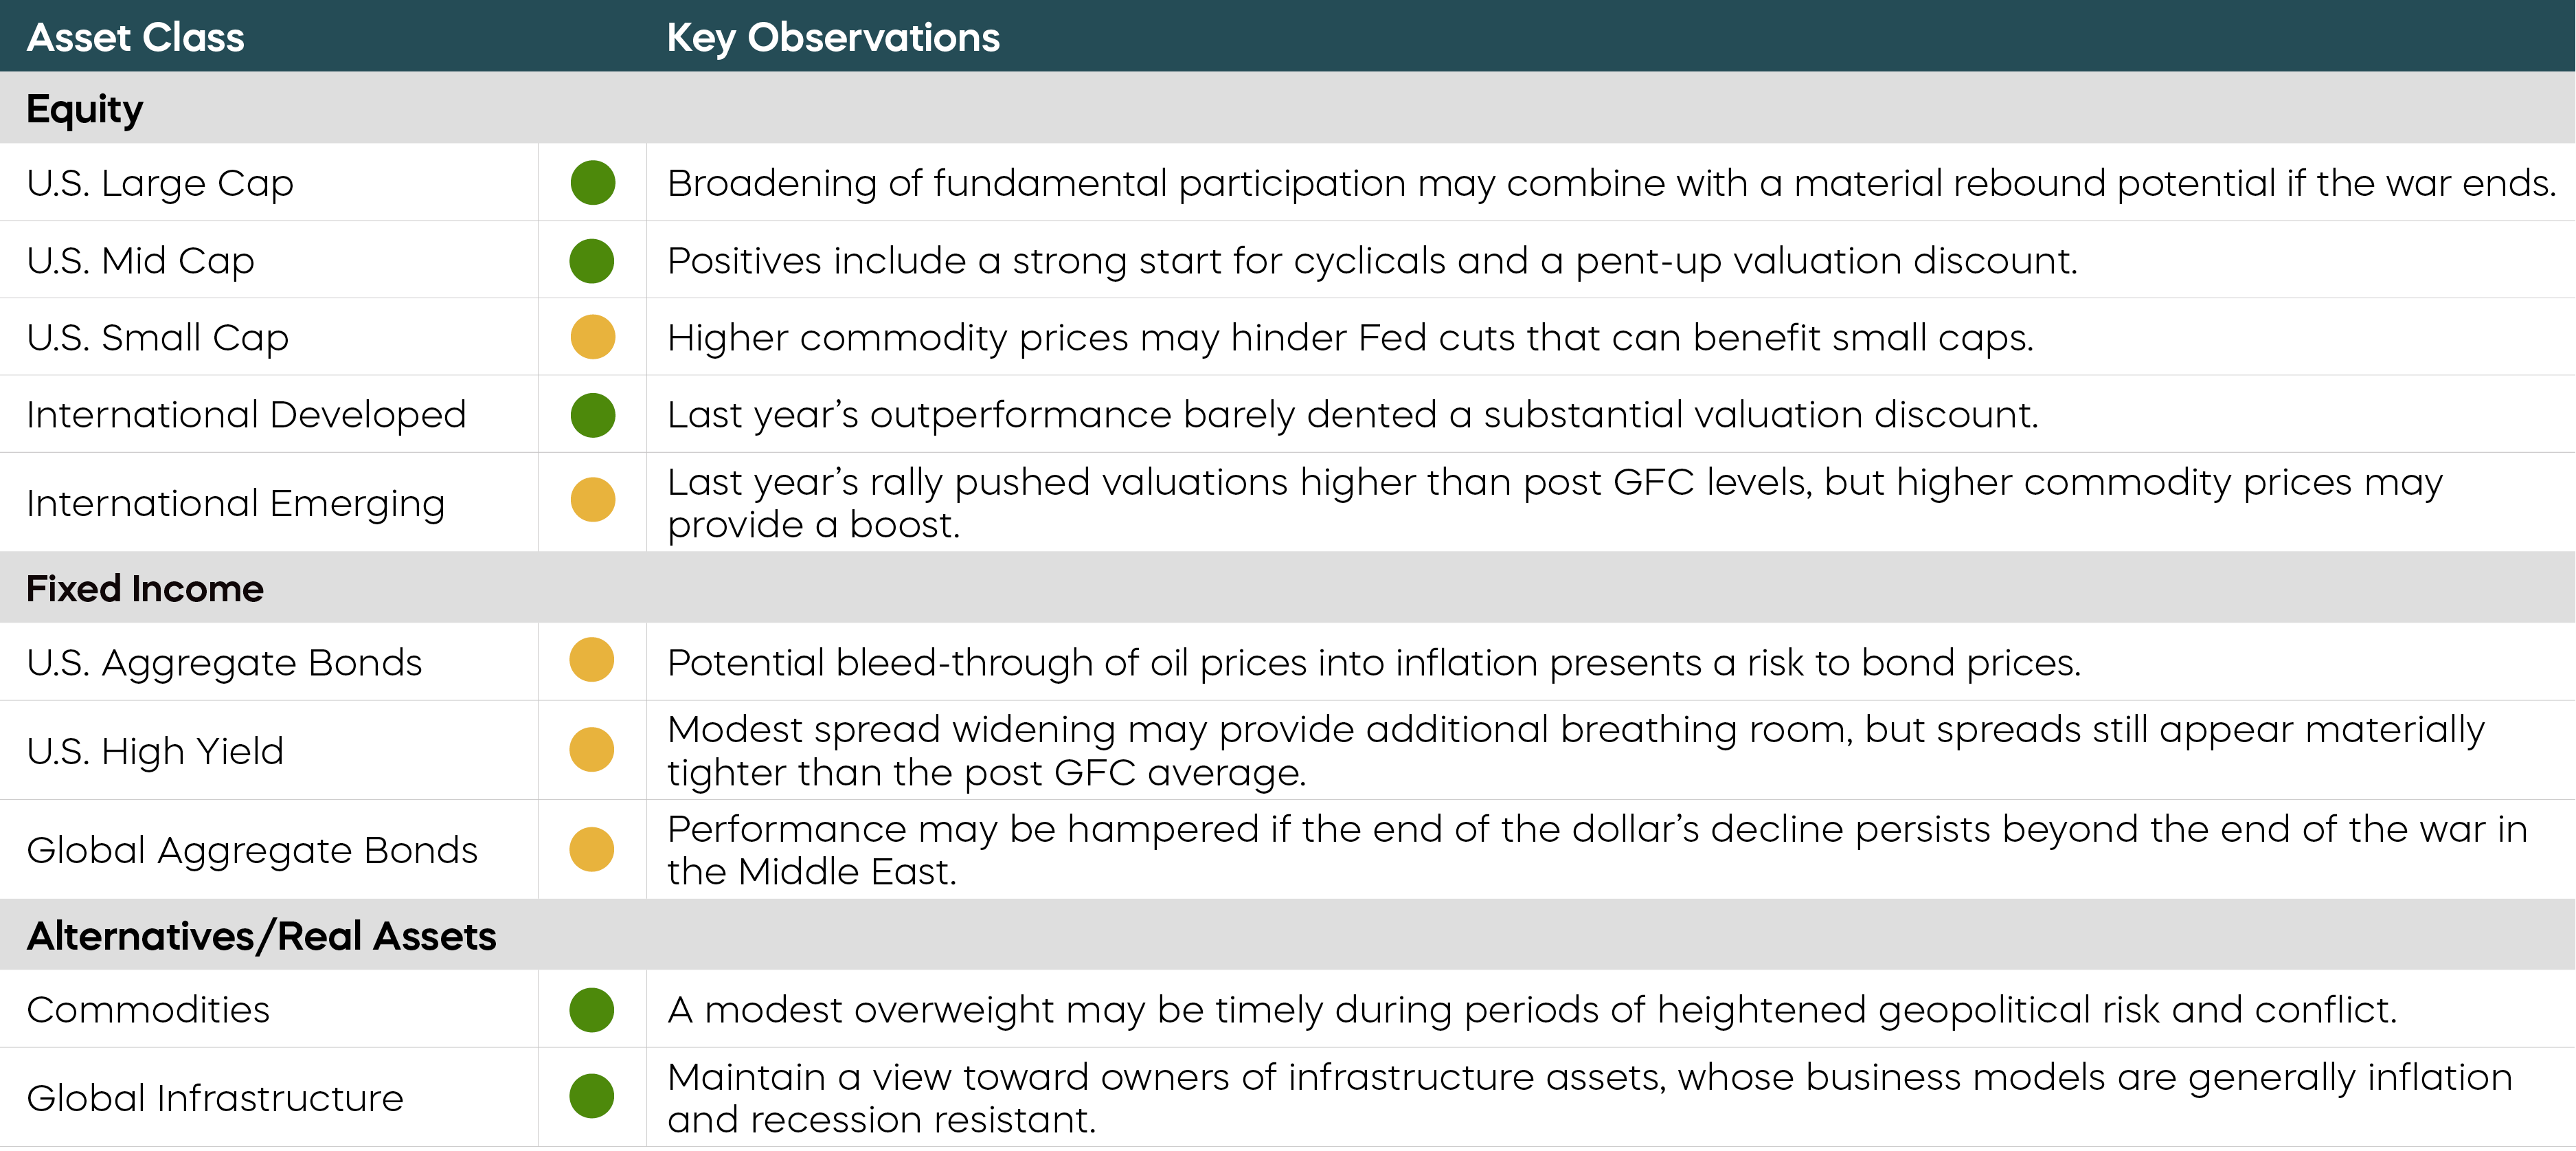
Economic Calendar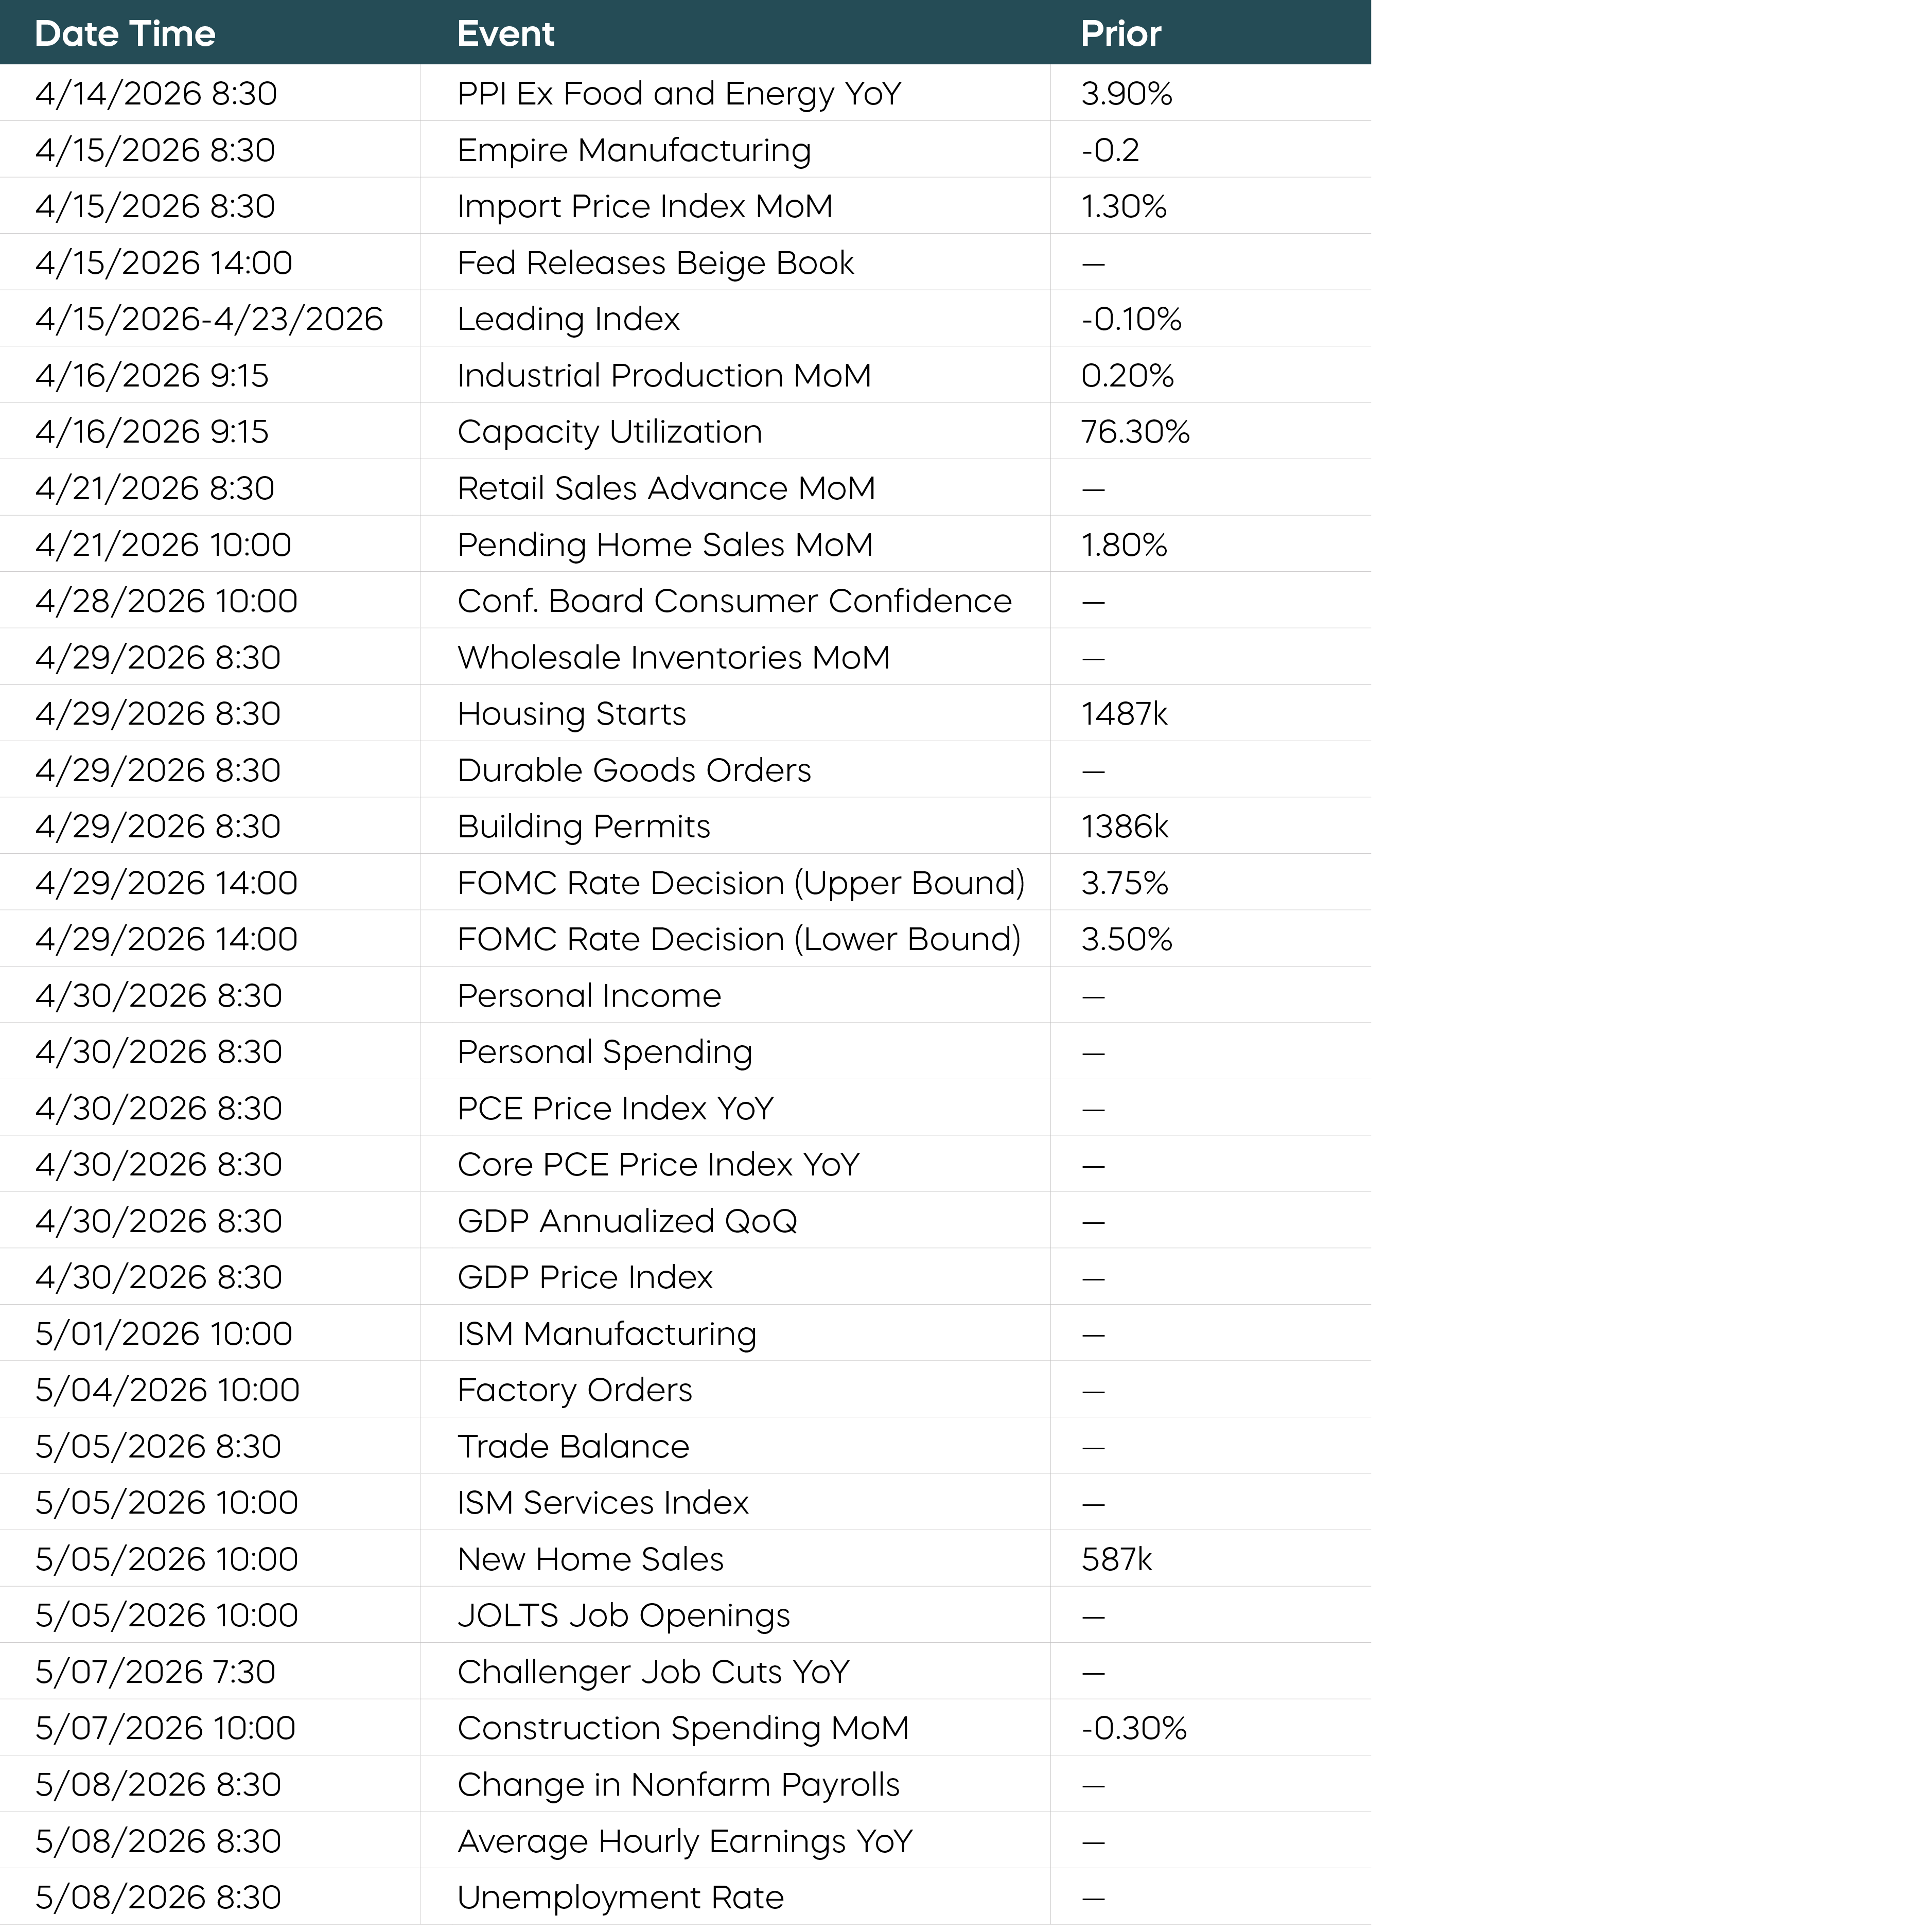
Equity Perspectives

Don’t Be an Accidental Market Timer
The risks of trying to time the stock market are well known, particularly during periods of geopolitical conflict. Yet many investors, despite their best intentions, end up doing exactly that.
Faced with near-term concerns, rather than exiting equities for cash or short-term bonds, investors often look for defensive equity strategies. Their objective, of course, is to avoid at least some near-term drawdown risk while maintaining the ability to participate in a recovery. The challenge is that many so-called defensive strategies don’t deliver.
Case in point: traditional covered call strategies. Many investors view such investments, often represented using the Cboe S&P 500 BuyWrite Index, as an option for defensive equity positioning. Events like last year’s tariff tumult challenge that assumption, however. Beginning with Liberation Day on April 2, 2025, the S&P 500 fell roughly 12%, while the “defensive” traditional monthly covered call strategy declined 10.4%—offering limited downside protection.
The reason these traditional covered call strategies often fail to offer significant defense is a matter of timing. Option premiums, which make up the income portion of covered call strategies, can help offset gradual declines over time, but are less effective during sharp selloffs. And when markets rebound, especially if they do so quickly, these strategies tend to lag because their upside is consistently capped.
By the end of 2025, for example, the BuyWrite Index had captured only about half of the S&P 500’s recovery—an unfavorable trade-off given the limited protection on the downside. The story is similar over the longer term. The Cboe S&P 500 BuyWrite Index has only delivered about 40% of the cumulative return of the S&P 500.
Monthly Covered Call Strategies Have Significantly Underperformed Over Time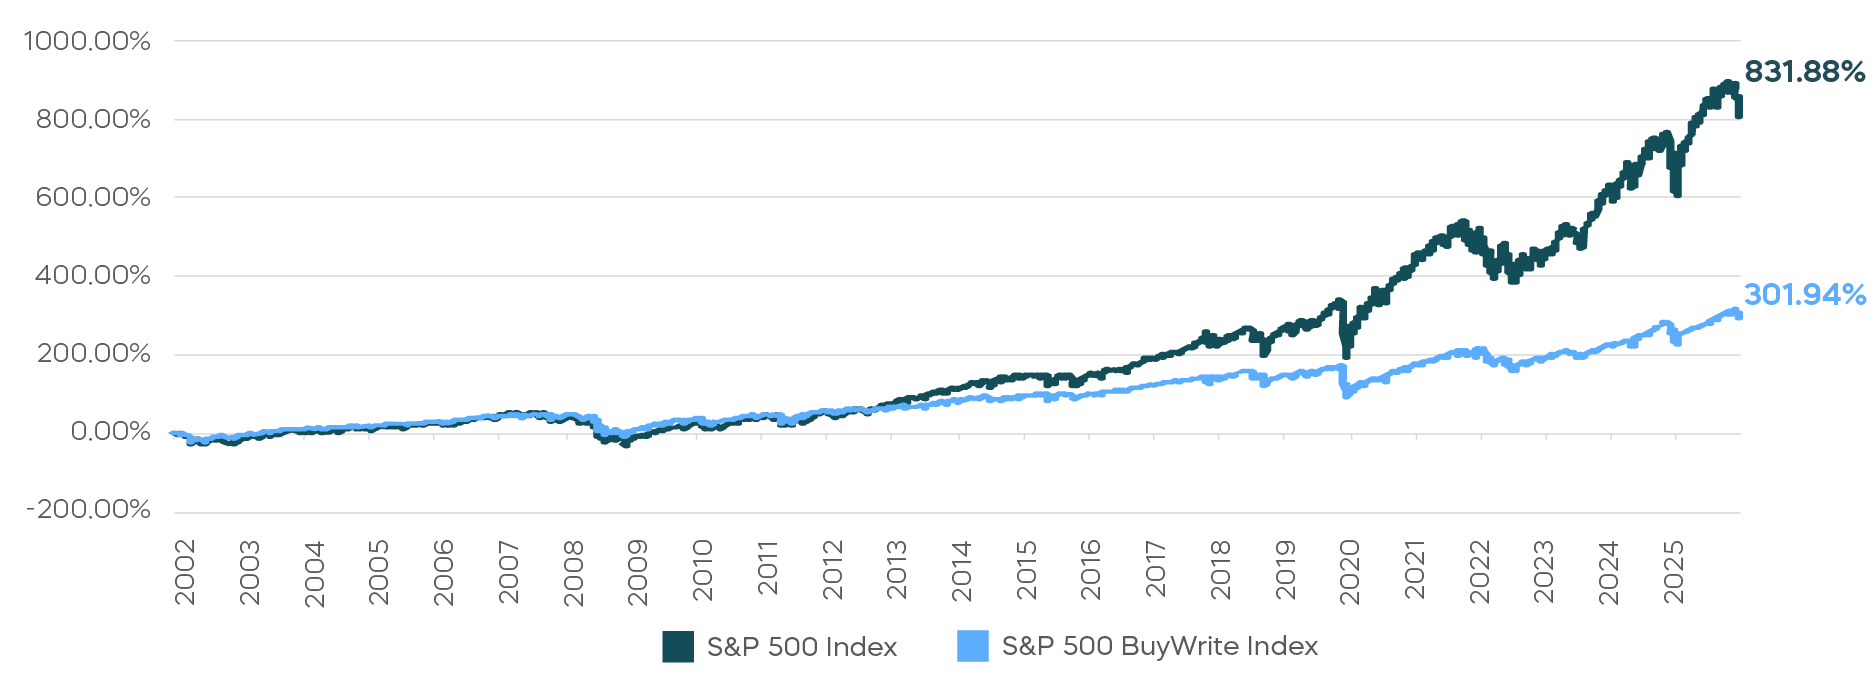
A recent innovation—a daily approach to covered calls—may offer a better alternative. The S&P 500 Daily Covered Call Index, which follows the performance of a daily option strategy on the S&P 500, offers the potential to target both high income and equity market returns over time. That income can provide for near-term needs and help keep investors “in their seats” in tumultuous times, while preserving potential participation during rebounds and avoiding fraught attempts at market timing.
Fixed Income Perspectives

Temporary Energy Relief, Persistent Inflation Risk
With a ceasefire announced on April 7 in the war in the Middle East, bonds rallied in a sign of relief. Even so, front-end yields in the U.S. remain meaningfully higher than before the war began over a month ago. Near-term inflation expectations also remain elevated, with the one-year inflation swap still more than 50 basis points above its February level as of April 8.[3]
If lower oil prices are sustained, the near-term pressure on inflation could ease. Still, markets remain wary of any premature conclusions. Higher oil prices can lift headline inflation directly through increased prices for gasoline and energy-related services. In addition, Fed research suggests that a 10% rise in oil prices can feed into 0.15% of additional core inflation (before accounting for any offset from weaker demand).
While the Fed is generally less concerned with one-time price increases such as an oil shock, it is more vigilant about whether a one-off shock evolves into sustained inflation. The risk is that the economy may currently be more susceptible to higher inflation expectations taking hold than at any point in decades.
Between the Global Financial Crisis in 2008 and the Covid-19 pandemic in 2020, near-term inflation expectations and equity volatility were strongly negatively correlated, as illustrated by the relationship between one-year inflation swaps and the VIX index in the chart below. In that environment, inflation risk was minimal: rising volatility in risk assets was often associated with recessionary signals and declining inflation expectations. However, that relationship flipped when inflation surged in the post-pandemic era. Inflation and volatility became positively correlated, and they have remained so even as inflation has moderated. That shift complicates the Fed’s ability to treat an oil shock as fully transitory. Although the Fed left its year-end 2026 projection of one 25 basis point rate cut unchanged at the March 18 FOMC meeting, markets may be right in assuming that further rate cuts this year would likely require a sustainable reopening of the Strait of Hormuz.
Have We Moved from a Disinflation to Inflationary Regime?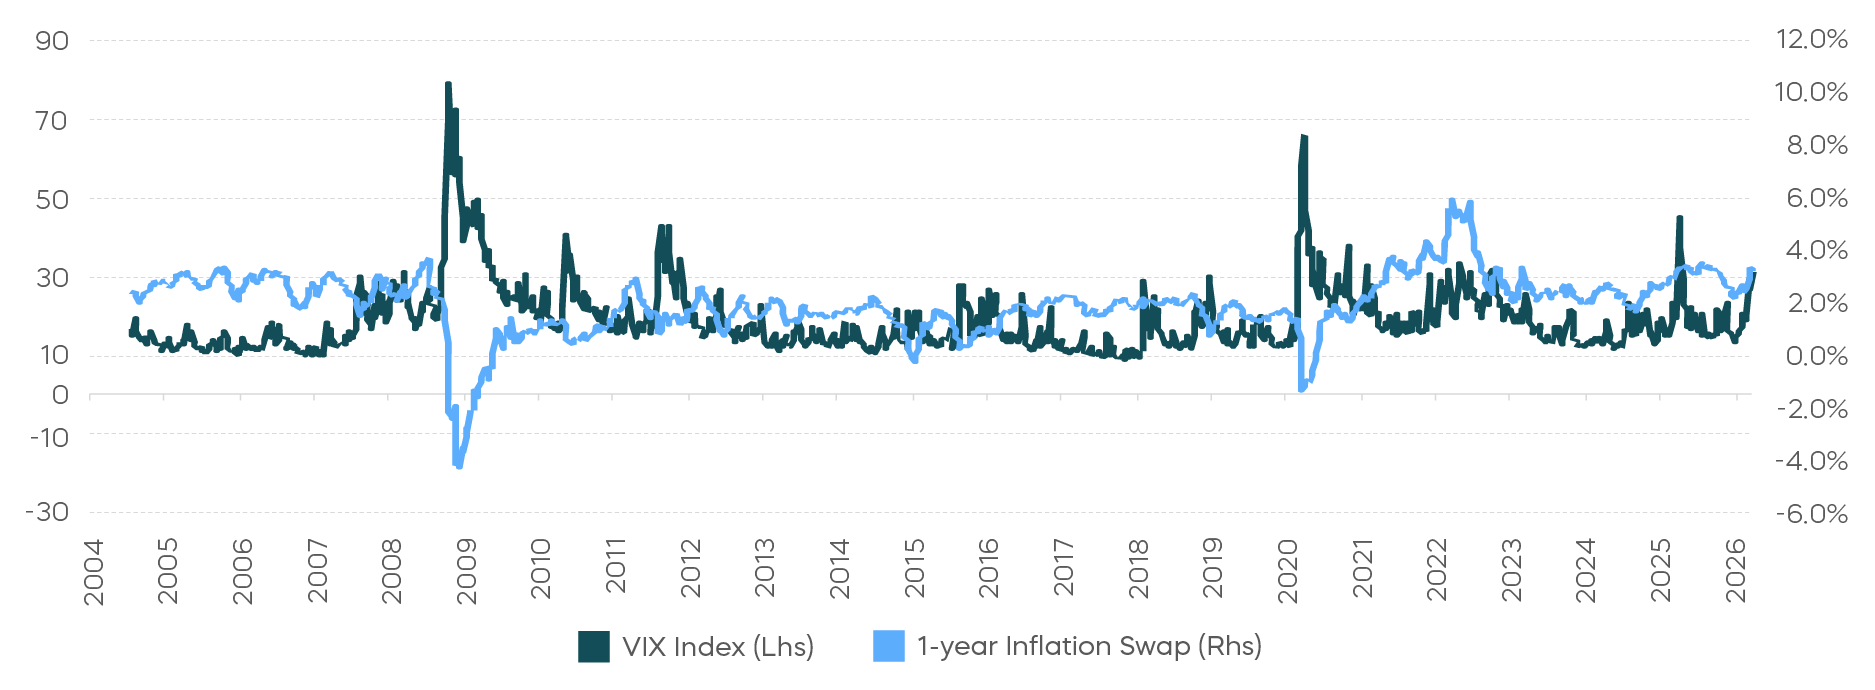
Additionally, an end to the war would not automatically eliminate the inflation risk. Even before the current oil shock, the U.S. economy was already moving toward a scenario of inflationary growth. The rising price of goods in 2025 showed the inflationary effects of tariffs were still working their way through the economy. Importantly though, many firms were able to absorb a majority of those cost increases because labor productivity growth was above its long-term trend for much of the year. While some observers and many CEOs have attributed these gains to AI, we think they more likely reflect residual post-pandemic efficiency gains.
Since World War II, many U.S. recessions have been followed by periods of high productivity growth as firms cut costs and improve efficiency. After the pandemic lockdowns, hours worked fell sharply, mechanically boosting measured productivity in the second quarter of 2020. But as the economy reopened, those productivity gains faded and the labor market quickly returned to very tight conditions.
For that reason, we believe the recent strength in productivity may be less of a structural shift and more low-hanging fruit created by the dynamics of the pandemic era. If that proves to be correct, and demand remains firm, businesses may become more willing to pass higher input costs onto consumers once labor cost savings become less available.
Cumulative Labor Productivity Growth Since Start of Recession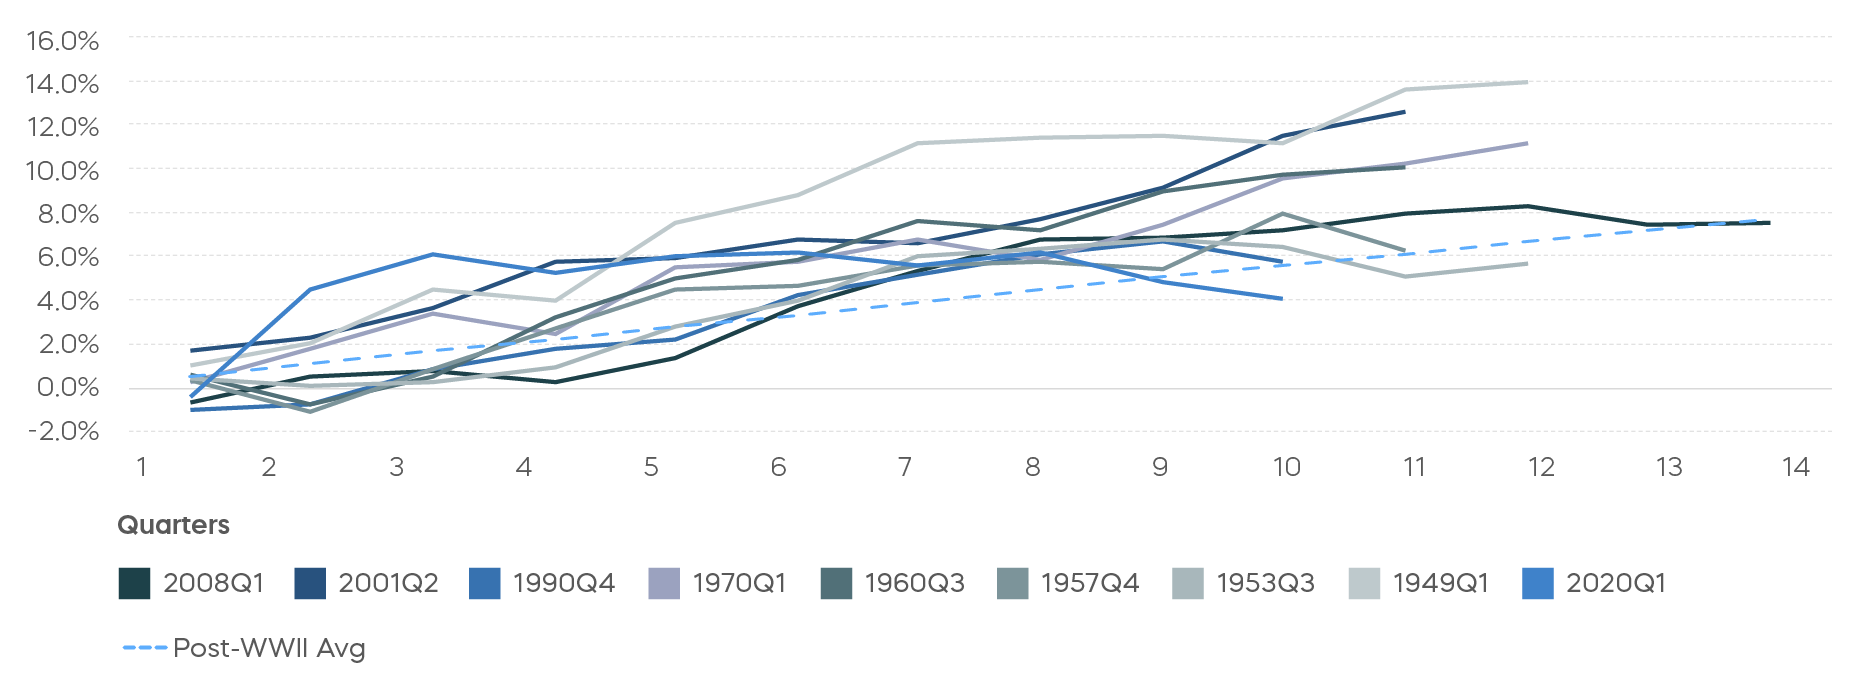
The ceasefire makes the current oil shock easier for the Fed to look through than it appeared just weeks ago. Long-term inflation expectations have also remained relatively stable, giving the Fed room to avoid overreacting to near-term price pressures.
However, the risk of a return to inflationary growth may persist even if the conflict reaches a durable resolution. Against this backdrop, we continue to favor a steepening bias while remaining attentive to further developments.
1. Source: Bloomberg, as of 3/31/26.
2. Source: Bloomberg, as of 3/31/26.
3. Source: Bloomberg, as of 4/8/25.