
Key Observations
-
We believe small- and mid-cap stocks are attractively priced and poised to deliver faster rates of earnings growth.
-
Historically, small caps and mid caps have performed well in periods of rising interest rates.
-
Given an uncertain and volatile equity backdrop, investors may wish to consider a higher-quality approach.
Despite outperforming their large-cap peers over longer time periods, small- and mid-cap stocks have underperformed recently. Given the large-cap dominance over the last several years, many investors are likely under-allocated to smaller capitalization stocks. Market drawdowns, such as we’ve seen this year, can be an opportunity for investors to reconsider and potentially reset or fine-tune their portfolio asset allocations. Below, we outline several key reasons why smaller capitalization stocks might be due for a rebound.
Smaller-Cap Stocks Are in the Bargain Bin
Investors searching for silver linings amidst the wreckage of the current market downturn may have to dig deep. High levels of inflation, tightening monetary policy, and the ongoing war abroad are a potent combination that has left investor sentiment understandably in the dumps. Despite the dour mood, improving valuations are becoming hard to ignore.
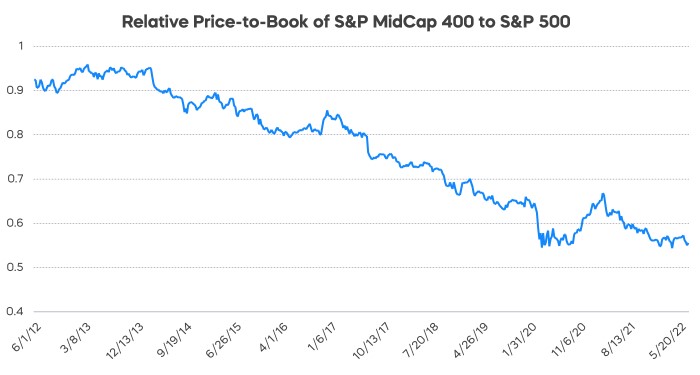
Recent price weakness has left large-cap valuation metrics below their recent three-year averages. But small- and mid-cap stocks offer an even more compelling value. Relative to large caps, price-to-book ratios for smaller stocks are trading at roughly half of large caps.
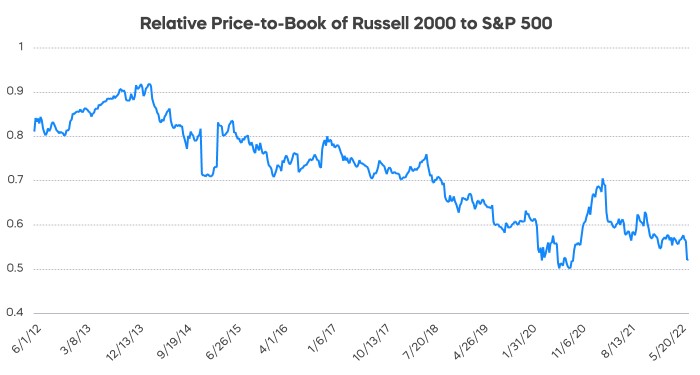
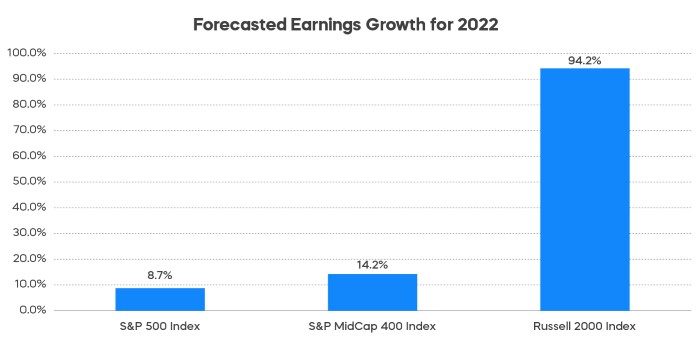
Deciphering exactly when the valuation gap may begin to close is difficult. One potential catalyst could be continued earnings strength. In the first quarter of 2022, both small and mid caps delivered solid earnings and sales growth that exceeded large caps; further, small and mid caps are expected to deliver better full-year numbers.1 Granted, the earnings picture could change if the economy falls into a recession, but we believe first-quarter results were encouraging.
Note that small-cap earnings estimates tend to be more volatile given the thinner analyst coverage, so don’t be surprised if there is variance on either side. Overall growth, however, is still expected to be robust.
Smaller-Cap Stocks Have Historically Performed Well during Rising Rates
A hawkish Fed and a 127 basis points2 increase in 10-year Treasury yields since January have been blamed for recent equity market weakness. Indeed, the long-term relationship between stocks and rates is mixed. But stocks have performed well during prior rising rates periods, especially during more recent periods.
In the past, there’s typically been a perception that companies with smaller market capitalizations are more leveraged than large caps and may face difficulties servicing their debt as rates rise. Performance hasn’t always followed that narrative. Small- and mid-cap stocks have, in fact, outperformed large caps during the vast majority of recent periods when rates moved higher.
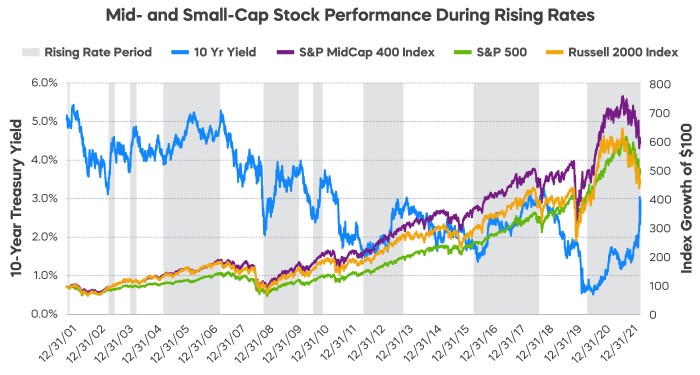
Source: Bloomberg. From 12/31/01 to 6/30/22. Periods of rising rates indicated by shaded bars. Index performance returns do not reflect any management fees, transaction costs or expenses. Indexes are unmanaged, and one cannot invest in an index. Past performance does not guarantee future results.
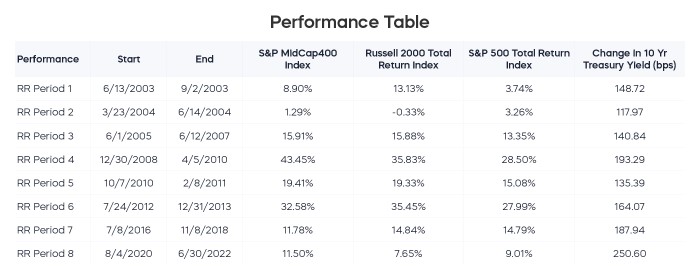
Source: Bloomberg, from 6/13/03 to 6/30/22. Dates represent end-of-day value. Index performance returns do not reflect any management fees, transaction costs or expenses. Indexes are unmanaged, and one cannot invest in an index. Past performance does not guarantee future results.
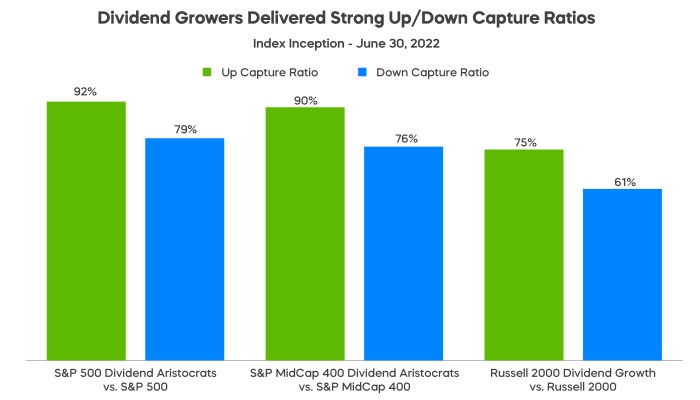
Dividend Growers Have Weathered Market Turbulence Better
When markets are volatile, strategies with a history of weathering market turbulence may be a source of refuge. One formula for outperformance has been participating in the upside when markets do well, and defending the downside when markets are weak. Companies that have continuously grown their dividends over time are typically seen as high-quality with stable earnings, solid fundamentals, and strong histories of profit and growth. Often only thought of as large cap household names, dividend growers are also found among small- and mid-cap stocks. The S&P MidCap 400 Dividend Aristocrats Index, a group of mid-cap stocks that have grown dividends for at least 15 consecutive years, and the Russell 2000 Dividend Growth Index, a group of small-cap stocks that have grown dividends for at least 10 consecutive years, have delivered impressive upside/downside capture ratios since inception.
The Takeaway
High-quality small- and mid- cap dividend growth strategies are potentially well positioned to weather today’s market turbulence. Investors may want to consider these strategies based on their combination of attractive valuations, strong expected earnings growth, and a recent history of performing well during rising rate environments.
Learn More
Learn More
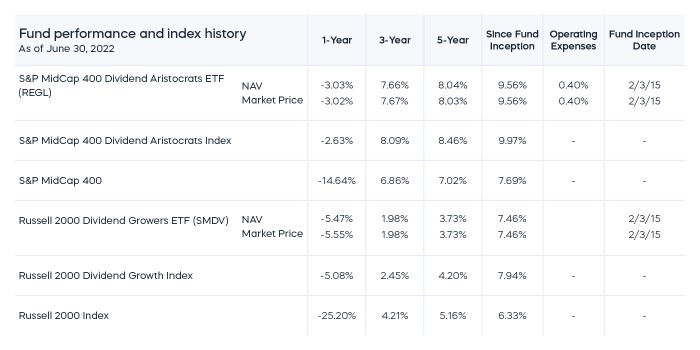
REGL
S&P MidCap 400 Dividend Aristocrats ETF
Seeks investment results, before fees and expenses, that track the performance of the S&P MidCap 400® Dividend Aristocrats® Index.
SMDV
Russell 2000 Dividend Growers ETF
Seeks investment results, before fees and expenses, that track the performance of the Russell 2000® Dividend Growth Index.