A Mid-Year Outlook: Reviewing Inflation and the Odds for a Recession
Key Observations

As we write this outlook, there are signs that inflation may have peaked. Oil prices have retreated, and measures of inflation expectations have declined. That’s the good news. The bad news? A key indicator of moderating inflation is a growing expectation that global economic conditions will weaken, and the odds seem to show the chance of a recession on the rise. In this mid-year outlook we will address key questions, including:
1. What are the signs of moderating inflation?
2. What have stocks already priced in?
3. What areas of the stock market may be best positioned?
4. Why could credit risk be more attractive than interest rate risk?
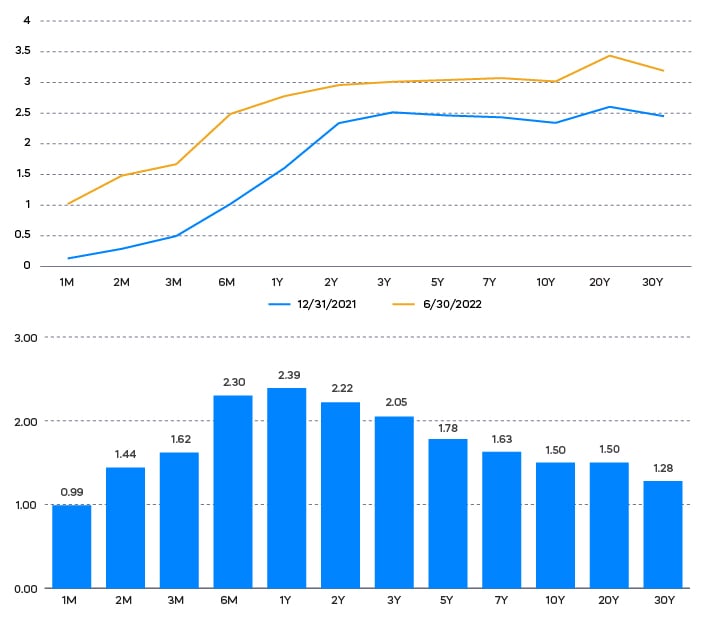
There’s little debate that much of the dramatic rise in oil prices has been driven by Russia’s invasion of Ukraine. But high prices do reduce demand, and oil prices have retreated roughly 20% from their peak. Still, oil prices are volatile—you may be reading this after a rebound in oil prices, or they may have fallen further. A broader and more robust indicator that inflation may be moderating is the breakeven inflation rate. Breakeven inflation, which is the difference between the yield of regular U.S. Treasurys and TIPS, has been falling for months.
Chart of the Month
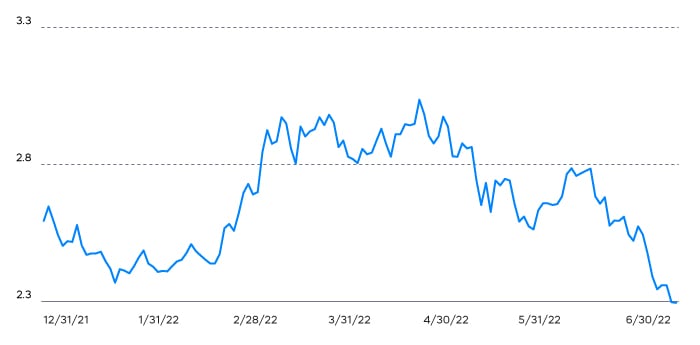
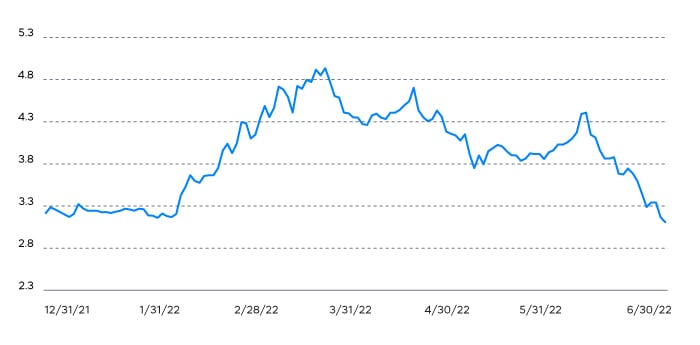
It is noteworthy that both the 10-year and the 2-year breakeven rates have retreated—indicating diminished expectations of the dreaded long-term wage-price spiral and that relief is expected, even in the nearer term. Breakeven rates are actually getting quite close to the Fed’s target of 2% inflation.
Falling inflation expectations are driven in part by increasing expectations for an economic slowdown. Bloomberg reports the probability of recession at 33% (as of 7/6/22). There is little doubt that the rebound in economic growth is slowing and will likely continue to slow. The hope is for a soft landing. The duration and eventual resolution of the war in Ukraine and China’s reopening will be key factors. However, the S&P 500 has already fallen more than 20% so far this year, so it’s worth asking the question: What degree of economic slowdown is priced in?
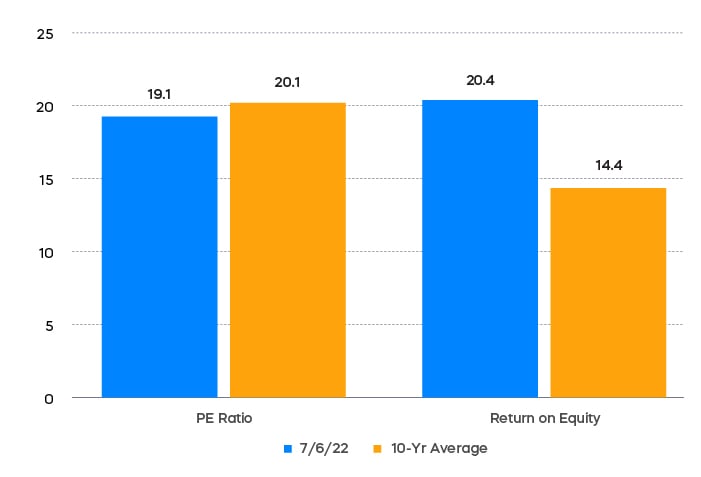
One way to see that the S&P 500 may be priced for degradation in company performance is to look at the disconnect between current price-to-earnings (P/E) ratios and return on equity (ROE). While the S&P 500 is only trading at a slight discount to its 10-year average P/E, ROE is nearly 50% higher than the 10-year average. Higher ROE means that companies can convert more of their earnings to cash flows and dividends. Today’s valuation level clearly reflects lower performance expectations.
How much degradation is priced in? The S&P 500 is trading at 16.7x 2022 consensus earnings estimates. If that reflects skepticism around consensus estimates instead of anticipated shrinkage of P/E multiples, then a plausible conclusion is that stocks are priced to miss
estimates by 10—15%. For those looking for a tag line: we believe stocks are priced for challenges, not catastrophe.
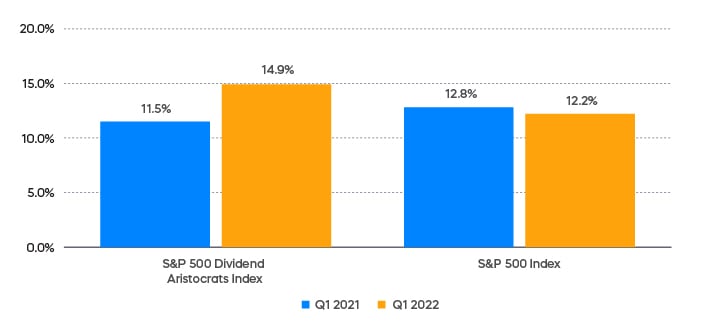
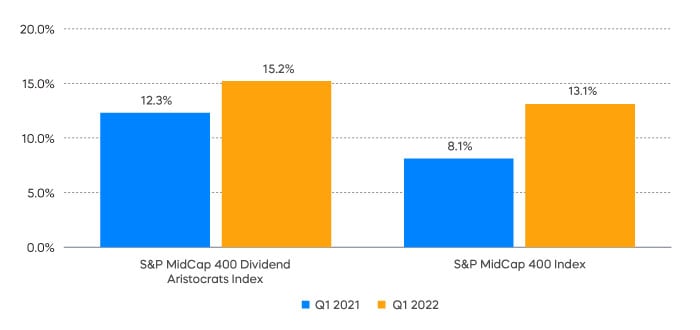
Concern for shrinking profit margins is another likely driver of market pessimism. Inflation may help drive top-line sales growth, but if rising costs cannot be passed on to customers, margins suffer. A look at the S&P 500’s first-quarter earnings season offers some clues regarding companies that may be more likely to maintain profit margins.
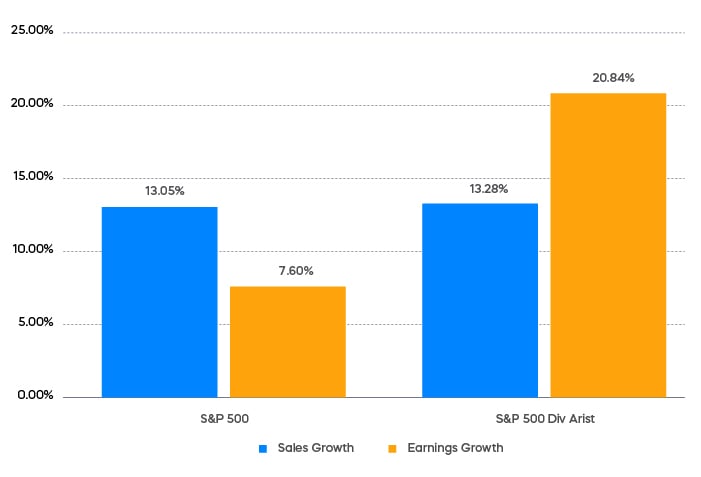
The S&P 500 exhibited margin compression, with earnings growth coming in at only a bit over half the rate of sales growth. In sharp contrast, the S&P 500 Dividend Aristocrats delivered roughly the same level of sales growth but nearly triple the earnings growth of the S&P 500. That demonstrated ability to expand margins in an inflationary period may come in handy—since inflation, though likely to decline, will likely remain somewhat elevated.
It might seem surprising after June’s Treasury rally to suggest that Treasury rates could be heading back up, particularly with an increased risk of recession. It’s all about Quantitative Tightening. The removal of the artificial suppression of longer-term interest rates means that longer-term Treasury rates may be likely to rise, even if the economy weakens. If we look since mid-April, breakeven inflation rates have fallen substantially and the yield on the 10-year Treasury is almost exactly where it started. That means that real yields have risen substantially, which is precisely the intended result of Quantitative Tightening. And with real yields still quite low, longer-term Treasury yields may head higher. Since yields up means price down, it might not be the time to take interest rate (duration) risk. Instead, it could be a better time to take credit risk.
The credit question is much like the stock question: What’s priced in? First, inflation provides a bit of tailwind for corporate credit that is distinct from the impact on stocks. Much like inflation makes a fixed rate mortgage a smaller part of one’s personal budget over time, inflation can make a fixed coupon corporate bond easier for a company to repay. If inflation boosts sales, even if they don’t make it all the way to the bottom line of equity earnings, those sales likely make it easier for a company to repay its fixed debt. That means that inflation can tighten credit spreads: spreads tighter, yields down and prices up.
There’s still that concern of an economic slowdown, however, and in that regard, the credit question is much like the stock question. Are spreads wide enough today to give some cushion if times become challenging?
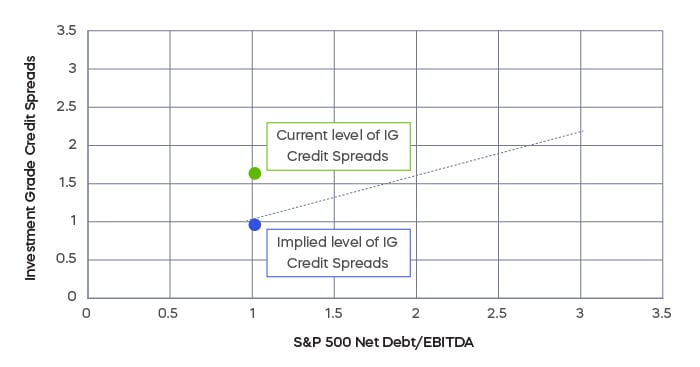
(Since the End of the Financial Crisis)
(Since the End of the Financial Crisis)
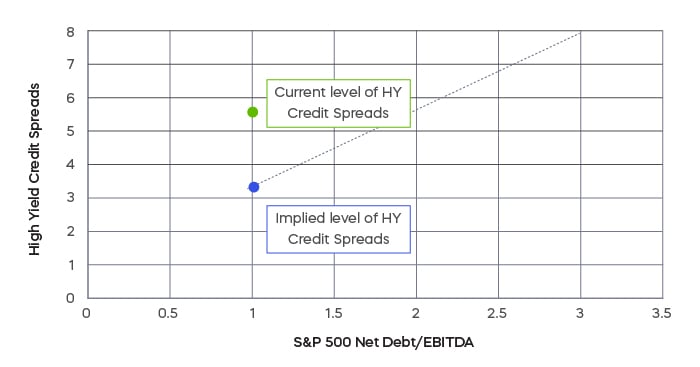
Much like stock prices, credit spreads have widened considerably this year. Leverage, a key element of credit risk, is at quite low levels. Credit spreads are substantially wider than the historical relationship between spreads and leverage would imply. It’s tough to quantify what’s priced in, but it is fair to say that credit, much like stocks, is priced for challenges.
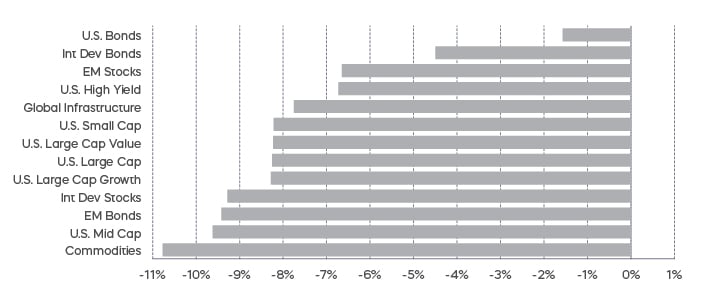
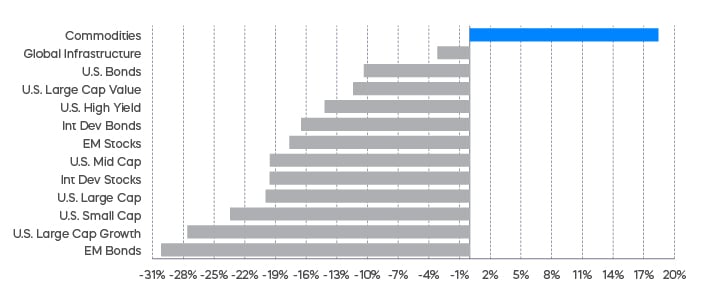
Performance Recap
Even commodities retreated in June, as many investors saw signs pointing to an increased risk of recession.
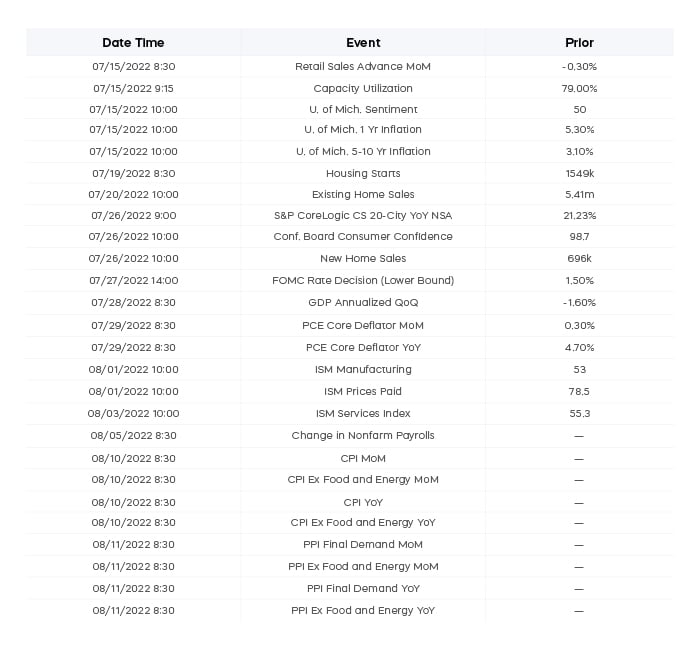
Economic Calendar
Equity Perspectives

In what has been a dismal first half of the year for equity investors, the optimists among us have pointed to fundamentals as one reason for hope. As we entered the year, analysts had been estimating that S&P 500 earnings for 2022 would grow 10% over 2021 levels. Mid and small caps were expected to grow even faster. With all the talk of a growth slowdown and increasing probability of a recession, it would be reasonable to think those numbers must have come down over the past several months. Thus far they have not, and full year estimates have increased slightly during the past several weeks.
As we head into the meat of earnings season, a growing chorus of investment opinion seems to be getting more skeptical by the day. To be sure, more companies have been issuing negative second quarter guidance according to Factset. Of the companies that have issued guidance, those guiding lower have exceeded positive guidance by two-to-one.
Whichever direction it plays out, the second quarter earnings season will likely be a key driver for the market’s direction during the remainder of the year. Reasons for optimism remain. While it’s a small sample size, over 70% of companies that have reported second quarter earnings have exceeded expectations. Much of the bad news may already be priced in. History tells us that markets have done well following two consecutive quarters of poor performance similar in magnitude to what we have seen thus far in 2022.
As always, choose your equity strategies wisely. High-quality dividend growth strategies appear well positioned for the difficult environment and have a history of weathering market turbulence. They tend to have pricing power and have demonstrated an ability to increase margins. Small and mid-cap stocks are trading at compelling valuations relative to large caps, and they have more domestic-based revenue potentially insulated against the effects of ongoing dollar strength. And remember, amidst a backdrop of rising rates, equity styles and sectors matter. You may want to tactically take advantage of sectors likely to perform well if rates continue to rise.
Given their defensive qualities, it is easy to see why dividend strategies have been popular this year. When broad benchmarks like the S&P 500 decline, dividend strategies tend to outperform, as they have done this year through June. It’s imperative, however, to choose carefully between strategies focused on high dividend yield and strategies focused on dividend growth. High dividend yield strategies have generally outperformed dividend growth during the first half of the year. But dividend growth could be better positioned going forward.
High-quality companies that have consistently grown their dividends tend to have stable earnings, solid fundamentals and strong histories of profit and growth. Dividend growers have also produced higher returns on assets, equity and invested capital than high yielders. As a result, they are generally better suited to weather potentially slowing growth. By contrast, high dividend yield stocks tend to be of lower quality with less flexibility in periods of stress. They often carry more debt and devote more cash flow to paying dividends. Net debt to EBITDA is 50% greater than for dividend growers, and interest coverage—defined as EBIT to interest expense, or how much earnings a company produces to service debt—is 2.5x greater for dividend growers than high dividend yielders.
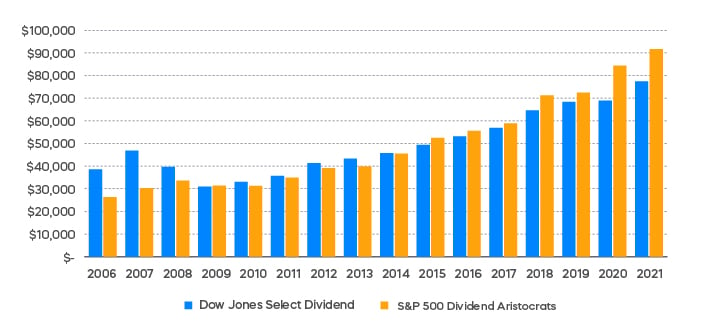
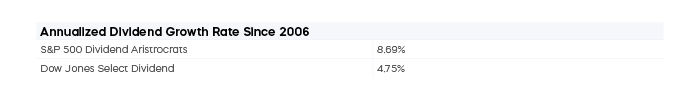
And don’t be fooled by the yield. Reaching for the highest level of yield is rarely the answer, and almost certainly not now. When lower-quality, higher-yielding companies face difficult business decisions, dividends are often among the first casualties. Durability and the growth of the dividend over time determines income payouts in future years. The chart below illustrates this point. Despite having a lower initial yield in 2006 compared to high dividend yield (2.5% vs. 4.0%), the S&P 500 Dividend Aristocrats have produced higher and more sustainable income levels over time.
(Growth of Dividends on a $1M Investment Over Time)
Fixed Income Perspectives
Bond investors have struggled during the first half of the year against a backdrop characterized by rising interest rates and widening credit spreads. Almost every point on the Treasury yield curve rose more than 100 basis points (bps), drastically impacting the performance of longer-duration bonds.
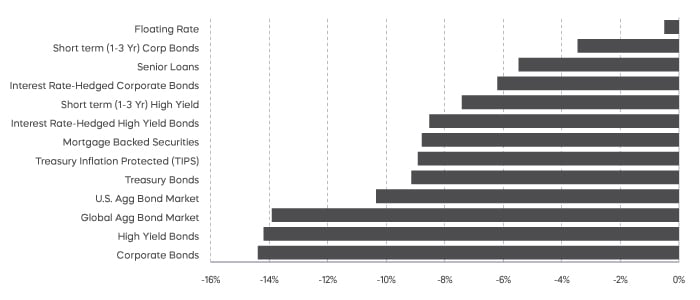
Corporate bonds, which remain one of the most interest rate sensitive segments of the bond market, were one of the worst performing, with the Bloomberg U.S. Corporate Bond Index down 14.4%. The broader U.S. bond market didn’t perform much better and was down 10.3%, as tracked by the Bloomberg U.S. Aggregate Bond Index.
Fixed Income Returns—Year to Date
Minutes from the latest Fed meeting indicate a preference for taming inflation at the risk of stifling economic growth. Since interest rates are the Fed’s primary tool to stifle rising prices, the outlook for longer-duration bonds looks grim. However, with respect to different segments of the bond market, could recessionary risks increased by contractionary monetary policy put Treasury bonds back in favor over the next one or two years?
Safe haven assets, like Treasury bonds, have not provided much of their desired effect so far in 2022, and a continuously hawkish Fed isn’t likely to alter that trend in the near term. While we are not implying that recessionary risks should be ignored, there is a chance that they could already be priced into the cost of credit.
Investment-grade credit spreads rose 63 bps during the first half of the year, while high-yield spreads rose a whopping 286 bps. Current levels of corporate leverage, as measured by net debt/EBITDA, indicates that it would take approximately one year on average for S&P 500 companies to repay their debt (all things held equal). Relative to history, this indicates that companies may be well positioned to pay off their debt, even if they don’t see an increase in earnings.
S&P 500 Net Debt/EBITDA
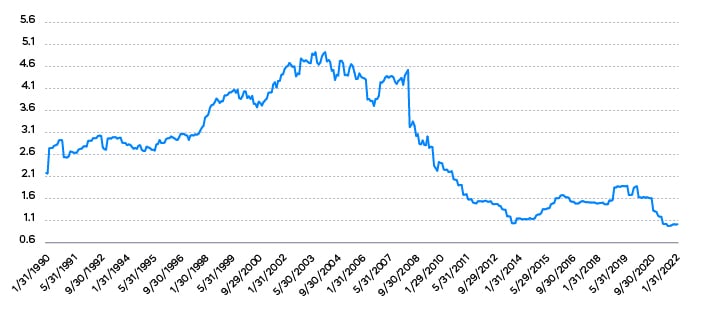
Source: Bloomberg, 12/31/89–6/30/22. Performance quoted represents past performance and does not guarantee future results. Indexes are unmanaged, and one cannot invest directly in an index.
While the broad U.S. corporate bond market has extended duration risk, shorter duration corporate bonds or interest rate hedged strategies may be well positioned to take advantage of a normalization of credit spreads, relative to the current state of corporate balance sheets.
Sources for data and statistics: Bloomberg, FactSet, Morningstar, and ProShares.
The different market segments represented in the performance recap charts use the following indexes: U.S. Large Cap: S&P 500 TR; U.S. Large Cap Growth: S&P 500 Growth TR; U.S. Large Cap Value: S&P 500 Value TR; U.S. Mid Cap: S&P Mid Cap TR; U.S. Small Cap: Russell 2000 TR; International Developed Stocks: MSCI Daily TR NET EAFE; Emerging Markets Stocks: MSCI Daily TR Net Emerging Markets; Global Infrastructure: Dow Jones Brookfield Global Infrastructure Composite; Commodities: Bloomberg Commodity TR; U.S. Bonds: Bloomberg U.S. Aggregate; U.S. High Yield: Bloomberg Corporate High Yield; International Developed Bonds: Bloomberg Global Agg ex-USD; Emerging Market Bonds: DBIQ Emerging Markets USD Liquid Balanced.
The S&P 500 is a benchmark index published by Standard & Poor's (S&P) representing 500 companies with large-cap market capitalizations. The S&P MidCap 400 is a benchmark index published by Standard & Poor's (S&P) representing 400 companies with midrange market capitalizations. The S&P 500 Dividend Aristocrats and S&P MidCap Dividend Aristocrats target companies that are currently members of the S&P 500 and S&P MidCap 400 that have increased dividend payments each year for at least 25 and 15 consecutive years, respectively. The Dow Jones U.S. Select Dividend Index aims to represent the U.S.’s leading stocks by dividend yield.
THESE ENTITIES AND THEIR AFFILIATES MAKE NO WARRANTIES AND BEAR NO LIABILITY WITH RESPECT TO PROSHARES.
This is not intended to be investment advice. Indexes are unmanaged, and one cannot invest directly in an index. Past performance does not guarantee future results.
Any forward-looking statements herein are based on expectations of ProShare Advisors LLC at this time. Whether or not actual results and developments will conform to ProShare Advisors LLC’s expectations and predictions, however, is subject to a number of risks and uncertainties, including general economic, market and business conditions; changes in laws or regulations or other actions made by governmental authorities or regulatory bodies; and other world economic and political developments. ProShare Advisors LLC undertakes no duty to update or revise any forward-looking statements, whether as a result of new information, future events or otherwise.
Investing is currently subject to additional risks and uncertainties related to COVID-19, including general economic, market and business conditions; changes in laws or regulations or other actions made by governmental authorities or regulatory bodies; and world economic and political developments.
Investing involves risk, including the possible loss of principal. This information is not meant to be investment advice.
Investments in smaller companies typically exhibit higher volatility. Small- and mid-cap companies may have limited product lines or resources, may be dependent upon a particular market niche and may have greater fluctuations in price than the stocks of larger companies. Small- and mid-cap companies may lack the financial and personnel resources to handle economic or industry-wide setbacks and, as a result, such setbacks could have a greater effect on small- and mid-cap security prices. Bonds will decrease in value as interest rates rise.
The “S&P 500®", "S&P MidCap 400®", “S&P 500® Dividend Aristocrats Index” and “S&P MidCap 400® Dividend Aristocrats Index” are products of S&P Dow Jones Indices LLC and its affiliates. "S&P®" is a registered trademark of Standard & Poor’s Financial Services LLC (“S&P”), and “Dow Jones®" is a registered trademark of Dow Jones Trademark Holdings LLC (“Dow Jones”) and they have been licensed for use by S&P Dow Jones Indices LLC and its affiliates. All have been licensed for use by ProShares.
ProShares based on these indexes are not sponsored, endorsed, sold or promoted by these entities or their affiliates, and they make no representation regarding the advisability of investing in ProShares. THESE ENTITIES AND THEIR AFFILIATES MAKE NO WARRANTIES AND BEAR NO LIABILITY WITH RESPECT TO PROSHARES.