Stocks and Bonds Rally on Hope for a Soft Landing
KEY OBSERVATIONS
Two straight quarters of shrinking GDP drove a 9% rally in the S&P 500® during the month of July. Let’s call it a soft-landing rally. Many investors are hoping that a bit of economic slowdown will convince the Federal Reserve to reign in the path of rate hikes. Among optimistic indicators was the June payroll report that tallied up an increase of 372,000 non-farm jobs.
The rally in stocks was not just driven by reduced fear of the Fed (and lower interest rates across the yield curve), but also surprisingly decent corporate earnings. With second quarter results for nearly two-thirds of the S&P 500 reported, companies have in aggregate exceeded earnings estimates by over 4%. That’s not a big number, but for a market that was arguably priced for companies to miss expectations, it was enough.
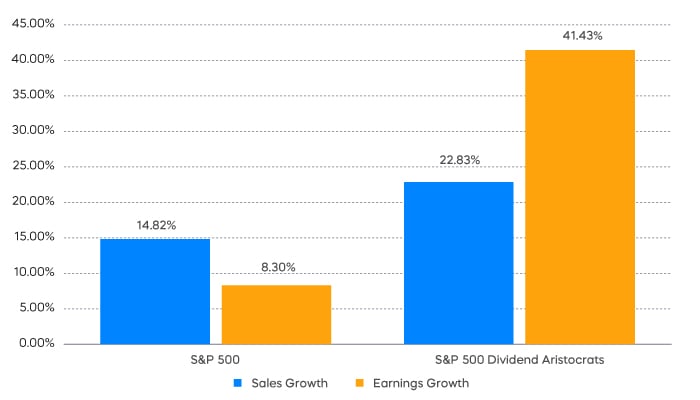
The coast may not be entirely clear for stocks, however. Many companies seem unable to raise prices enough to overcome their rising costs—so far this earnings season, S&P 500 earnings growth has been less than half of sales growth. Not all stocks suffered from margin compression though. Again, with about two-thirds of companies reporting, the S&P 500® Dividend Aristocrats® have delivered both robust sales growth and earnings growth that was nearly double sales growth.
Chart of the Month
The coast may not be entirely clear for bonds either. After several months of declines, the 10-year breakeven inflation rate rose roughly 20 bps in July. Wages rose as well. The Bureau of Labor Statistics Employment Cost Index rose 5.1% in June. While that didn’t keep up with inflation, it’s still a big number. Congratulations to those bond bulls who have gotten the call right since mid-June, but with 10-year U.S. Treasury real yields close to zero again and the pace of Quantitative Tightening accelerating, complacency might not be warranted.
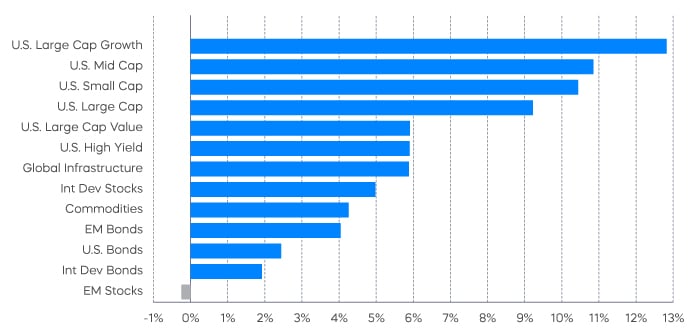
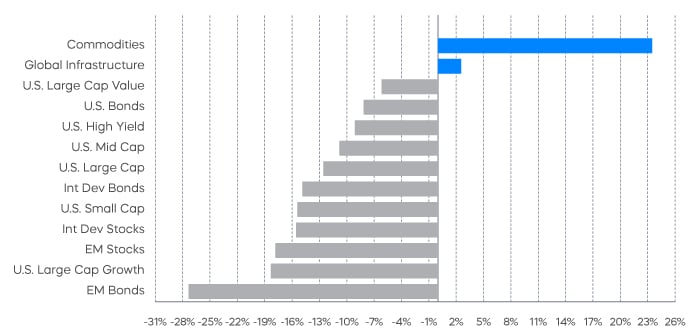
Performance Recap
Economic Calendar
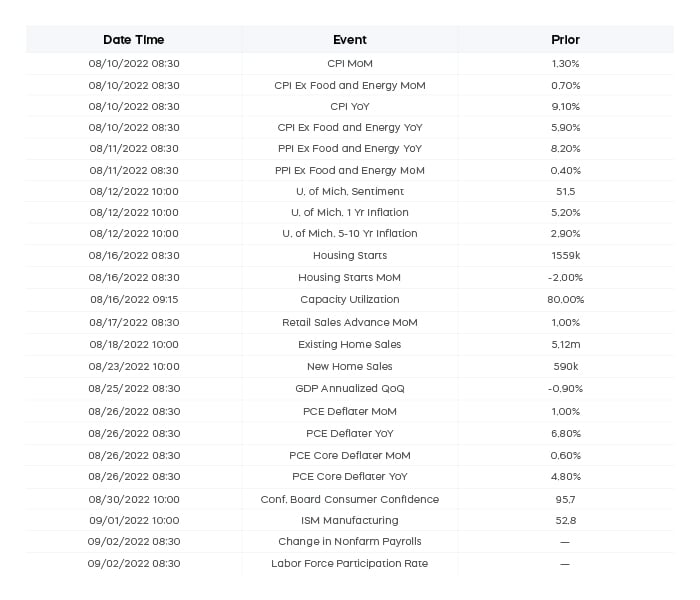
Here’s a list of upcoming key economic releases, which can serve as a guide to potential market indicators.
Equity Perspectives

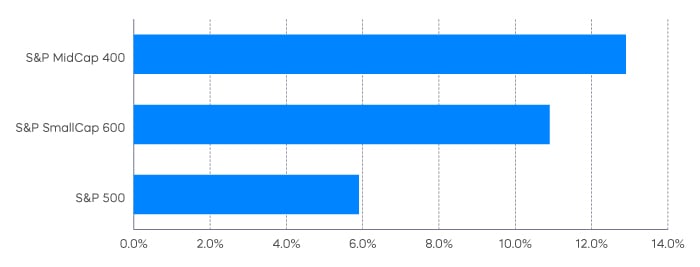
Despite outperforming their large-cap peers over the long-term, mid-cap stocks have been chronic underperformers over the past several years. Given the large cap dominance over the last few years, many investors are likely under-allocated to smaller-capitalization stocks. Market drawdowns like we’ve witnessed this year are never pleasant, but they can be an opportunity to reset portfolio asset allocations.
In addition to stronger earnings growth, there are a few other reasons why mid-cap stocks may be well positioned in the current environment. Relative valuations remain compelling, with the S&P MidCap 400® trading at roughly half of the value of the S&P 500. In addition, more domestic-based revenue should continue to insulate the middle market in the event the U.S. dollar continues to maintain its strength.
Investors should be selective with their mid-cap allocations in what remains a difficult equity environment. One potential solution worth consideration are strategies that have weathered market turbulence in the past, such as investing in dividend growth stocks. Akin to their large-cap peers, the S&P MidCap 400® Dividend Aristocrats® are high-quality stocks that have grown their distributions for a minimum of 15 consecutive years. They have also delivered an attractive combination of upside and downside capture that may be right for the times.
Fixed Income Perspectives
It was green across the screen in July, as a rally in U.S. Treasurys and tightening credit spreads drove prices higher across both government and corporate bond segments.
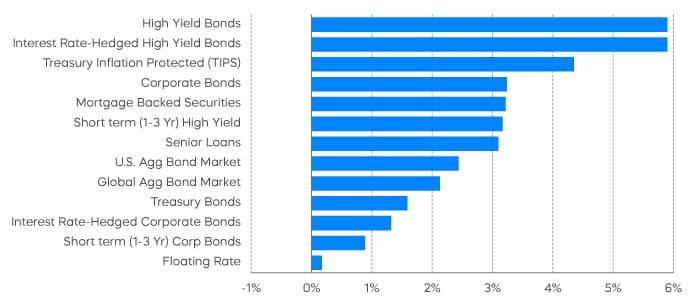
A tightening of credit spreads goes hand-in-hand with a rally in stocks. Generally, if companies are generating decent earnings growth, then they are improving their ability to pay back their debts. Credit spreads for both high-yield and investment-grade credit are in the neighborhoods of their long-term averages, but corporate-debt levels are very low. If decent corporate earnings results continue over the next several quarters, those spreads may narrow even further. The rally in U.S. Treasurys, however, may have gone too far.
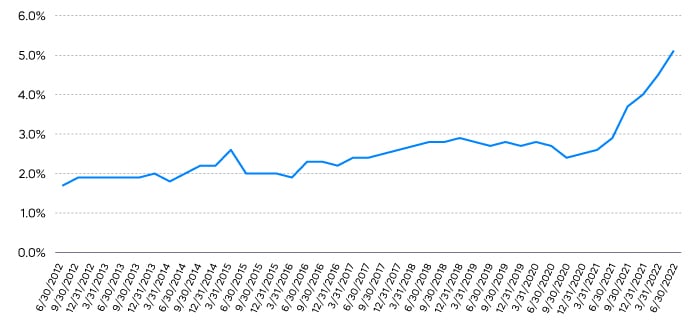
Falling prices at the gas pump is a hopeful sign that inflation may be receding, but rising wages are a potentially bigger concern. Last month’s 5.1% increase in the Bureau of Labor Statistics Employment Cost Index is nearly twice the average of this century. The historical stickiness of wages suggest that it may take a little while for inflation to come back down to the Fed’s target of 2%. It might not take very long at all for U.S. Treasury yields to rise after what has—admittedly—been quite an impressive rally.
Sources for data and statistics: Bloomberg, FactSet, Morningstar, and ProShares.
The different market segments represented in the performance recap charts use the following indexes: U.S. Large Cap: S&P 500 TR; U.S. Large Cap Growth: S&P 500 Growth TR; U.S. Large Cap Value: S&P 500 Value TR; U.S. Mid Cap: S&P Mid Cap TR; U.S. Small Cap: Russell 2000 TR; International Developed Stocks: MSCI Daily TR NET EAFE; Emerging Markets Stocks: MSCI Daily TR Net Emerging Markets; Global Infrastructure: Dow Jones Brookfield Global Infrastructure Composite; Commodities: Bloomberg Commodity TR; U.S. Bonds: Bloomberg U.S. Aggregate; U.S. High Yield: Bloomberg Corporate High Yield; International Developed Bonds: Bloomberg Global Agg ex-USD; Emerging Market Bonds: DBIQ Emerging Markets USD Liquid Balanced.
The S&P 500 is a benchmark index published by Standard & Poor's (S&P) representing 500 companies with large-cap market capitalizations. The S&P MidCap 400 is a benchmark index published by Standard & Poor's (S&P) representing 400 companies with midrange market capitalizations. The S&P 500 Dividend Aristocrats and S&P MidCap Dividend Aristocrats target companies that are currently members of the S&P 500 and S&P MidCap 400 that have increased dividend payments each year for at least 25 and 15 consecutive years, respectively. The Dow Jones U.S. Select Dividend Index aims to represent the U.S.’s leading stocks by dividend yield.
THESE ENTITIES AND THEIR AFFILIATES MAKE NO WARRANTIES AND BEAR NO LIABILITY WITH RESPECT TO PROSHARES.
This is not intended to be investment advice. Indexes are unmanaged, and one cannot invest directly in an index. Past performance does not guarantee future results.
Any forward-looking statements herein are based on expectations of ProShare Advisors LLC at this time. Whether or not actual results and developments will conform to ProShare Advisors LLC’s expectations and predictions, however, is subject to a number of risks and uncertainties, including general economic, market and business conditions; changes in laws or regulations or other actions made by governmental authorities or regulatory bodies; and other world economic and political developments. ProShare Advisors LLC undertakes no duty to update or revise any forward-looking statements, whether as a result of new information, future events or otherwise.
Investing is currently subject to additional risks and uncertainties related to COVID-19, including general economic, market and business conditions; changes in laws or regulations or other actions made by governmental authorities or regulatory bodies; and world economic and political developments.
Investing involves risk, including the possible loss of principal. This information is not meant to be investment advice.
Investments in smaller companies typically exhibit higher volatility. Small- and mid-cap companies may have limited product lines or resources, may be dependent upon a particular market niche and may have greater fluctuations in price than the stocks of larger companies. Small- and mid-cap companies may lack the financial and personnel resources to handle economic or industry-wide setbacks and, as a result, such setbacks could have a greater effect on small- and mid-cap security prices. Bonds will decrease in value as interest rates rise.
The “S&P 500®", "S&P MidCap 400®", “S&P 500® Dividend Aristocrats Index” and “S&P MidCap 400® Dividend Aristocrats Index” are products of S&P Dow Jones Indices LLC and its affiliates. "S&P®" is a registered trademark of Standard & Poor’s Financial Services LLC (“S&P”), and “Dow Jones®" is a registered trademark of Dow Jones Trademark Holdings LLC (“Dow Jones”) and they have been licensed for use by S&P Dow Jones Indices LLC and its affiliates. All have been licensed for use by ProShares.
ProShares based on these indexes are not sponsored, endorsed, sold or promoted by these entities or their affiliates, and they make no representation regarding the advisability of investing in ProShares. THESE ENTITIES AND THEIR AFFILIATES MAKE NO WARRANTIES AND BEAR NO LIABILITY WITH RESPECT TO PROSHARES.
