Three Reasons to Consider Investing in Technology Dividend Aristocrats Now

October 10, 2023

1. Technology May Offer the Best Growth with Highest Margins

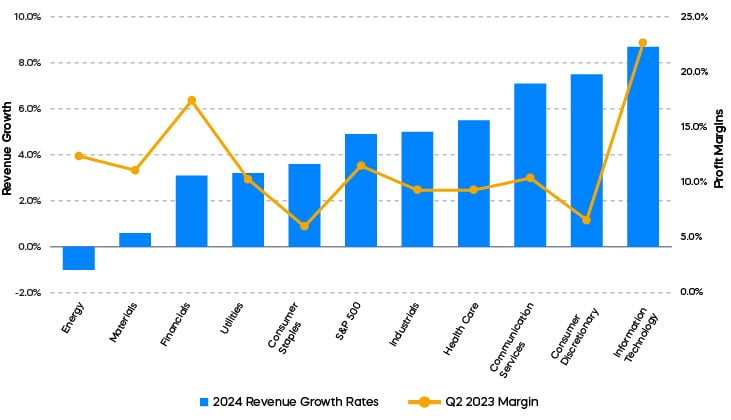
Economic growth has slowed down after an unprecedented series of rate hikes from the Fed, and some investors are finding that it has become more challenging to identify future growth opportunities. FactSet reports that analysts expect a paltry 2.5% revenue growth for the S&P 500 in 2023. Despite some tepid results of late, however, technology stocks may seem like an obvious candidate for investment. Not only are tech stocks forecasted to produce the highest revenue growth of any sector in 2024, as the chart below shows, but they also produced the highest profit margins in Q2 2023.

Tech Sector: Favorable Revenue Growth with Fat Margins

A bar and line chart that shows the 2024 revenue growth rates and profit margins from Q2 2023 for various sectors. Information technology has the highest revenue growth rate at over 8% expected in 2024. It also had the highest profit margins in Q2 2023 at over 20%, beating out sectors for energy, materials, financials, utilities, consumer staples, S&P 500, industrials, health care, communication services, and consumer discretionary

Source: FactSet. Revenue growth rates are consensus analyst expectations for 2024. Profit margins are as of Q2 2023.
 

2. The Technology Sector is an Unexpected Source for Dividends

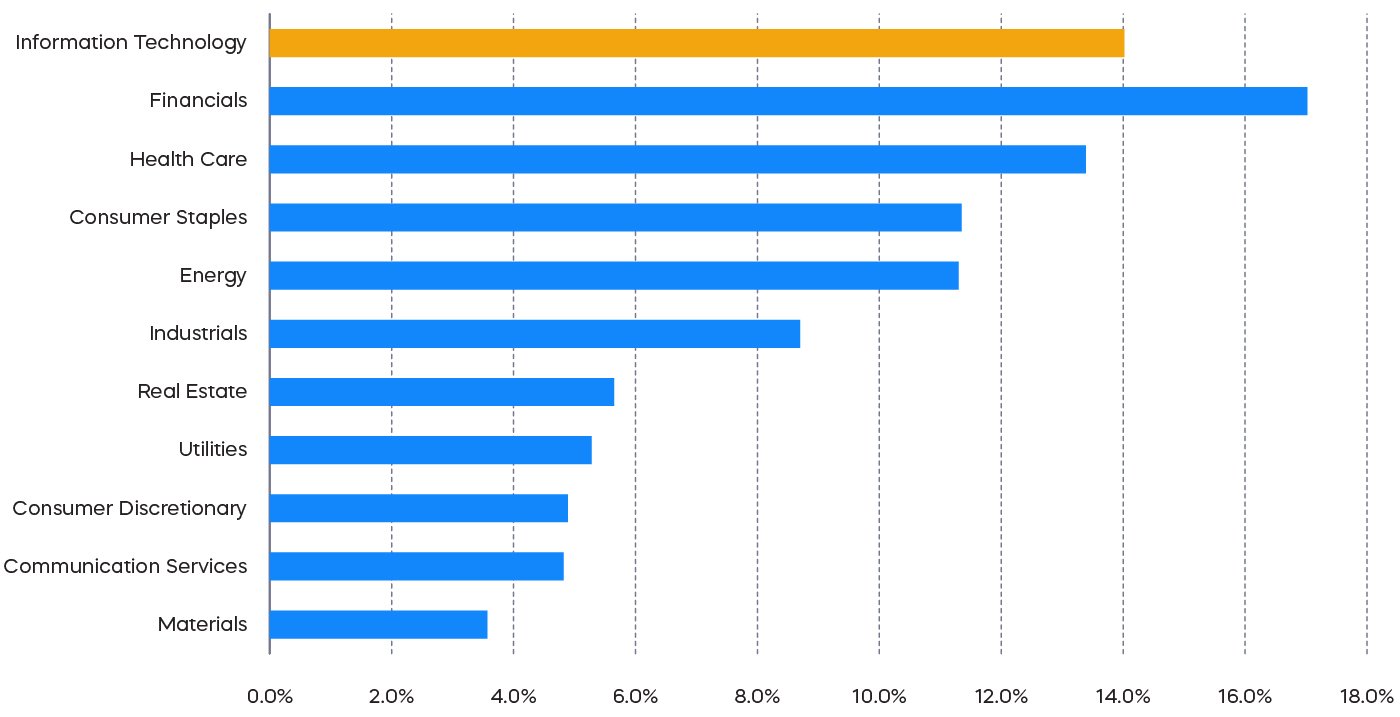
Despite the attractive growth profile of tech stocks, investors in them should be selective. Profits matter again now that rates are no longer at ultra-low levels. Case in point: a significant percentage of tech stocks from the S&P 1500 aren’t currently profitable.[1] One potential way to find profitable tech stocks with mature business models is by looking for companies with growing dividends. Increasingly, the tech sector is one of the market’s largest sources for dividends and has grown its dividends at the fastest rate.[2] The S&P Technology Dividend Aristocrats Index is a collection of technology-related stocks that have grown dividends for at least seven consecutive years.

Source of S&P 500 Dividends by Sector 2022

A bar chart of dividend growth rates for the S&P 500 dividends by sector in 2022. Information technology growth was at 14%, which was higher than all other sectors besides financials at 17% growth.

Source: FactSet. Dividends paid for 2022.
 

3. The Technology Dividend Aristocrats: Growth at a Reasonable Price

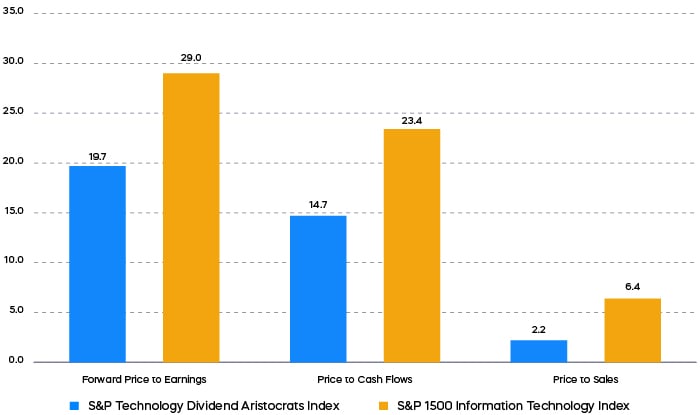
The valuation multiples of tech stocks have climbed steadily since the rally began earlier this year. They now stand at a lofty 35x trailing earnings, which is meaningfully higher than their 10-year average of 24x.[3] Asset allocators who are seeking attractively priced growth at what seems like a market inflection point face a potential dilemma. They can either overpay for growth, or remain on the sidelines and potentially get left behind if the market continues to rally. But as the chart below shows, the equally weighted S&P Technology Aristocrats Index provides a potential solution and may provide investors with growth at reasonable valuations.

Tech Aristocrats: Growth at a Reasonable Price

A bar chart of forward price to earnings, price to cash flows, and price to sales for both S&P technology dividend aristocrats and S&P 1500 information technology. Forward price to earnings for S&P technology dividend aristocrats is 19.7 and S&P 1500 information technology is 29. Price to cash flows for S&P Technology Dividend Aristocrats is 14.7 and S&P 1500 information technology is 23.4. Price to sales for S&P technology dividend aristocrats is 2.2 and S&P 1500 information technology is 6.4.

Source: FactSet. Data as of 7/31/2023. Forward price-to-earnings (forward P/E) is a version of the ratio of price-to-earnings (P/E) that uses forecasted earnings for the P/E calculation. This is not a forecast of a fund’s future performance. Price-to-cash-flow measures the value of a stock’s price relative to its operating cash flow per share. Price-to-sales uses a company's market capitalization and revenue to determine whether the stock seems to be valued properly. Past performance does not guarantee future results. Indexes are unmanaged, and one cannot invest directly in an index.
 

Learn more about how Technology Aristocrats may offer growth at a reasonable price.

[1] Source: FactSet as of 8/16/2023.

[2] FactSet

[3] FactSet


Learn More

Learn More

TDV

S&P Technology Dividend Aristocrats ETF

ProShares S&P Technology Dividend Aristocrats ETF seeks investment results, before fees and expenses, that track the performance of the S&P® Technology Dividend Aristocrats® Index.

Get the latest perspectives and updates.

Past performance does not guarantee future results.

This is not intended to be investment advice. Any forward-looking statements herein are based on expectations of ProShare Advisors LLC at this time.

There is no guarantee any ProShares ETF will achieve its investment objective.

Shares of any ETF are generally bought and sold at market price (not NAV) and are not individually redeemed from the fund. Your brokerage commissions will reduce returns.

Investing involves risk, including the possible loss of principal. This ProShares ETF is subject to certain risks, including the risk that the fund may not track the performance of the index and that the fund’s market price may fluctuate, which may decrease performance. Please see the summary and full prospectuses for a more complete description of risks.

Carefully consider the investment objectives, risks, charges and expenses of ProShares before investing. This and other information can be found in their summary and full prospectuses. Read them carefully before investing.

Technology companies may be subject to intense competition, product obsolescence, general economic conditions and government regulation and may have limited product lines, markets, financial resources or personnel.

Investments in smaller companies typically exhibit higher volatility. Small- and mid-cap companies may have limited product lines or resources, may be dependent upon a particular market niche and may have greater fluctuations in price than the stocks of larger companies. Small- and mid-cap companies may lack the financial and personnel resources to handle economic or industry-wide setbacks and, as a result, such setbacks could have a greater effect on small- and mid-cap security prices.

The "S&P® Technology Dividend Aristocrats® Index" is a product of S&P Dow Jones Indices LLC and its affiliates and has been licensed for use by ProShares. "S&P®" is a registered trademark of Standard & Poor's Financial Services LLC ("S&P") and "Dow Jones®" is a registered trademark of Dow Jones Trademark Holdings LLC ("Dow Jones") and have been licensed for use by S&P Dow Jones Indices LLC and its affiliates. ProShares have not been passed on by S&P Dow Jones Indices LLC and its affiliates as to their legality or suitability. ProShares based on the S&P Technology Dividend Aristocrats Index are not sponsored, endorsed, sold or promoted by S&P Dow Jones Indices LLC, Dow Jones, S&P or their respective affiliates, and they make no representation regarding the advisability of investing in ProShares. THESE ENTITIES AND THEIR AFFILIATES MAKE NO WARRANTIES AND BEAR NO LIABILITY WITH RESPECT TO PROSHARES.

ProShares are distributed by SEI Investments Distribution Co., which is not affiliated with the funds’ advisor or sponsor.

Your use of this site signifies that you accept our Terms and Conditions of Use.